Wellbeing of Wales, 2022 - A prosperous Wales
This report provides an update on progress being made in Wales towards the achievement of the 7 wellbeing goals
A PDF download of this document will be available soon.
In this page
The goal for a prosperous Wales
Authors: Jonathan Price and Luned Jones
An innovative, productive and low carbon society which recognises the limits of the global environment and therefore uses resources efficiently and proportionately (including acting on climate change); and which develops a skilled and well-educated population in an economy which generates wealth and provides employment opportunities, allowing people to take advantage of the wealth generated through securing decent work.
What have we learnt from the data in the last year?
The effects of the pandemic, and more recently, the war in Ukraine, have dominated other factors impacting economic outcomes, including the transition to a new trading relationship with the European Union.
Many of the national indicators included in this chapter relate to earlier years and do not yet reflect the more recent effects of these factors. However, other more timely data sources show that a major effect of the pandemic and the war in combination has been to raise inflation very sharply, with adverse consequences for living standards. This has particularly affected people on low incomes who spend more than average on food and energy.
Latest data for the UK show that real wages are falling (employee average regular pay fell 2.8% over the year after adjusting for inflation). ONS experimental statistics have shown that lower income groups have recently experienced higher than average rates of inflation.
At the time of writing the evolution of the cost of living crisis is highly uncertain, depending heavily on external circumstances, and particularly the Ukraine conflict. In addition, the UK Government could put in place further measures which mitigate some of the effects.
Recent research and analysis, including by the Bank of England, has indicated that negative effects on economic activity of the shift to new trading relations with the European are already identifiable, though many of the consequences will play out only over time.
Underlying Welsh economic performance continues to be weaker than the UK as a whole in terms of economic output (gross value added) and household income (gross disposable household income and median household income), but is broadly similar to those parts of the UK with similar features and characteristics.
Labour market data is volatile over the short term and it is important not to over-interpret recent changes, particularly in the context of the pandemic. With this caveat, labour market data suggests the pandemic has impacted Welsh economic performance in a way that is broadly similar to the UK (excluding London).
While Welsh performance on pay and productivity remains less positive than labour market performance, data indicates modest improvements in Wales’ relative productivity over the last decade, reversing deterioration prior to the recession of 2008.
It is too soon to assess the effects of the pandemic on young people, though early evidence indicates that they have been disproportionately affected by the socio-economic consequences. There is evidence in particular that the disruptive effects on education have affected young people from disadvantaged backgrounds. Depending on the effectiveness of mitigations in place, the adverse effects could play out in the labour market over coming years or even decades.
A new national milestone on participation in education and the labour market was set in 2021 which is that at least 90% of 16 to 24 year olds will be in education, employment, or training by 2050. Provisional estimates for 2020, show an increase in young people’s participation in education and the labour market driven by increased participation in education or training. It is too soon to assess the impact of the pandemic on this trend.
A new national indicator on the proportion of employees whose pay is set by collective bargaining was introduced in December 2021 based on data from the Annual Survey of Hours and Earnings. 57% of employees were covered by collective bargaining arrangements in 2021, where pay and conditions are negotiated between an employer and a trade union. This is slightly higher than in recent years.
In April 2021, the (full-time) gender pay gap was 5.0%, unchanged on the previous year and the lowest rate ever recorded.
The qualification profile of the Welsh population has been improving over time, though there were some changes to longer term trends in 2021. There continues to be an improvement in the share of people qualified at higher levels, but there was also an increase in the proportion of adults with no qualifications.
Children from deprived backgrounds continue to have poorer outcomes than other groups. Girls continue to outperform boys.
What is the longer term progress towards the goal?
Progress towards the goal has been mixed, with major improvements in overall labour market performance but less progress in addressing poverty, low productivity and pay, and low income levels. Progress has been made on decarbonisation, but more rapid change will be needed in future to meet targets.
The pandemic and the war in Ukraine have had a dominant effect on the most recent data, and the implications for longer term trends is unclear. For this reason, the following conclusions are drawn mainly on the basis of pre-pandemic evidence.
As across the UK as a whole, the growth in the economy and in real incomes has been sluggish since the recession of 2008, reflecting weak productivity growth. Over the longer run, since 1999, Wales has broadly kept pace with the UK as a whole, but its performance continues to be weak compared with many other parts of the UK.
Average household incomes in Wales are considerably closer to the UK average than gross value added (GVA) per head, with differences depending on the measure used and with the gap smallest when assessed for the median household.
The national milestone on employment (based on the Annual Population Survey) is to eradicate the gap between the employment rate in Wales and the UK by 2050, with a focus on fair work and raising labour market participation of under-represented groups. The historic gaps in employment and activity rates between Wales and other parts of the UK have narrowed, with Wales out-performing some English regions. This represents a marked change from the period prior to devolution in the 1980s and 1990s.
Wales has more people in low paid work than some other parts of the UK. In addition, the evidence on other aspects of the quality of work suggests a mixed picture in Wales.
The qualification profile of the Welsh working age population has been improving over time. One of the national milestones on qualifications is that 75% of working age adults in Wales will be qualified to level 3 or higher by 2050. In 2021, 62.5% of working age adults in Wales were qualified to the level 3 threshold. This is an increase from just over a half in 2011. The other national milestone on qualifications is that the percentage of working age adults with no qualifications will be 5% or below in every local authority in Wales by 2050. In 2021, three of Wales’ 22 local authorities have 5% or less of working age adults with no qualifications.
Attainment in secondary schools rose in the years before the pandemic, although children from deprived backgrounds still have poorer outcomes.
Management of the interaction between economic growth and the development of an innovative, low carbon economy is complex and poses challenges, but there are positive signs in some sectors.
Travel makes a substantial contribution to carbon emissions, but there is no evidence of a shift away from cars as the main method of travel.
The pandemic appears to have accelerated the trend to remote economic activity, including working from home. The longer-term consequences are uncertain. Increased home working and internet retail may increase the challenges faced by some urban centres. Evidence from the UK as a whole indicates that the greater scope for home working may have encouraged more women to participate in the labour market.
UK data indicates that road traffic has recovered to levels similar to those seen before the pandemic (albeit with a small reduction in car travel offset by an increase in goods traffic). However, public transport (both rail and bus) remains at a level that is well below that observed prior to the pandemic.
Economic performance
As across the UK as a whole, the growth in the economy and in real incomes has been sluggish since the recession of 2008, reflecting poor productivity growth.
Immediate prospects also appear poor, with high inflation reducing real incomes and the prospects of an economic slowdown and perhaps a recession.
Over the longer run, since 1999, and taking economic indicators in the round, Wales has broadly kept pace with the UK. While its economic performance continues to be weak compared with many other parts of the UK, productivity data over the last decade gives some grounds for optimism. However the gap with the UK as whole remains large, and the UK itself does not perform strongly when compared internationally.
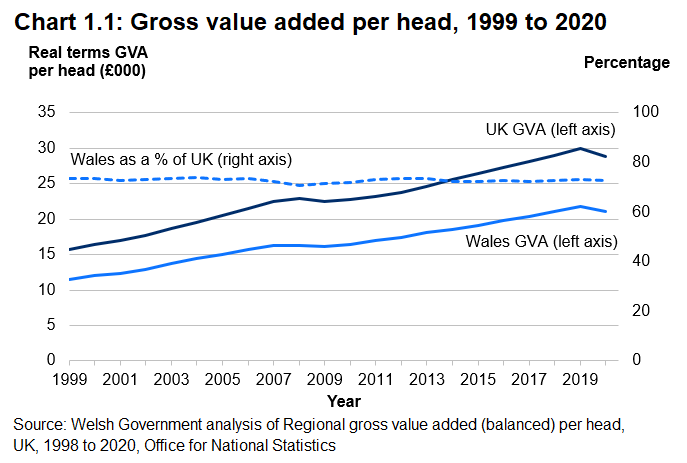
Gross value added (GVA) represents the value of all goods and services produced in an area. It is both the source of the real incomes people earn and the base on which taxes can be levied to fund public services.
While GVA per head of population in Wales has grown broadly in line with the UK since 1999, it remains lower than almost all other countries and regions of the UK.
Looking at progress more recently, GVA per head in Wales fell faster in 2020 than across the UK as a whole. It decreased by 3.8%, compared to 3.4% for the UK (not accounting for inflation).
Economic data does not yet permit a definitive assessment of Wales’s comparative economic performance over the course of the pandemic. In broad terms the relative scale of the impact looks similar in Wales to the UK as a whole. Performance on GVA per head is mainly a reflection of relatively low productivity levels. Productivity, measured as GVA per hour worked continues to be lower in Wales than almost all other parts of the UK. In 2020 it was 84.3% of the UK figure, an increase of 0.2 percentage points over the previous year.
Data covering the most recent decade confirms modest improvements in relative productivity (GVA per hour worked), perhaps reversing a trend of deterioration prior to the recession.
Household income
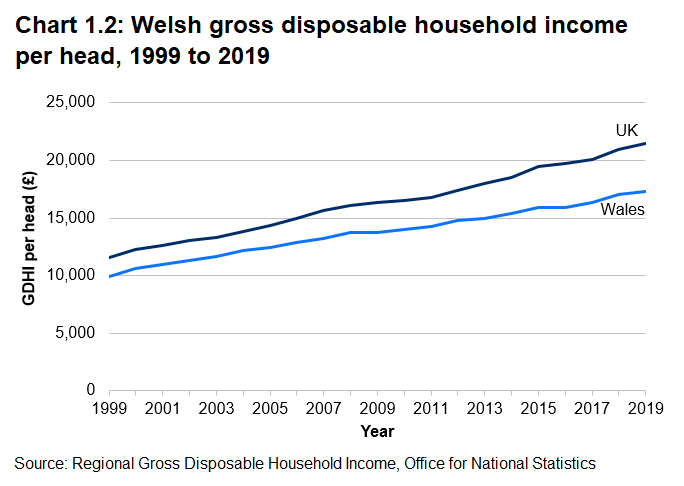
Household income is a better indicator of people’s prosperity and material wellbeing than GVA. Average household incomes in Wales are considerably closer to the UK average than GVA per head, but there are differences depending on the measure used, with the gap narrowest when median incomes are considered. Data is currently available only up until 2019, so this section focuses on longer run trends.
The national indicator on income uses the measure gross disposable household income (GDHI). On this measure Wales, according to the most recent data (2019), is at 81% of the UK figure, having fallen from 88% at its peak in 2003. This relative fall has partly been driven by a steep increase in household incomes in London, which has helped to drive up the UK average.
Whilst Wales has the second lowest GDHI per head of the UK countries and regions, it is broadly comparable to areas of the UK with similar characteristics.
Labour market
Over the last year, changes in the Welsh labour market have been driven by the effects of the pandemic and, more recently, the war in Ukraine. Taking a longer term perspective, the labour market in Wales continues to perform strongly in relative terms, with the gap between Wales and the UK narrow in comparison with the historic position.
The Labour Force Survey (LFS) remains the main source for headline labour market indicators at a Wales level. The larger sample of the Annual Population Survey (APS) allows for estimates at a local authority level and for sub-groups of the population and is the source for the national indicators and related national milestones. As most labour market data is survey-based and volatile, short term changes should not be over-interpreted.
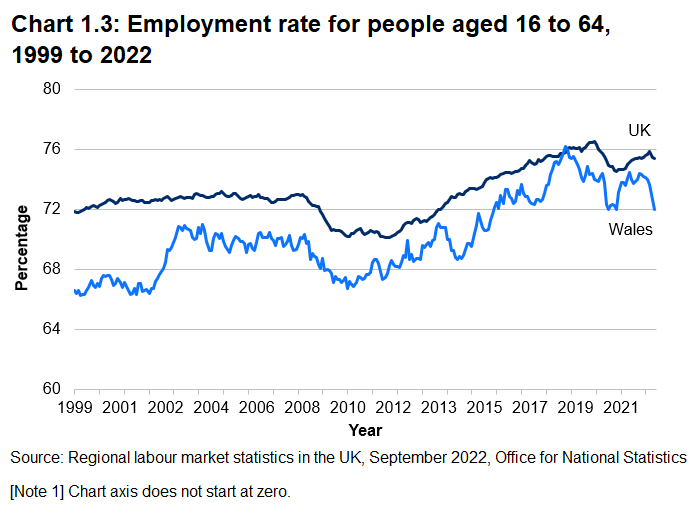
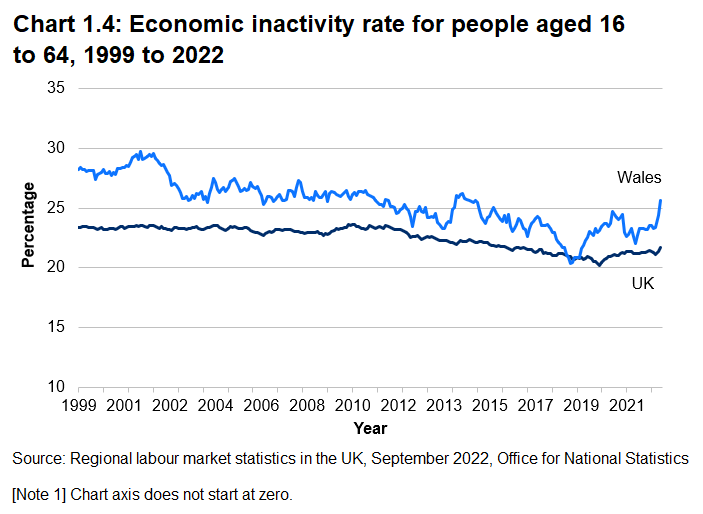
In broad terms, according to the LFS, over the last year the unemployment rate decreased, showing some recovery from the impact of the pandemic. However, the employment rate has decreased and economic inactivity has also increased. The gaps in employment and activity rates between Wales and the UK remain narrow in a historical context, with Wales out-performing a number of UK regions.
The national milestone on employment (based on the APS) is to eradicate the gap between the employment rate in Wales and the UK by 2050, with a focus on fair work and raising labour market participation of under-represented groups. According to the APS, the employment rate for people aged 16 to 64 in Wales was 73.1% in the year ending December 2021 whilst the UK rate was 74.7%. Since 2001, the employment rate has increased by 6.0 percentage points in Wales and by 2.4 percentage points in the UK.
COVID-19 has had adverse labour market effects which have disproportionately affected groups that were already disadvantaged. This includes people in low paid jobs, in less secure employment, young people, people reaching the end of their working lives, and people in various groups that were already experiencing labour market inequalities. Further analysis of the impact on inequalities is included in the More Equal Wales chapter.
Data from more timely administrative sources indicates that the labour market in Wales has generally tracked with wider UK (excluding London) during the pandemic. Data from the PAYE Real Time Information shows that the number of paid employees has generally increased in recent years, but fell during the pandemic. The number of paid employees began increasing again at the end of 2020 and is now above the pre-pandemic level. This data set does not include those that are self-employed.
Note that the national indicator and milestone uses data from the Annual Population Survey which is based on a larger sample, but less timely.
Participation in education and the labour market
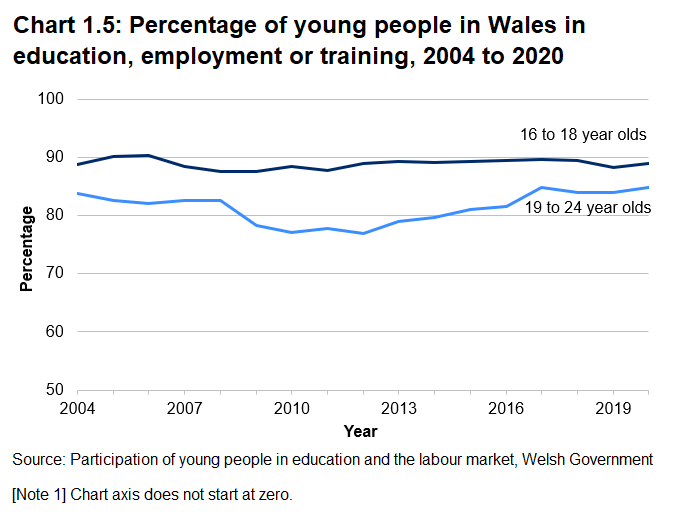
A new national milestone on participation in education and the labour market was set in 2021 which is that at least 90% of 16 to 24 year olds will be in education, employment, or training by 2050.
Provisional estimates for 2020, the first covering any period of the pandemic, show an increase in young people’s participation in education and the labour market driven by increased participation in education or training. It is too soon to assess the longer term impact of the pandemic on this trend.
Using the main measure of young people in education, employment or training, there had been decreases in both the 16 to 18 and 19 to 24 age groups between 2017 and 2019. The proportion for both groups then increased in 2020. For 16 to 18 year olds, this followed a period where the proportion remained stable at around 89 to 90% between 2012 and 2018.
The effect of the 2008 recession was felt more sharply by the 19 to 24 age group. Since then and up to 2017, the share in education or the labour market gradually increased. At the end of 2020, the first increase since 2017, the rate stood at 84.8%, nearly 8 percentage points higher than in 2012.
For the 16 to 24 age group as a whole, 86% were in education, employment or training in 2020.
More recent figures on young people in education, employment or training are available from a secondary, less robust source. These suggest a decrease in participation in 2021, more so for the 16 to 18 age group.
Fair work and earnings
A new national indicator on the proportion of employees whose pay is set by collective bargaining was introduced in December 2021, based on data from the Annual Survey of Hours and Earnings. Some 57% of employee jobs were covered by collective bargaining arrangements in 2021, where pay and conditions are negotiated between an employer and a trade union. This is higher than in recent years. It is also considerably higher than for each of the other UK countries and England regions and reflects the relatively higher share of employees in Wales who work in the public sector and in manufacturing.
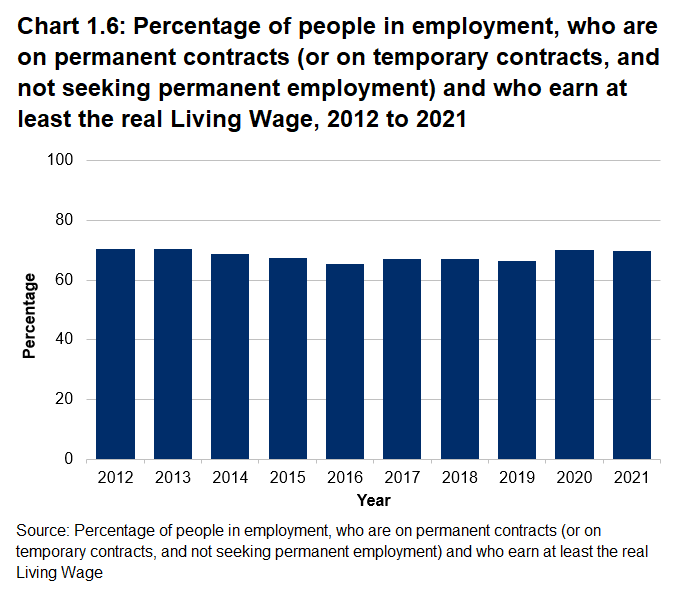
One of the national indicators on fair work and earnings was amended in December 2021 and now considers the percentage of people in employment, who are on permanent contracts (or on temporary contracts, and not seeking permanent employment) and who earn at least the real Living Wage. The real living wage is calculated by the Living Wage Foundation who determine the methodology. It aims to reflect the cost of living.
In 2021, 70% of those people on permanent contracts (or on temporary contracts, and not seeking permanent employment) earned at least the real Living Wage, the same proportion as in 2020, and higher than in the previous six years. This is based on the real Living Wage for 2021/22 as published in November 2021.
Data from the National Survey for Wales suggests that the percentage of people satisfied with their job remains broadly unchanged, standing at 82% in 2019-20. Job satisfaction tends to increase with age.
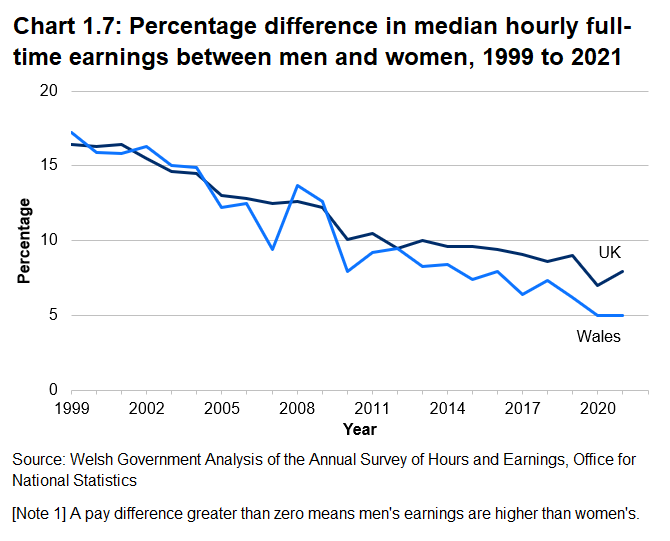
A new national milestone has been set, to eliminate the pay gap for gender, disability and ethnicity by 2050. Over the long-term, the gender pay gap (on a median hourly full-time basis and excluding overtime) has narrowed. In April 2021, the (full-time) gender pay gap was 5.0%, unchanged on the previous year and the lowest rate ever recorded. The gap widened in the UK to 7.9%.
The gender pay gap for all employees remains considerably higher at 12.3%. This is because women fill more part-time jobs, which in comparison with full-time jobs have lower hourly median pay.
These gaps do not take into account differences in education levels and experience, which vary across genders and affect earning levels.
Poverty and deprivation
The 2020-21 data collection process for the DWP Family Resources Survey was impacted by COVID-19. Because of this, for many breakdowns of estimates of income poverty and material deprivation (including for Wales) it is not possible to make meaningful statistical assessments of trends and changes. Therefore, the latest poverty and material deprivation statistics for 2020-21 relate to the UK overall only, and are subject to more uncertainty than usual.
People living in relative income poverty are those who live in a household where the total household income from all sources is less than 60% of the average UK household income (as given by the median). There was a reduction in UK median household income between 2019-20 and 2020-21, and changes in UK household income (before housing costs) varied across the income distribution.
- The household incomes of individuals in the bottom quarter of the income distribution recorded positive real terms income growth.
- Those between the 30th and 80th percentiles recorded a reduction in real incomes.
- There was a more mixed picture for the highest income quintile.
The percentage of UK individuals in relative low income decreased both before and after housing costs in 2020-21. The pattern was similar for the different age groups of children, working age adults, and pensioners.
Material deprivation is a measure of living standards, and a person is defined to be living in material deprivation if he or she is not able to access a certain number of goods and services. Low income households are those that had a total household income below 70% of the UK average household income, before housing costs were paid. Across the UK, in the year to 2020-21, a fall in material deprivation was recorded for pensioners, and in the measures of combined low income and material deprivation for children. However, the introduction of coronavirus (COVID-19) pandemic restrictions impacted on the measurement of material deprivation which means that recorded levels are not directly comparable with previous years.
A person is considered to be in persistent poverty if they are in relative income poverty in at least 3 out of 4 consecutive years. Data from the Understanding Society survey shows that an individual in Wales had a 12% likelihood of being in persistent poverty between 2016 and 2020 (after housing costs were paid). A child in Wales had a slightly higher likelihood of being in persistent poverty at 13%.
A national indicator on the percentage of households spending 30% or more of income on housing costs was added to the national indicator set in December 2021, based on data from the Family Resources Survey. Across all tenures, for the latest financial years for which data is available (2017 to 2020) 19.4% of households spend 30% or more of their income on housing costs. This percentage has been fairly consistent over the period 2011-12 to 2019-20, but varies by housing tenure.
Qualifications
The qualification profile of the Welsh population has been improving over time, though there were some changes to longer term trends in 2021.
Skills and qualifications are the biggest single influence on people’s chance of being in employment and on their incomes.
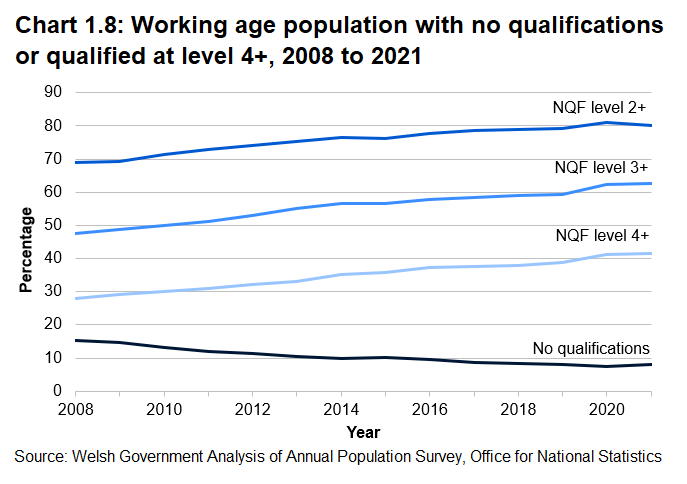
Latest data shows there continues to be an improvement in the share of people qualified at higher levels. In 2021, 41.6% of working age adults were qualified to at least higher education level (known as NQF level 4), nearly 14 percentage points higher than when statistics were first produced on the 18 to 64 working age adults definition in 2008.
One of the national milestones on qualifications is that 75% of working age adults in Wales will be qualified to level 3 or higher by 2050. In 2021, 62.5% of working age adults in Wales were qualified to the level 3 threshold. This is an increase from 51.3% in 2011.
Over the last decade, there have been large falls in the share of working age adults with no qualifications, though this proportion increased from 7.4% in 2020 to 8.1% in 2021. The proportion of working age adults qualified to at least level 2 (equivalent to 5+ GCSEs at grade A* to C) also decreased in 2021 to stand at 80.1%, down from 80.9% in 2020.
Older adults are more likely to have no qualifications than younger adults.
There are higher proportions of males than females with no qualifications in nearly all age groups. Females are more likely to hold qualifications at or above level 4.
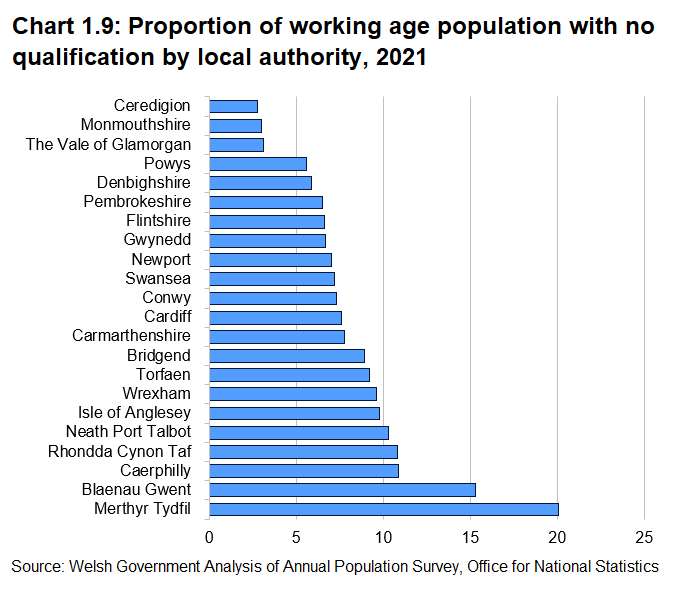
The other national milestone on qualifications is that the percentage of working age adults with no qualifications will be 5% or below in every local authority in Wales by 2050. In 2021, three of Wales’ 22 local authorities have 5% or less of working age adults with no qualifications; Ceredigion (2.8%), Monmouthshire (3.0%), and the Vale of Glamorgan (3.1%). The proportion of working age adults with no qualifications was highest in Merthyr Tydfil (20.1%) and Blaenau Gwent (15.3%).
Attainment in schools
Attainment in schools rose in the years prior to the pandemic, although children from deprived backgrounds still have poorer outcomes.
In the 2021/22 academic year 54% of pupils aged 4 were at a stage of development in mathematics that would be consistent with or greater than their age according to the Foundation Phase framework, with 87% of pupils within one stage of the development consistent with their age. In language, literacy and communication in English 53% of pupils were at a stage of development that would be consistent with or greater than their age, with 85% of pupils within one stage of the development consistent with their age. These figures are lower than in 2019. The picture is different for language, literacy and communication in Welsh, where 27% of children were at a stage consistent with their development. This is due to children from non-Welsh speaking families being enrolled in Welsh medium schools.
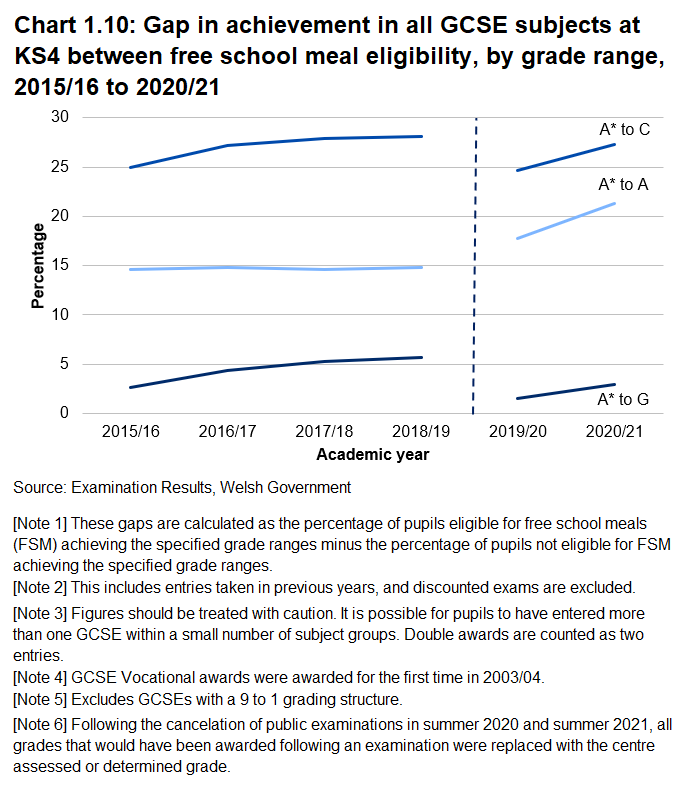
At GCSE there remains a gap in educational outcomes of children in school eligible for free school meals and those who are not. The gap in entries achieving A* to A grades at GCSE has widened in the last six years, with the gap in entries achieving A* to C grades being relatively stable. Data up to 2019 indicates that at earlier stages of school the gap widens as pupils get older.
In 2020/21, the gap between pupils not eligible for free school meals (FSM) and pupils eligible for FSM awarded GCSE grades A* to A widened to 21.3 percentage points, from 17.8 percentage points in 2019/20. The gap had previously been relatively stable at around 14.7 percentage points between 2015/16 and 2018/19 before widening in the most recent 2 years.
In 2020/21 the gap between pupils not eligible for FSM and pupils eligible for FSM awarded grades A*to C widened to 27.3 percentage points, returning to a gap similar in size to the years leading up to the pandemic after a fall to 24.7 percentage points in 2019/20.
Following the cancellation of public examinations in summer 2020 and summer 2021, all grades that would have been awarded following an examination were replaced with the centre assessed or determined grade.
Greenhouse gas emissions from business
Managing the interaction between economic growth and an innovative, low carbon economy is complex and poses challenges, but there are positive signs.
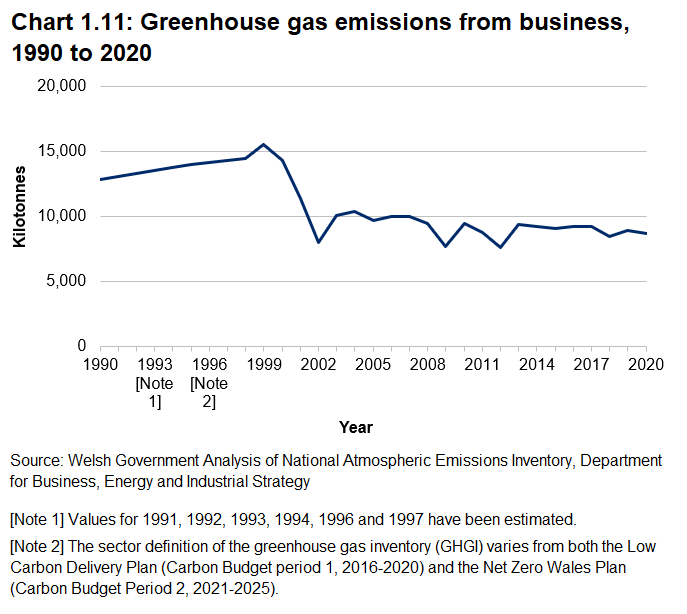
Overall, greenhouse gas emissions have fallen by 39.2% since the base year (1990). It accounted for over a quarter of Welsh emissions (26%). Emissions from this sector have decreased substantially since 1990 (by 32%).
Historically, the business sector has been the second largest source of greenhouse gas emissions (after the energy supply sector). However, in 2020 the business sector was the largest source of emissions following a decrease in emissions from the energy supply sector. This was driven by a reduction of natural gas combustion (mainly from a reduction in output from Pembroke power station), reduced emissions from petroleum refining and the closure of Aberthaw power station in 2020 marking the end of coal-fired energy generation in Wales.
Mode of travel
Some forms of travel make a substantial contribution to carbon emissions, but there is no evidence yet of a shift away from cars as the main method of travel by road.
Major declines in travel have occurred during the pandemic with UK data suggesting this affected all modes other than walking and cycling. Road traffic volume in Wales decreased by 23.4% in 2020. The number of journeys undertaken on local bus services dropped by 71.4%, and the total distance travelled by local bus services in 2020-21 decreased by 36.0% compared to the previous year.
More timely UK data indicates that road traffic has recovered to levels similar to those seen before the pandemic (albeit with a small reduction in car travel offset by an increase in goods traffic). However, public transport (both rail and bus) remains at level that is well below that observed prior to the pandemic.
A national indicator on the percentage of journeys by walking, cycling or public transport was added to the national indicator set in December 2021. This data will be sourced from a National Travel Survey for Wales which is currently under development. In the short-term, data from the Labour Force Survey on usual mode of travel to work can be considered.
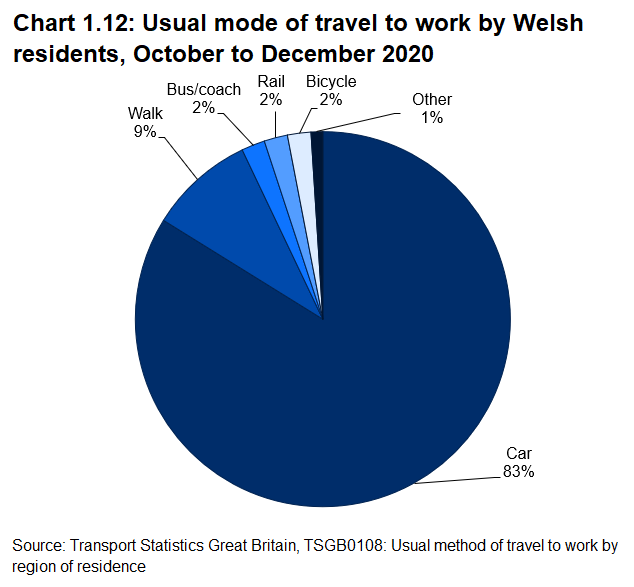
As in most other parts of the UK outside London, private road transport remains the dominant mode of travel and accounts for the overwhelming majority of commuting journeys in Wales. In 2020, 83% of commuters in Wales used a car as their usual method of travel. This is slightly higher than in the previous 5 years, but likely to have been due to COVID-19.
In the National Survey (online survey) 2020-21, people were asked about environmental behaviours as part of every day life. 30% of people avoided or cut down travelling by plane and 39% avoided or cut down travelling by car. Of those reducing car travel, a quarter said that concerns about pollution/limiting the effects of climate change was the main reason and a quarter said that helping them keep fit was the main reason. Cost was given as the main reason for 18%. However, there is yet no evidence of such behaviours resulting in an identifiable change in overall travel patterns.
There has been a considerable increase in the number of newly registered ultra-low emissions vehicles in Wales in recent years, with the number increasing nearly five-fold between 2019 and 2021, to over 6,000. At the end of 2021, there were over 14,000 licensed ultra-low emission vehicles registered in Wales.
Over time, reduced reliance on petrol and diesel vehicles and increased use of ultra-low emission vehicles could contribute to a reduction in emissions.
Further reading
Previous versions of the Wellbeing of Wales report include further analysis of relative income poverty.
Labour market overview, provides a monthly update on the Welsh labour market.
The Welsh economy in numbers dashboard shows trends in the key economic outcomes for Wales, compared to the UK.
Transport Statistics Great Britain (Department of Transport) is an annual compendium of transport statistics, including data for Wales on a number of topics.
Data sources
Economic performance
Regional and sub-regional productivity in the UK: July 2022 (Office for National Statistics)
Household income
Gross disposable household income (Office for National Statistics)
Labour market
Regional labour market statistics in the UK Statistical bulletins (Office for National Statistics)
Participation in education and the labour market
Fair work and earnings
Calculate the Real Living Wage (Living Wage Foundation)
Percentage of people moderately or very satisfied with their jobs by age (StatsWales)
Poverty
Relative income poverty ( Department for Work and Pensions)
Material deprivation ( Department for Work and Pensions)
Persistent poverty, Understanding society (Department for Work and Pensions)
Qualifications
Highest qualification levels of working age adults by year and qualification
Education
Academic achievement of pupils in Foundation Phase baseline assessment and at Key Stage 3, 2022
Examination results: September 2020 to August 2021
Businesses
Emissions of greenhouse gases by year (StatsWales)
Travel
Transport Statistics: Great Britain 2021 (Department for Transport)
Public service vehicles (buses and taxis): April 2020 to March 2021
Ultra-low emission vehicle statistics (Department for Transport)