Wellbeing of Wales, 2022 - A more equal Wales
This report provides an update on progress being made in Wales towards the achievement of the 7 wellbeing goals
This file may not be fully accessible.
In this page
The goal for a more equal Wales
Author: Sue Leake
A society that enables people to fulfil their potential no matter what their background or circumstances (including their socio economic background and circumstances).
In 2002 the Welsh Government adopted the Social Model of Disability. This model sets out a different way to view disability. Rather than defining people as disabled by their impairment (i.e. the medical model of disability), people with impairments are considered to be disabled by physical, attitudinal and organisational barriers created by society.
The data reported here are derived from a range of sources reflecting the most reliable, recent data available. Many of these sources use definitions of disability which are informed by the medical model in line with the Equality Act 2010 definition. In the Equality Act a disability means a physical or a mental condition which has a substantial and long-term impact on your ability to do normal day to day activities.
What have we learnt from the data in the last year?
The coronavirus (COVID-19) pandemic had a disproportionate effect on many different population groups, with older people, men and people in ethnic minority groups more at risk of becoming seriously ill with the disease in the early stages whilst the more indirect impact of socio-economic harms are more likely to have been felt by groups that are already disadvantaged. This includes young people, women, disabled people and ethnic minority groups.
The recent rise in inflation will have particularly affected people on low incomes. The longer term consequences of the pandemic and recent world events’ impact on inflation remain highly uncertain at the time of writing. Whilst It is too soon to assess the full effects of the pandemic on young people, early evidence indicates that they have been disproportionately affected by the socio-economic consequences. There is evidence in particular that the disruptive effects on education have affected particularly young people from disadvantaged backgrounds.
Socio-economic disadvantage
In 2021-22, 11% of adults were classed as materially deprived (that is, unable to afford certain things such as keeping the house warm enough, making regular savings, or having a holiday once a year). Nearly half (49%) of single parents were in material deprivation in 2021-22 and 2% of households said they had received food from a food bank during 2021-22.
Although general mortality rates are normally higher in more deprived areas, in 2021 the age-standardised mortality rate of deaths registered due to COVID-19 in the most deprived areas in Wales was 74% higher than that in the least deprived areas.
New data on housing affordability shows that for the latest financial years for which data is available (2017-2020) 19.4% of households spend 30% or more of their income on housing costs.
Gender
Girls continue to achieve better educational outcomes at GCSE. In summer 2021, girls were awarded more grades at A* to C than boys. The largest grade disparity was at the A* and A grade: girls were awarded 6.5 and 4.5 percentage points, respectively, more than boys. The grade disparity at A* widened in 2021.
In April 2021, the (full-time) gender pay gap was 5.0%, unchanged on the previous year and the lowest rate ever recorded.
Age
Provisional estimates for 2020, the first covering any period of the pandemic, show an increase in young people’s participation in education and the labour market, driven by increased participation in education or training, though it is too soon to assess the full impact of the pandemic on this trend.
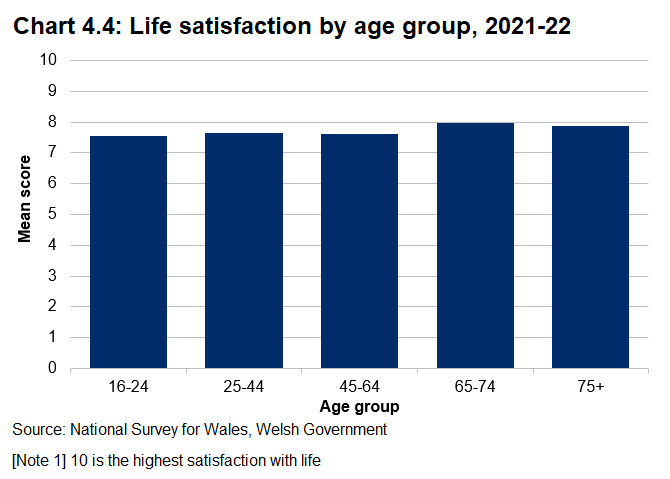
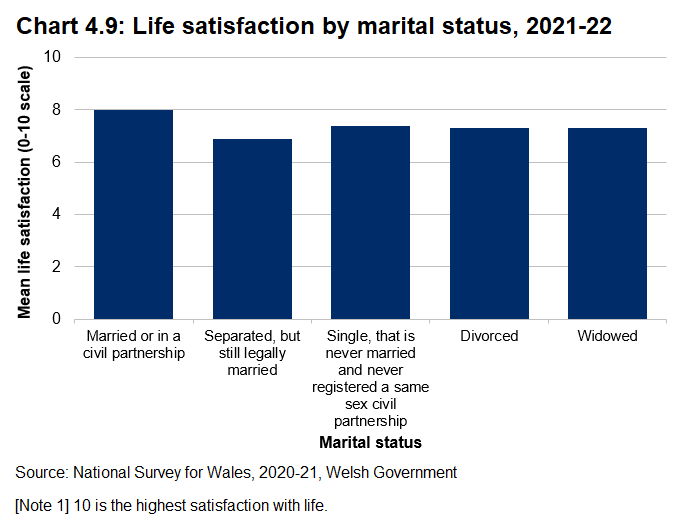
Our satisfaction with life tends to be higher in the older age groups.
A separate sub-report on well-being in children and young people has been published alongside this report. This assesses the experiences of this group in more detail.
Ethnicity
5.0% of the Welsh population described themselves as Black, Asian or another minority ethnic group in 2018 to 2020. The second largest ethnic group (after White) is Asian, at 2.3% of the population.
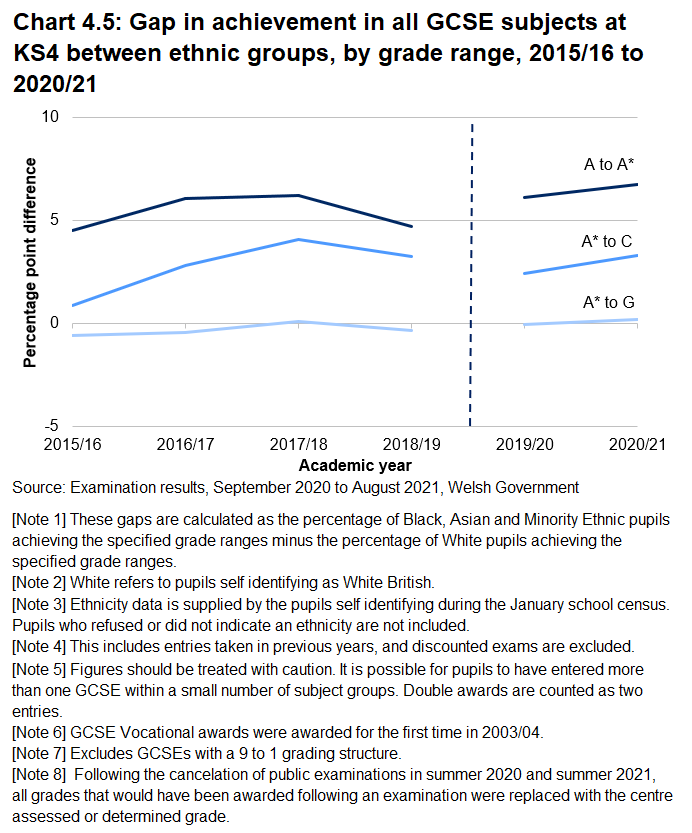
Children from some ethnic groups continue to achieve better on average in school compared to others, with greater proportions of GCSE entries by Black, Asian and Minority Ethnic pupils awarded A* to A and A* to C grades in summer 2021 than White British pupils.
There was a 16% increase in recorded race hate crimes between 2019-20 and 2020-21, although the proportion of hate crimes with race as a motivation factor did not change.
Religion
Latest estimates (2018 to 2020) show that for the first time in Wales, the proportion of the population stating they had no religion (49.9%) was higher than the proportion identifying as Christian (45.8%). 1.7% of the population identified as Muslim and 2.4% with another religion (other than Christianity). Over two-thirds of the Muslim population live in south east Wales.
Whilst police-recorded hate crimes have generally increased in 2020-21, the number reported to have been motivated by religion reduced by a quarter.
Sexual orientation
Latest estimates (2020) show that 4.2% of the Welsh population identify themselves as gay or lesbian, bisexual or another sexuality (other than heterosexual).
There were 397 same-sex marriages in 2019, whilst same-sex civil partnerships have reduced substantially to around 40 a year since 2014.
The latest National Survey for Wales results available (2019-20) indicate that people who are lesbian, gay or bisexual are about twice as likely to report feeling lonely (particularly emotional loneliness) than others. They are also more likely to report having experienced discrimination at work
There were 884 hate crimes recorded by police in which sexual orientation was considered the motivating factor in 2020-21, increasing by 16% from 763 in the previous year, although the proportion of hate crimes with sexual orientation as a motivation factor did not change.
Disability
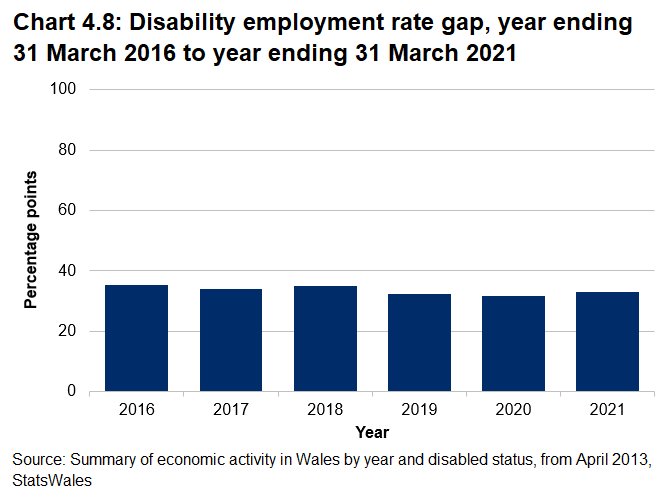
The employment rate among disabled adults aged 16 to 64 remains lower than among those who are not disabled. 46.7% of disabled adults aged 16 to 64 were employed in the year ending March 2021.
In 2021-22 just under one in five (19%) of people with a limiting long-standing illness or disability lived in a household in material deprivation. This is nearly three times as high as for people who are not disabled (7%).
The disability pay gap in Wales was 11.6% in 2021, up from 9.9% in 2018. This means that disabled people in Wales earned, on average, 11.6% less per hour than non-disabled people.
Marital status
It remains true that those who are married are less likely to be in material deprivation than those who are separated or divorced.
In 2020, there were 358 opposite-sex civil partnerships formed in Wales. This is the first year for which civil partnerships between opposite-sex couples have been reported following the change in legislation to extend civil partnerships to opposite-sex couples from 31 December 2019.
What is the longer term progress towards the goal?
Some inequalities are showing little sign of improvement in the last 5 years and some of those people who were already disadvantaged are likely to have been more impacted by the COVID-19 pandemic and, more recently, by the rise in inflation.
The percentage of people living in relative income poverty has been relatively stable in Wales for over 15 years.
Those who are divorced, separated or never married are still more likely to struggle financially, with single parent households most likely to be in material deprivation.
There remains a gap in educational outcomes of children in school eligible for free school meals and those who are not, with evidence that this is widening at the GCSE level. The gap at GCSE level has widened in the last 6 years, with data (up to 2019) indicating that at earlier stages of school the gap widens as pupils get older.
There is a national milestone to eliminate the pay gap for gender, disability and ethnicity by 2050. The gender pay gap has generally been narrowing, though remained stable in 2021. Latest data also shows that the ethnicity pay gap has decreased. On average, employees from ethnic minority groups earn around 1.4% per hour less than White British employees, although there are large differences among different ethnic minorities. The disability pay gap, which rose between 2014 and 2019 now appears to be reducing, though the employment situation during the COVID-19 pandemic may have had an impact on this trend.
Life satisfaction scores reduced slightly during 2020-21 but have generally returned to pre-pandemic levels in 2021-22 for all age groups except those aged 16 to 24 years. People aged 16 to 24 are now more likely to report being lonely than those aged 65 and over.
Other than young people, there are some other groups who are more likely to report feeling lonely. These include people with a limiting long-standing disability, people who are lesbian, gay or bisexual and people who are not White British
Children from some ethnic minority groups continue to achieve better on average in school compared to others, with greater proportions of GCSE entries by Black, Asian and minority ethnic pupils awarded A* to A and A* to C grades in summer 2021 than White British pupils.
Race is still judged to be a motivating factor in nearly two-thirds of all recorded hate crime, and there was a rise in recorded race hate crimes in 2020-21.
There is a longer term trend for fewer people to identify their religion as Christian and more people to state they had no religion. These remain the largest categories whilst the proportion of people identifying as Muslim has remained between 1% and 2%, and those identifying with any other religion between 2% and 3%.
The proportion of people identifying as gay or lesbian, bisexual or another sexuality (other than heterosexual) in Wales has doubled since 2016 (to 4.2%). Since 2014, when same-sex marriages became legal, the number of same-sex marriages has increased (to 397 in 2019) whilst the number of same-sex civil partnerships formed has reduced substantially to around 40 partnerships annually.
Hate crimes recorded by police in which sexual orientation was considered the motivating factor have continued to increase and account for almost one fifth of all recorded hate crimes, though Stonewall Cymru research suggests that many such incidents are not reported to the police.
Employment rates for disabled people were rising but decreased to a rate similar to December 2018 during the year ending March 2021. The employment rate among disabled adults (16 to 64) remains lower than among those who are not disabled.
Households including someone who is disabled are still more likely to struggle financially.
In general, educational outcomes for children with special educational needs or additional leaning needs have been improving.
Socio-economic disadvantage
Prior to the COVID-19 pandemic, overall poverty rates had remained relatively stable in Wales for over 15 years and children remained the age group most likely to be in relative income poverty. The recent rise in inflation will have particularly affected people on low incomes.
The Family Resources Survey is the main source for official poverty estimates. The 2020-21 data collection process for this survey was impacted by COVID-19. Because of this, for many breakdowns of estimates of income poverty (including for Wales) it is not possible to make meaningful statistical assessments of trends and changes. Therefore, the poverty and material deprivation statistics for people with different characteristics presented in this chapter relate to data up to 2019-20.
Between 2017-18 and 2019-20, nearly a quarter of the population (23%) were living in relative income poverty after paying their housing costs.
Children are the population group most likely to be in relative income poverty. The most recent figures show that this was the case for 31% of children in Wales compared to 18% of pensioners.
In 2021-22, 11% of adults were classed as materially deprived (that is, unable to afford certain things such as keeping the house warm enough, making regular savings, or having a holiday once a year). This is the case for a higher percentage of females (13%) relative to males (9%). However, this survey data preceded the current cost-of-living crisis. Single parent households are more likely to be materially deprived than other types of households. Nearly half (49%) of single parents were materially deprived in 2021-22.
A person is considered to be in persistent poverty if they are in relative income poverty in at least 3 out of 4 consecutive years. Data from the Understanding Society survey shows that an individual in Wales had a 12% likelihood of being in persistent poverty between 2016 and 2020 (after housing costs were paid). A child in Wales had a slightly higher likelihood of being in persistent poverty at 13%.
A national indicator on the percentage of households spending 30% or more of income on housing costs was added to the national indicator set in December 2021, based on data from the Family Resources Survey. Across all tenures, for the latest financial years for which data is available (2017 to 2020) 19.4% of households spend 30% or more of their income on housing costs. This percentage has been fairly consistent over the period 2011-12 to 2019-20, but varies by housing tenure. Whilst, in 2017-2020, only 2.7% of households who own their own home outright and 15.4% of those who own a home with a mortgage spend 30% or more of their income on housing costs, percentages are higher for the other two tenures; 37.1% for private rented households, 47.2% of those in social rented housing. The costs of domestic energy use such as gas and electricity are excluded from these housing costs as data on such costs are not collected in the FRS, but latest fuel poverty estimates are provided below.
In 2021-22, 2% of households said they had received food from a food bank due to a lack of money in the last 12 months, with a further 1% saying they hadn’t but had wanted to. An estimated 196,000 households (14% of households) were living in fuel poverty in October 2021, though the effect of the increase in domestic energy price cap in April 2022 is expected to have increased this substantially despite interventions to mitigate the impact.
Healthy life expectancy continues to be worse for those living in more deprived areas. The gap in healthy life expectancy between the most and least deprived areas has remained wide but relatively stable between 2011 to 2013 and 2018 to 2020.
Public Health Wales report that people living in the most deprived communities in Wales were less likely to take up their offer of health screening compared to those living in the least deprived communities across all adult health screening programmes in 2020-21.
COVID-19 mortality rates continued to be higher in the most deprived areas of Wales. In 2021, the age-standardised rate of deaths registered due to COVID-19 was 74% higher in the most deprived areas of Wales than in the least deprived areas.
At GCSE there remains a gap in educational outcomes of children in school eligible for free school meals and those who are not. The gap in entries achieving A* to A grades at GCSE has widened in the last six years, with the gap in entries achieving A* to C grades being relatively stable. Data up to 2019 indicates that at earlier stages of school the gap widens as pupils get older.
In 2020/21, the gap between pupils not eligible for free school meals (FSM) and pupils eligible for FSM awarded GCSE grades A* to A widened to 21.3 percentage points, from 17.8 percentage points in 2019/20. The gap had previously been relatively stable at around 14.7 percentage points between 2015/16 and 2018/19 before widening in the most recent 2 years.
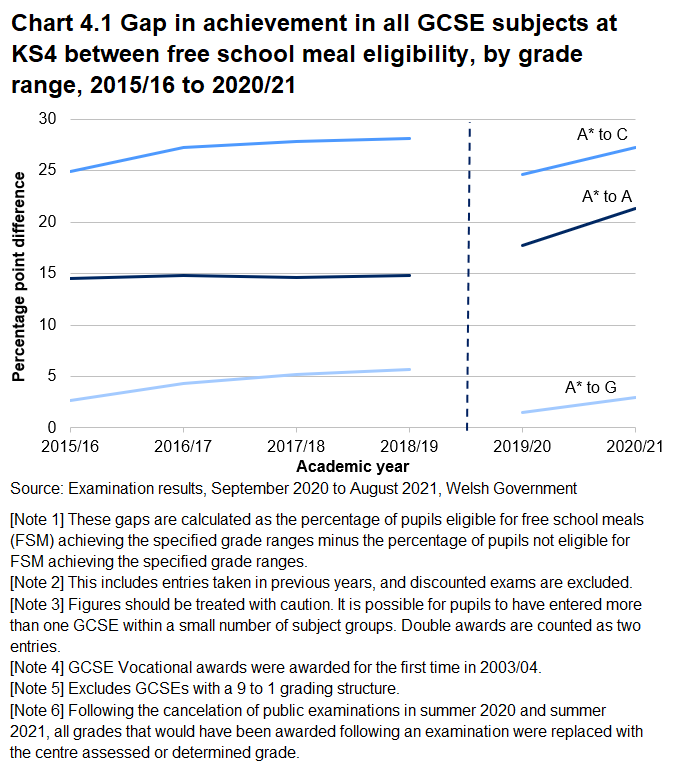
In 2020/21 the gap between pupils not eligible for FSM and pupils eligible for FSM awarded grades A* to C widened to 27.3 percentage points, returning to a gap similar in size to the years leading up to the pandemic after a fall to 24.7 percentage points in 2019/20.
Following the cancellation of public examinations in summer 2020 and summer 2021, all grades that would have been awarded following an examination were replaced with the centre assessed or determined grade.
Gender
Girls continue to achieve better educational outcomes at GCSE and are more likely to continue in full time education beyond age 16. The gender pay gap remained unchanged in Wales in 2021, and employment rates remain lower for women than men.
Life expectancy is still longer for women than for men but the proportion of life spent in good health is higher for men.
Public Health Wales report that, for programmes that invite all genders to participate in health screening, such as bowel cancer screening, there was a difference in uptake in 2020-21, with men less likely to take up their offer of screening than women (though the gap is small).
In terms of the direct impact of COVID-19, the age-standardised mortality rate of deaths registered due to COVID-19 was 50% higher for males than females in 2021, with an even greater difference observed in the most deprived areas of Wales.
In 2021-22, mental wellbeing (as measured by the Warwick Edinburgh Mental Well-Being Scale for adults) was slightly higher for men than women, with males having a mean score of 49.2 and females having a mean score of 48.7. Suicide rates, however, remain more than three times higher for men than women. Whilst over the long-term suicide rates have fluctuated from year to year but have generally been falling, this decline is far more pronounced in women than men.
Girls continue to achieve better educational outcomes at GCSE. In summer 2021, girls were awarded more grades at A* to C than boys. The largest grade disparity was at the A* and A grade: girls were awarded 6.5 and 4.5 percentage points, respectively, more than boys.
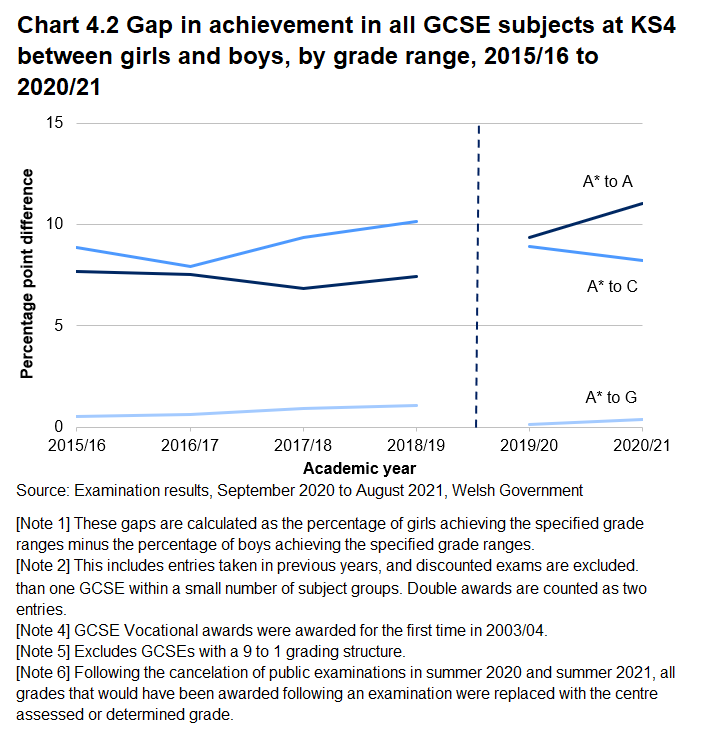
A higher proportion of females aged 16 to 18 than males remain in full-time education. This is also the case for those aged 19 to 24 years old.
In terms of the whole population, females are more likely to hold qualifications at or above level 4, whilst there are higher proportions of males than females with no qualifications in nearly all age groups.
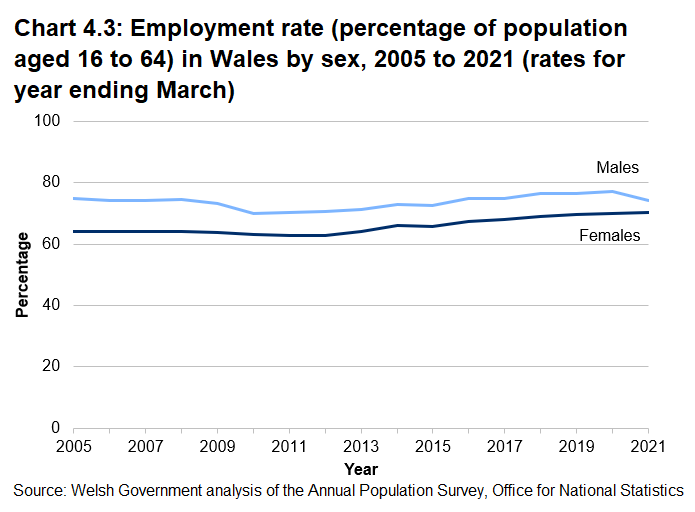
Employment rates in Wales are lower for women than for men, at 69.7% for women and 76.5% for men in 2021. Economic inactivity rates (excluding students) are higher for women (24.1%) than men over this period (15.7). Evidence from the UK as a whole indicates that the greater scope for home working may have encouraged more women to participate in the labour market.
The gender pay gap, based on median hourly full-time earnings (excluding overtime), stood at 5.0% in 2021, unchanged on the previous year and the lowest rate ever recorded. However, for part-time employees in Wales, women were paid the same as men on average, a decrease of 0.8 percentage points from the previous year (when women were paid more than men). For all employees, the gender pay gap remains considerably higher at 12.3% in 2021. This is higher than for each of full-time employees and part-time employees, because women fill more part-time jobs, which in comparison with full-time jobs have lower hourly median pay. Of the 11 UK countries and regions where men earn more than women (full-time employees), Wales has the second smallest pay gap.
Women are less likely to say they feel safe in their community, despite the latest data (from 2019-20) showing men being somewhat more likely to be victims of violent crime than women. During 2021-22, 51% of women said they felt safe in their community compared to 81% of men. In addition to this, women are around 4 times more likely to feel very unsafe while walking alone in their local area after dark than men (13% of women reported this compared to 3% of men).
In 2020-21, 56% of new public appointments and 46% of public re-appointments made by the Welsh Government were to females (where the gender of the appointee is known), the former being a 12 percentage point increase since 2019-20. This includes chairs and members regulated by the Public Appointments Commissioner. However, due to pandemic disruption, many competitions were suspended and as such any conclusions drawn from this year’s data need to be tentative and viewed with caution.
Age
Our satisfaction with life tends to be higher in the older age groups. Relative income poverty is higher in the working population than in pensioner households.
Initial results from the 2021 Census reveal the trend in population ageing has continued, with more people than ever before in older age groups in Wales. The proportion of the population who were aged 65 years or older in March 2021 was 21.3% (up from 18.4% in 2011). The size of the population aged 90 years or older in Wales (29,700, 1.0%) has increased since 2011, when 25,200 (0.8%) were 90 years or older.
Subjective wellbeing tends to be higher in the older age groups. In 2021-22 the highest average life satisfaction scores are for the 65 to 74 age group (8.0) and for the 75 and over group (7.9), and the lowest are for those aged 16 to 24 and 45 to 64 (7.6). Whilst life satisfaction for people aged 16 to 24 years was lower in 2021-22 compared with prior to the pandemic (2019-20), the pattern for other age groups has returned to pre-pandemic life satisfaction scores following a dip for each age group during 2020-21.
Public Health Wales report that, whilst many health screening programmes invite people from specific age ranges, people in younger age groups within the cohort invited were less likely to take up their offer of health screening compared to those in older age groups in 2020-21.
In recent years a higher proportion of the working-age population has been in relative poverty than pensioner households.
The employment rate is highest in the 25 to 49 age group whilst the employment rate for those aged 65 and over, which previously saw an increase, has been decreasing since 2019. It is too soon to assess the longer term effects of the pandemic on young people, though early evidence indicates that they have been disproportionately affected by the socio-economic consequences. There is evidence in particular, that the disruptive effects on education have affected particularly young people from disadvantaged backgrounds. Depending on the effectiveness of mitigations in place, the adverse effects could play out in the labour market over coming years or even decades.
A new national milestone on participation in education and the labour market by 16 to 24 year olds was set in 2021. Provisional estimates for 2020, show an increase in young people’s participation in education and the labour market, driven by increased participation in education or training. It is too soon, however, to assess the longer term impact of the pandemic on this trend.
Younger age groups are generally at higher risk of being victims of crime (including violent crime), with the 16 to 24 year age group experiencing the highest rates in most crime categories and people aged over 75 years experiencing the lowest rates of crime in Wales during the 12 months up to March 2020.
In 2020-21, 71% of new public appointments and re-appointments made by the Welsh Government were to individuals aged 55 or over (where the age of the appointee is known). This is a significant rise from 56% in 2019-20. However, due to pandemic disruption, many competitions were suspended and as such any conclusions drawn from this year’s data need to be tentative and viewed with caution.
Older people (aged 65 and over) are more likely to have a strong sense of community compared with younger age groups, whilst 91% of those aged 65 and over are satisfied with their local area as a place to live.
Ethnicity
Children from some ethnic groups (for example, Asian and children with a mixed ethnic background) tend to achieve better on average in school compared to others. However, employment rates and average pay remain lower for Black, Asian and minority ethnic groups and people in these groups are more likely to be in relative income poverty.
95.0% of the population described their ethnic group as White in 2018 to 2020, varying by region from 97.5% of the population in north Wales to 93.2% in south east Wales.
5.0% of the Welsh population describe themselves as Black, Asian or Minority Ethnic group. The second largest ethnic group (after White) in 2018 to 2020 is Asian, at 2.3% of the population.
In the 2021 Senedd Cymru elections, three members from an ethnic minority background were elected (5% of all members elected).
GCSE results for 2020/21 show that 35.6% of Black, Asian and Minority Ethnic pupils achieved A* to A grades compared to 28.9% of White pupils. This gap has been widening since 2015/16 (4.5 percentage points in 2015/16 to 6.7 percentage points in 2020/21). The gap in pupils achieving A* to C grades has also widened (from 0.9 in 2015/16 percentage points to 3.3 percentage points in 2020/21).
At A level, the grade distribution shifted upwards again in 2020/21, but this was not the case for all broad ethnic groups. The proportion of A2 (second year of A level) learners with Black, African, Caribbean, Black British backgrounds who got at least 3 Cs fell steeply, undoing much of the rise in grades in 2019/20. In 2020/21, only 54% of learners with these backgrounds achieved at least three Cs compared to 72% in 2019/20. This was the group with the lowest percentage of A* to Cs at A2 in 2020/21, while the highest percentage of A* to Cs was seen amongst the Asian or Asian British (74%) and White (73%) groups.
The School Workforce Census reported that the proportion of school teachers who were from a Black, Asian or Minority Ethnic (excluding White ethnic minorities) group was 1.1% in November 2021, significantly lower than the 9.1% of pupils aged 5 or over in Wales who are from a Black, Asian and Minority Ethnic (excluding White ethnic minorities) group in the February 2022 Schools’ Census.
9% of Welsh student enrolments at higher education institutions in Wales in 2020/21 were stated to be from an ethnic minority group.
Between August 2017 and July 2021, year 11 students with Gypsy, Traveller or Irish Traveller backgrounds were less likely to continue onto post-16 learning than other ethnic groups. For most other ethnic minority groups participation in post-16 learning was close to, or above, the Wales average.
Work-based learning is less ethnically diverse than other areas of post-16 learning. Learners with Black, Asian, or other ethnic minority backgrounds were generally less likely to be in sustained employment after leaving post-16 learning.
Employment rates (year ending March 2021) among the Welsh population aged 16 to 64 are highest among individuals from a White ethnic background and for those in the ‘other ethnicity group’ category (both 73%), with employment rates lowest amongst individuals with a Black ethnicity (57%). The equivalent rates among individuals from an Asian background and people with a mixed ethnic background are 65% and 64%, respectively.
Employment rates for ethnic groups differ for males and females, with the biggest gap in employment rates seen in the Asian ethnic group (males 79% compared to females 54%).
The pay gap between White employees and Black, Asian and Minority Ethnic employees in 2019 had narrowed to its smallest level since 2012 in England and Wales. The ethnicity pay gap differs across region and in 2019 was largest in London (23.8%) and smallest in Wales (1.4%), though there is some volatility in the ethnicity pay gap for Wales. Evidence from across England and Wales shows that most of the ethnic minority groups analysed continue to earn less than White British employees but, in 2019, those in the Chinese, White Irish, White and Asian, and Indian ethnic groups all earned higher hourly pay on average than White British employees.
Being part of an ethnic minority group is linked with a greater likelihood of relative income poverty. For the period 2015-16 to 2019-20 there was a 29% likelihood of people whose head of household comes from an ethnic minority group to be living in relative income poverty. This compares to a 24% likelihood for those whose head of household comes from a White ethnic group.
In 2020-21, less than 5% of public appointments and re-appointments made by the Welsh Government were to individuals from a Black, Asian or Minority Ethnic background (where the ethnicity of the appointee is known), compared to 9% in 2019-20. However, due to pandemic disruption, many competitions were suspended and as such any conclusions drawn from this year’s data need to be tentative and viewed with caution.
There is little reported significant difference in the way different ethnic minorities feel about their local area, sense of community, and likelihood of saying that people in the area treat each other with respect. However, people who are not White British are more likely to report being lonely (25% compared to 12% of those who are White British in 2021-22)
Research published by the Wales Centre for Public Policy in March 2021 highlights that in Wales, Black, Asian and Minority Ethnic people are over-represented at every stage of the criminal justice system, for instance, as victims of crime, in stop and searches and in the prison population.
Race was judged to be a motivating factor in two-thirds of all hate crimes recorded in Wales in 2020-21, a similar proportion to that in 2019-20. However, numbers of police-recorded race hate crimes increased by 16% in 2020-21 compared with 2019-20.
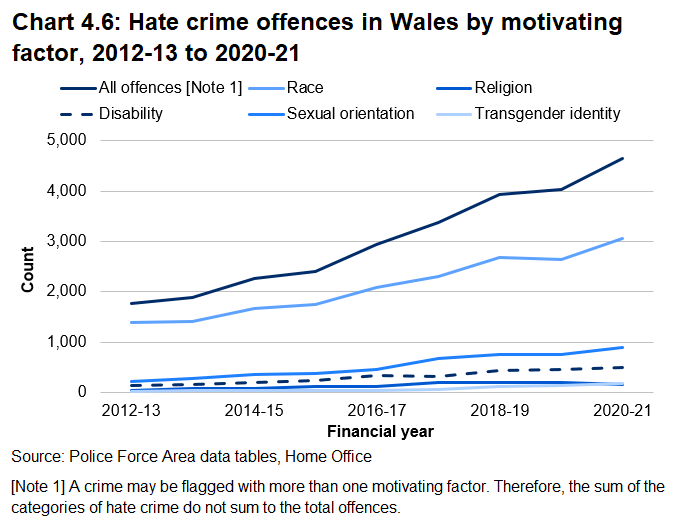
Note that data from the Crime Survey for England and Wales for 2018-2020 suggests that only around half of all hate crime incidents come to the attention of the police in England and Wales.
Religion
For the first time in Wales (2018 to 2020), the proportion of the population stating they had no religion (49.9%) was higher than the proportion identifying as Christian (45.8%), though these figures varied by region with north Wales continuing to have a higher percentage of the population identifying as Christian than those who stated they had no religion.
1.7% of the population identified as Muslim and 2.4% identified with another religion (apart from Christian).
Of the Muslim population in Wales, a large proportion (71.8%) lived in south east Wales.
A higher proportion of women than men identified as having a religion (54.6% compared with 45.5%) and the proportion of people identifying as having a religion generally increased by age group. The Muslim population has a younger age profile than most other religions in Wales.
Those who identify as Christian tend to report a stronger sense of community, particularly in relation to feeling like they belong to an area and feeling that people in the area treat each other with respect. They also are more likely to report that they are satisfied with their local area. These results could be impacted by the age profiles of different groups, with those identifying as Christian tending to have an older age profile.
Religion was judged to be a motivating factor in 3% of hate crimes recorded in Wales in 2020-21, down from 5% in 2019-20. A total of 150 religious based hate crimes were recorded by police in Wales in 2020-21, 49 fewer than in 2019-20.
Employment rates for those who identify as Christian or with no religion were similar in the year ending March 2021. Amongst Muslims the employment rate for females (38%) was around half of that for males (78%).
Sexual orientation
The numbers who identify as lesbian, gay or bisexual, or who chose not to identify as straight (heterosexual) are rising, with same-sex marriages now much more common than same-sex civil partnerships.
In 2020, 94.3% of the population of Wales identified as heterosexual, with 4.2% identifying as gay or lesbian, bisexual or another sexuality. The proportion of people identifying as gay or lesbian, bisexual or another sexuality (other than heterosexual) in Wales has doubled since 2016.
Since 2014, when same-sex marriages became legal, the number of same-sex marriages has increased (to 397 in 2019) whilst the number of same-sex civil partnerships formed has reduced substantially (40 partnerships in 2020). Two thirds of same-sex marriages in 2019 were between female couples. Every year since the introduction of same-sex marriages in 2014, there have been more female than male same-sex marriages.
In 2019-20 a lower proportion of adults who identified as heterosexual were in material deprivation (12%) compared with those who did not identify as heterosexual (22%).
The latest National Survey for Wales results available (2019-20) indicate that people who are lesbian, gay or bisexual are about twice as likely to report feeling lonely (particularly emotional loneliness) than others. They are also more likely to report having experienced discrimination at work.
Sexual orientation was judged to be a motivating factor in 884 hate crimes recorded by police in Wales in 2020-21, up 16% from 763 in 2019-20. This represents 19% of all recorded hate crimes, the same proportion as in the previous year.
Stonewall Cymru research within the LGBT community in 2017 indicates that almost one in four LGBT people (23%) say they have experienced a hate crime or incident due to their sexual orientation and/or gender identity in the last 12 months and that many of them did not report the incident to the police. There is also evidence from the Crime Survey for England and Wales (2017-18 to 2019-20) that only around half of hate crime incidents come to the attention of the police.
Gender reassignment
The first data from the 2021 Census on gender identity will be published later in 2022. As a result, next year’s Wellbeing of Wales report will provide more comprehensive analysis on this topic.
The School Health Research Network’s Student Health and Wellbeing survey collects data on mental wellbeing for 11-16 year olds, as measured by the Short Warwick-Edinburgh Mental Wellbeing Scale. Breakdowns by gender and year group showed those self-identifying as neither a boy nor a girl reported the lowest mental wellbeing, and girls reported lower mental wellbeing than boys.
Transgender identity was judged to be a motivating factor in 173 hate crimes in Wales over this period, equivalent to 4% of all hate crime recorded in Wales. This is an increase of 31% (41 more recorded crimes) compared with 2019-20.
Disability
Whilst over time employment rates for disabled people have been rising a disability pay gap remains and households including someone who is disabled are still more likely to struggle financially.
In 2018 to 2020 just over a fifth of the working-age population (aged 16 to 64, 22.1%) identified as disabled. This proportion has been gradually increasing since 2013 to 2015 (14.0%) and varies by age (from 15.4% in the 16 to 24 age group to 28.3% in the 45 to 64 age group). A higher proportion of women than men of this age group identified as disabled (24.6% compared with 19.6%).
North Wales had the lowest proportion of people identifying as disabled (20.1%) in these age groups, while south east Wales, and mid and south west Wales had similar proportions (22.6% and 23.0% respectively).
National Survey for Wales data (2021-22) shows that life satisfaction was generally lower for people aged 16+ with a limiting long-standing illness or disability (their mean score was 7.0) than for those without (8.0).
National Survey for Wales data (2021-22) also indicates that disabled adults or those with a limiting long-standing illness are much more likely to say they feel lonely most or all of the time (22%) compared with those without such illnesses or disabilities (8%). They also are more likely to report not feeling safe in the local area after dark and less likely to feel a strong sense of community.
The educational outcomes of pupils with special educational needs or additional learning needs have generally improved in recent years. In 2020/21, 96% of GCSE entries by pupils in year 11 with a special educational need were awarded a grade at A* to G, down from 98% in 2019/20.

Of the working-age population, disabled people (15%) are more likely to have no qualifications than non-disabled people (6%) and are less likely to hold qualifications above level 2.
In the latest period (2017-18 to 2019-20), 38% of children who lived in a household where there was someone who was disabled were in relative income poverty compared with 26% in households where no-one was disabled. Similarly, 31% of working-age adults who lived in a household where there was someone who was disabled were in relative income poverty compared with 18% of those who lived in a household where no-one was disabled.
In 2021-22, disabled people or people with a limiting long-standing illness were almost three times as likely to live in a household in material deprivation than those who are not disabled. Around one in five disabled people (19%) or people with a limiting long-standing illness lived in a household in material deprivation compared with 7% of people who were not disabled.
For the year ending 31 March 2021 the employment rate among disabled people aged 16-64 in Wales was 46.7% whilst the rate for people who are not disabled was 79.6%. The disability employment gap for 2021, of 32.9 percentage points, is reduced compared to 5 years ago when it was 35.5 percentage points.
The disability pay gap in Wales was 11.6% in 2021. This means that disabled people in Wales earned, on average, 11.6% less per hour than non-disabled people. While this is down from the peak of 15.1% in 2019, it is still higher than between 2016 and 2018. The pay gap in Wales was the smallest of the four UK nations. The pay gap for the UK as a whole was 13.8%.
In 2020-21, less than 5% of public appointments and re-appointments made by the Welsh Government were to individuals who declared a disability. Due to pandemic disruption, many competitions were suspended and as such any conclusions drawn from this year’s data need to be tentative and viewed with caution.
Disability was judged to be a motivating factor in 11% of hate crimes recorded in Wales in 2020-21, the same proportion as in 2019-20. The Crime Survey for England and Wales found that in the year ending March 2020, 17.5% of disabled people aged 16 to 59 in Wales experienced domestic abuse, compared to 6% of non-disabled people.
Marital status
Being married is associated with higher satisfaction with life and a lower likelihood of being materially deprived. Single parent households continue to face challenges, being more likely to be materially deprived than other types of households.
There were 11,699 marriages formed in Wales in 2019, down from 2018 (12,840), with the majority of marriages involving opposite sex couples (96.6%). In 2019, there were 397 marriages between same-sex couples in Wales, with 67% (265) of these between female couples. No figures are yet available to reflect the impact of the COVID-19 pandemic on the number of marriages taking place in 2020 and 2021.
In 2020, there were 358 opposite-sex civil partnerships formed in Wales. This is the first year for which civil partnerships between opposite-sex couples have been reported following the change in legislation to extend civil partnerships to opposite-sex couples from 31 December 2019.
In 2020, 40 same-sex civil partnerships formed in Wales. This represents a big drop from the 265 same-sex civil partnerships recorded in 2013. This reflects the fact that following the introduction of the Marriage (Same Sex Couples) Act 2013, same-sex marriages became legal from 29 March 2014.
In 2021-22, 18% of divorced adults and 24% of adults who are separated (but still legally married) were in material deprivation compared with 7% of adults who were married and 7% who were widowed. Nearly half (49%) of single parents were materially deprived.
National Survey for Wales results for 2021-22 confirmed that a higher proportion of the married population report a high satisfaction with life, feeling that the things they do in life are worthwhile and high levels of happiness compared to adults that have never married, the separated, divorced, or widowed. In general, reported life satisfaction during the height of the COVID-19 pandemic (in 2020-21) was lower than in 2019-20 but it has returned to the pre-pandemic levels in 2021-22.
In 2021-22, people who were married were least likely to report being lonely (8%), while people who were separated but legally married were the most likely (23%). People who were single (that is, had never been married or registered in a civil partnership), divorced, or widowed were also more likely to report loneliness than people who were married (16%, 19% and 16% respectively). Single parent households and single pensioner households were the households least likely to say they feel safe in their communities after dark in 2021-22.
Relationship breakdown can lead to consequences in relation to housing with data captured prior the pandemic (2018-19) showing that relationship breakdown is one of the key causes cited for households being threatened with homelessness. Of those judged to be homeless and in priority need, just over half are single person households and a third are lone parents with dependent children.
Of those aged between 16 and 64, people who were married or in a civil partnership had the highest employment rates (80%) in 2020-21 compared to people who were separated or divorced (72%), single (65%) or widowed (52%). Employment rates are generally lower for women than for men and this is particularly the case for women who are married or in a civil partnership. The employment rate in 2020-21 for married men is 86% compared to 75% for married women .
Further reading
Is Wales Fairer? (2018) (Equality and Human Rights Commission)
Centre for Equality and Inclusion (Office for National Statistics)
Why free school meal recipients earn less than their peers (Office for National Statistics): analysis for England only
National LGBT Survey 2017 Data viewer (Government Equalities Office): results of a 2017 UK survey but data is available for Wales. Themes include education, healthcare, life in the UK, safety, workplace.
School Report Cymru (2017) (Stonewall Cymru)
LGBT in Wales – Hate Crime and Discrimination (Stonewall Cymru)
LGBT in Wales – Work Report (Stonewall Cymru)
Out on the streets: LGBTQ+ Youth Homelessness in Wales (Llamau)
The employment of disabled people 2021 (Department of Work and Pensions)
Data sources
Equality and diversity statistics (populations)
National Survey for Wales, on life satisfaction, sense of community, feeling of safety, material deprivation
Population and household estimates for Wales (Census 2021)
Health and wellbeing
Screening Division Inequities Report 2020-21 (Public Health Wales)
Poverty
National Survey for Wales (material deprivation) (StatsWales)
Mortality
Health state life expectancies (Office for National Statistics)
Deaths due to COVID-19, registered in England and Wales (Office for National Statistics)
Suicides in England and Wales (Office for National Statistics)
Education
Participation of young people in education and the labour market
Post-16 learning statistics by learners' ethnic group
Outcomes for learners in post-16 education affected by the coronavirus (COVID-19) pandemic
Welsh Government analysis of Higher Education Statistics Agency (HESA) data.
Level of highest qualification held by working age adults
Labour market
Labour market statistics (Annual Population Survey)
Participation in the Labour Market (StatsWales)
Pay gaps
Gender Pay Gap (Annual Survey of Hours and Earnings, StatsWales)
Ethnicity pay gap (Office for National Statistics)
Disability pay gap (Office for National Statistics)
Public appointments
The Commissioner for Public Appointments annual reports
Disability
Outcomes for disabled people in the UK (Office for National Statistics)
Marriages and Civil Partnerships
Marriages in England and Wales (Office for National Statistics)
Crime and justice
Hate Crime, England and Wales (Home Office)
Hate Crime reporting rates (Crime Survey for England and Wales)
Police Recorded Crime Open data tables (Home Office)
Prevalence of Crime (Office for National Statistics)
Improving Race Equality in Crime and Justice Policy (Wales Centre for Public Policy)
2021 Senedd elections
Election 2021: How diverse is the Sixth Senedd (Senedd Research)