Labour market analysis by protected characteristics (Annual Population Survey): April 2004 to March 2021
Labour market data for protected groups in Wales and the UK, April 2004 to March 2021.
In this page
Introduction
The aim of this release is to provide more detailed analysis of key labour market indicators (employment, unemployment, and economic inactivity) for sub-groups of the population (including sex, age, ethnicity, disability, religion and marital status). The analysis considers long-term trends as well as the more recent impacts of the coronavirus (COVID-19) pandemic.
This report is intended to be a first publication on the labour market by protected characteristics and focuses on employment, unemployment and economic inactivity rates by protected characteristics using data from the Annual Population Survey. Subject to user views, we plan to analyse other labour market indicators in future publications, and welcome feedback on which analyses (for example, pay gaps, HMRC PAYE data on employees and analysis on older people in the labour market) we should prioritise. Please use the contact details at the end of this release.
Background
The Annual Population Survey (APS) combines the boosted samples of the Labour Force Survey (LFS). It provides rolling four-quarter labour market data for UK countries and regions and also for local areas. For Wales, the APS consists of a sample of about 18,000 households every year.
The LFS remains the main source for headline labour market indicators at a Wales level. The larger sample of the APS allows for estimates for sub-groups of the population.
This bulletin focusses on data for the April to March periods. The latest data in this bulletin refers to the year ending March 2021 (i.e., period April 2020 to March 2021). Data in this APS series are available from the period April 2004 to March 2005 onwards. Throughout this bulletin when a year is referenced this means the year from April to March unless stated otherwise. For example, 2020-21 refers the year April 2020 to March 2021. Data for the period ending June 2021 has also been published and is available on StatsWales and Nomis.
The 2020-21 data covers a full year of the coronavirus (COVID-19) pandemic, and therefore it should be noted that the annual comparisons will be comparing to 2019-20 which includes the beginning of the pandemic. The data presented in this bulletin is currently available on StatsWales, Nomis and in the accompanying spreadsheets.
We have included a glossary which contains definitions of the labour market indicators used as well as definitions for some protected groups referenced throughout this bulletin.
We welcome feedback on this publication, please contact economic.stats@gov.wales.
Main points
Sex
During the past sixteen years:
- the male employment rate has been higher than the female rate
- the male unemployment rate has generally been higher than the female rate
- the female inactivity rate has been higher than the male rate
But in each case, the gap between males and females has narrowed. For the employment rate, the gap narrowed from 11 to 4 percentage points.
Data from the APS suggests that the COVID-19 pandemic has had a greater impact on males than females. Male employment has decreased, unemployment has increased (though the current rate remains one of the lowest in the series) and economic inactivity has also increased. Female employment and unemployment rates remain broadly unchanged, with the economic inactivity rate decreasing to its lowest rate since the start of the series in 2004-05.
Age
During the past sixteen years, both the 25 to 49 and 50 to 64 age groups have seen a general increase in employment, and a decrease in economic inactivity with more prominent changes for the 50 to 64 age group. Both groups have seen unemployment decrease slightly during the past 8 years. Data for youths aged 16 to 24 are more volatile, with more significant changes around the time of the 2008 recession.
Data from the APS suggests that the COVID-19 pandemic has impacted 16 to 24 year olds more than other age groups. This group saw the largest decrease in the employment rate (4.3 percentage points compared to less than 1.0 percentage points for the other groups), and the largest increase in the inactivity rate. However, youth unemployment decreased slightly during 2020-21 compared to increases for the other age groups.
Age and sex
During the past sixteen years, the male youth unemployment rate has been higher than the female, and the female youth inactivity rate has been higher than the male. However, in both cases, the gap has narrowed considerably.
Data from the APS suggests that young males were more adversely affected than young females by COVID-19 in terms of headline labour market indicators. Male youth employment decreased by 7.6 percentage points in 2020-21 and was lower than female youth employment for the first time since the series began. Following considerable changes for both sexes, the male youth economic inactivity rate was higher than the female equivalent for the first time since the series began.
Ethnicity
Employment rates were highest among individuals from the White ethnic group and from the ‘other ethnic group’ category. Employment rates were lowest amongst individuals from the Black ethnic group. Employment rates for ethnic groups differed for males and females, with the biggest gap in employment rates seen in the Asian ethnic group (25 percentage points).
The unemployment rate for Black, Asian and minority ethnic groups in Wales has been volatile but consistently higher than the rate for White people over the last 16 years. However, the gap has narrowed considerably.
Disability status
The employment rate gap between disabled and non-disabled people has generally decreased since 2014, though saw a small increase in 2020-21.
The unemployment rate for disabled people in Wales has been consistently higher than the rate for non-disabled people but the rate for disabled people has generally been decreasing.
Religion and sex
The employment rate was considerably higher for those who identified as having no religion and those identifying as Christian, compared to other religions.
There were significant differences by sex. Across all religious status’, the employment rate for females was consistently lower than the rate for all people. The largest difference being for people who identify as Muslim.
Marital status and sex
The employment rate was consistently lower for females than the rate for all people across the five marital statuses except for single, never married, and widowed. The largest difference was for people who are married or in a Civil Partnership.
Sex
During the past sixteen years:
- the male employment rate has been higher than the female rate
- the male unemployment rate has generally been higher than the female rate
- the female inactivity rate has been higher than the male rate
But in each case, the gap between males and females has narrowed. For the employment rate, the gap narrowed from 11 to 4 percentage points.
Data from the APS suggests that the COVID-19 pandemic has had a greater impact on males than females. Male employment has decreased, unemployment has increased (though the current rate remains one of the lowest in the series) and economic inactivity has also increased. Female employment and unemployment rates remain broadly unchanged, with the economic inactivity rate decreasing to its lowest rate since the start of the series in 2004-05.
Employment
The employment rate in Wales fell during the recession for both sexes, though the male employment rate decreased more than the female rate. However, the male rate has remained consistently above the female rate throughout the time series. Following this dip, the employment rate for both males and females steadily increased. The male employment rate reached its highest point (since the series began in 2005) at 77.2% in 2020 just after the start of the coronavirus pandemic, and then decreased. The rate for females peaked at 70.2% in 2021, a year after the beginning of the pandemic. The female employment rate has increased at a quicker pace than the male rate over the course of the series leading to a reduction in the gap between the sexes.
The employment rate in the UK shows a similar trend to that of Wales, albeit less volatile.
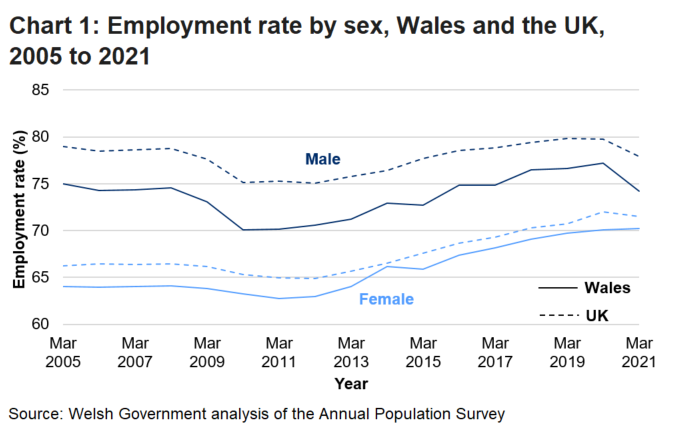
Estimates from the APS for 2020-21 suggest that COVID-19 has had a greater impact on male than female employment. The employment rate for males decreased by 3.0 percentage points over the year to 74.2%. This is one of the largest annual decreases since records began in 2004. On the other hand, the employment rate for females increased 0.2 percentage points over the year to 70.2% (the highest employment rate for females for any April to March period).
In the UK, the employment rate for males and females in 2021 were down 1.9 percentage points and down 0.5 percentage points to 77.9% and 71.5% respectively.
The employment gap between males and females in Wales in 2020-21 was at its smallest since the series began in 2004-05. In 2020-21, the employment rate gap between males and females was 3.9 percentage points compared to 11.0 percentage points in 2004-05.
The employment gap between Wales and the UK is significantly smaller for females than it is for males (1.2 percentage points and 3.7 percentage points respectively). Though, the Wales-UK gap has been generally closing since the recession in 2008.
Unemployment
The male unemployment rate in Wales peaked at 10.1% in 2009-10, following the recession. The Wales rate is also generally higher than the UK rate for men. However, this gap has narrowed over the last 10 years with the Welsh male rate falling below the UK rate for the first time in 2019-20.
The female unemployment rate in Wales peaked in 2013 at 7.4%. The female unemployment rate is generally lower than the male rate for both Wales and the UK. This corresponds with females having a consistently higher economic inactivity rate than males in both Wales and the UK.
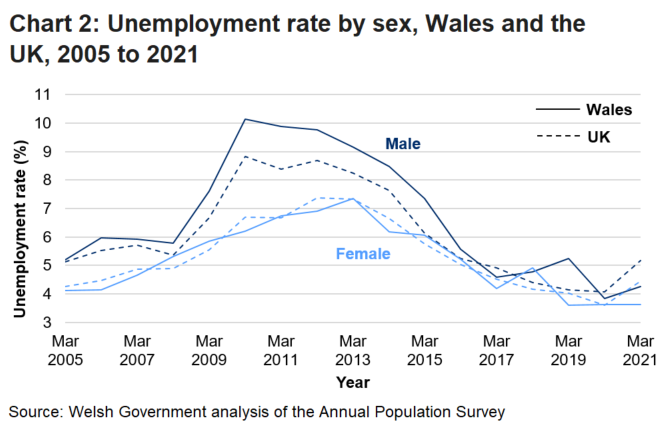
As with the employment rate, the unemployment rate data suggests males in Wales have been more impacted by the pandemic than females. In 2020-21, the male unemployment rate in Wales increased 0.4 percentage points over the year to 4.3%. Though the rate has increased since the start of the pandemic, the current rate remains one of the lowest in the series. The female rate in Wales remained unchanged compared to the previous year at 3.6%.
The male and female unemployment rates in the UK increased 1.1 percentage points and 0.8 percentage points over the year to 5.2% and 4.4% respectively. Similarly to Wales, these rates are relatively low compared to previous years.
Economic inactivity
The male economic inactivity rate in Wales has remained broadly similar since 2004-05, with slight increases in 2009-10 and 2014-15. The male rate has been increasing since 2019, showing a more rapid increase in the latest year. The increase in the male economic inactivity rate in Wales during 2020-21 (and the increase in the unemployment rate) corresponds with a decrease in the employment rate. This may suggest that males in Wales have been moving from employment to unemployment and economic inactivity.
The UK male economic inactivity rate follows a similar trend to Wales (albeit less volatile) but is considerably lower than the Wales rate. The gap between the two has been similar until, the latest year where it has widened.
Unlike the male rate which has experienced an increase in the past few years, the female economic inactivity rate has been steadily decreasing in both Wales and the UK since 2004-05. Despite decreasing, the female inactivity rate remains consistently higher than the male rate. However, the gap between the two has been closing in recent years. This corresponds with both the female employment and unemployment rates generally being lower than the male rates.
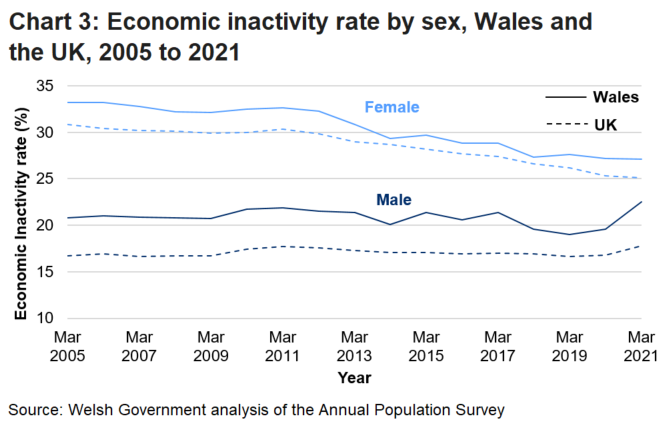
In 2020-21, the male economic inactivity rate in Wales increased by 2.9 percentage points to 22.5%. This is by far the largest annual increase for all April to March periods. Whereas the female rate in Wales decreased by 0.1 percentage points to 27.1%. This is the lowest annual rate since 2004-05.
The equivalent rates for males and females in the UK were 17.8% (up 1.0 percentage points) and 25.1% respectively (down 0.2 percentage points).
Reasons for economic inactivity
The economic inactivity rate for males in Wales has increased over the last year whereas, the rate for women has decreased. Initial analysis of the APS has been carried out to find out the reasons for economic inactivity in Wales.
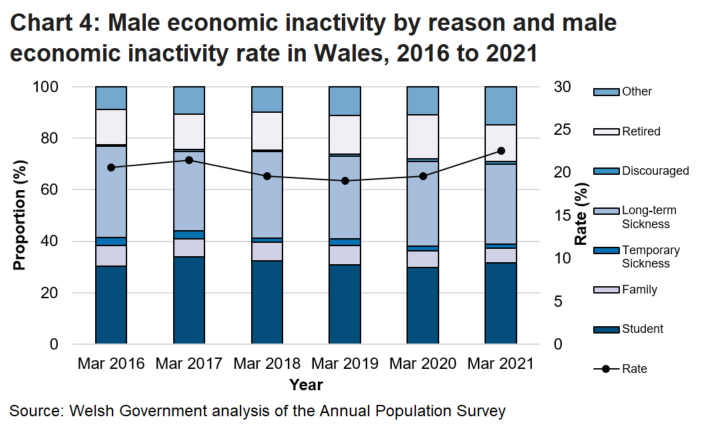
The most common reason for economic inactivity for males in Wales was being a student, which increased by 1.9 percentage points to 31.5% of all economically inactive males in 2020-21 (the UK saw a decrease). This was closely followed by long-term sickness accounting for 31.2% of all economically inactive male, down by 1.7 percentage points from a year earlier but well above the UK proportion (28.0%).
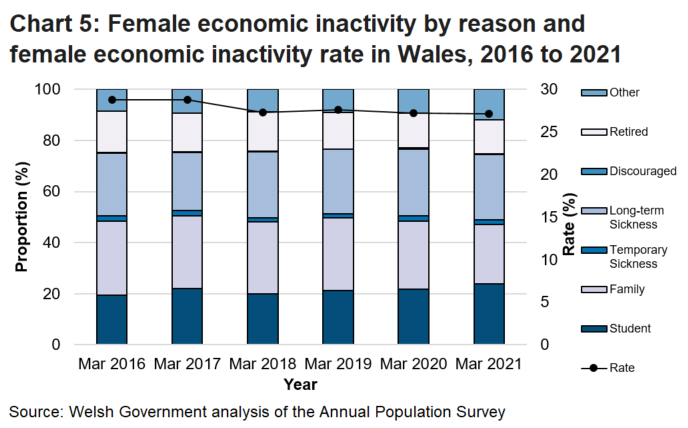
Whilst the economic inactivity rate for male appears to have increased as a result of the coronavirus pandemic in both Wales and the UK, economic inactivity rates for women have remained relatively stable.
The most common reason for economic inactivity for women in Wales in 2020-21 was long-term sickness, accounting for 25.7% of all economically inactive women in Wales and down 0.6 percentage points on the year. Over the same period, a rise in the proportion of students and a fall in those looking after family, accounted for 23.9% and 23.3% all economically inactive women, respectively.
Age
During the past sixteen years, both the 25 to 49 and 50 to 64 age groups have seen a general increase in employment, and a decrease in economic inactivity with more prominent changes for the 50 to 64 age group. Both groups have seen unemployment decrease slightly during the past 8 years. Data for youths aged 16 to 24 are more volatile, with more significant changes around the time of the 2008 recession.
Data from the APS suggests that the COVID-19 pandemic has impacted 16 to 24 year olds more than other age groups. This group saw the largest decrease in the employment rate (4.3 percentage points compared to less than 1.0 percentage points for the other groups), and the largest increase in the inactivity rate. However, youth unemployment decreased slightly compared to increases for the other age groups.
Data on those aged 65 and over is available on StatsWales. If you’d like us to prioritise analysis on older workers, please let us know.
Employment
The employment rates for those aged 25 to 49 and 50 to 64 in Wales have steadily increased since 2004-05, with both reaching peaks in 2019-20 prior to the start of the coronavirus pandemic.
The employment rate for those aged 16 to 24 in Wales was at its highest rate at the start of the time series and decreased to its lowest point in 2011-12. This likely reflects the 2008 recession meaning young people may be entering the labour market later as seen in the unemployment and economic inactivity rates analysis by age later in this section. Since 2011-12 the employment rate for 16 to 24 year olds has increased, but is more volatile than the other two age groups in both Wales and the UK. It has also remained below its peak at the start of the time series.
The employment rate for Wales has been consistently lower than the UK across all three age groups.
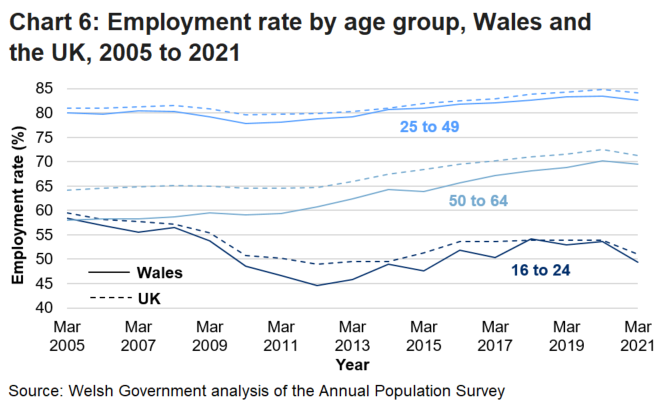
The employment rate decreased for all three age groups in Wales in 2020-21. However, young people aged 16 to 24 were the age group most affected by the pandemic in both Wales and the UK. The youth (aged 16 to 24) employment rate in Wales was 49.4%, down 4.3 percentage points compared to the previous year. The UK rate was 51.1%, down 2.9 percentage points compared to the previous year.
The employment rates for those aged 25 to 49 and 50 to 64 in Wales decreased by 0.8 and 0.7 percentage points respectively. Whereas, the employment rates in the UK for those aged 25 to 49 and 50 to 64 decreased by 0.6 and 1.3 percentage points respectively.
Unemployment
After a period of increase following the 2008 recession, the unemployment rates for those aged 25 to 49 and 50 to 64 in Wales subsequently steadily decreased. Current rates for these age groups are broadly similar to the beginning of the series. The unemployment rate for those aged 16 to 24 in Wales generally increased from the start of the time series to its highest point in 2011-12. Since then, the unemployment rate for this group has generally decreased and is now lower than it was at the start of the time series. The youth (16 to 24) unemployment rate is considerably higher and more volatile than older age groups.
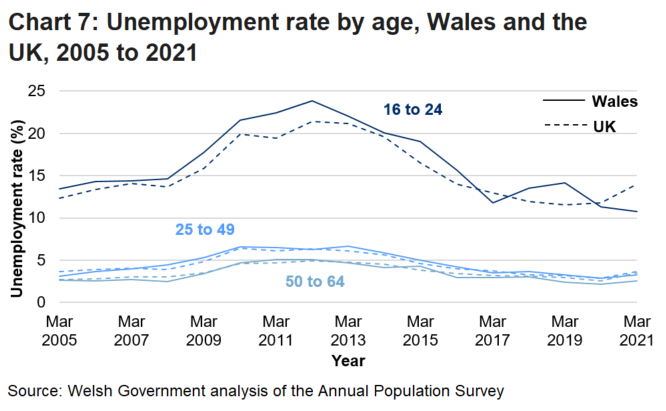
In 2020-21, the unemployment rates for those aged 25 to 49 and 50 to 64 in Wales both increased by 0.4 percentage points to 3.3% and 2.6% respectively. Whereas, the rate for youth unemployment (people aged 16 to 24) decreased 0.5 percentage points over the year to 10.8%.
The youth unemployment rate in Wales was generally higher in Wales than the UK from 2004-05 until 2019-20 when it has dropped below the UK rate. In 2020-21 the UK rate was 14.0%, up 2.2 percentage points over the year.
In the UK, the unemployment rates for those aged 25 to 49 and 50 to 64 increased by 0.8 and 1.0 percentage points over the year respectively.
Economic inactivity
The economic inactivity rate in Wales has decreased throughout the series for people aged 50 to 64 and 25 to 49, though more significantly for the former with both reaching their lowest points prior to the COVID-19 pandemic. The economic inactivity rate for people aged 16 to 24 has increased since 2004-05. The three age groups in Wales generally follow the UK series’ but remain slightly higher for each age group.
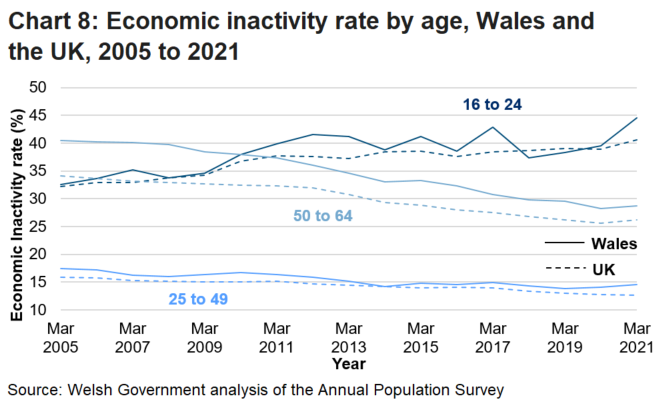
APS data for 2020-21 suggests people aged 16 to 24 in Wales were the most negatively affected by the pandemic out of the three age groups. The economic inactivity rate stood at 44.6%, up 5.1 percentage points over the year, the highest rate since the series began. This compares to 14.6% for people aged 25 to 49 (up 0.5 percentage points) and 28.7% for people aged 50 to 64 (up 0.5 percentage points).
The equivalent changes over the year in the UK were up 1.7 percentage points for people aged 16 to 24 and up 0.6 percentage points for those aged 50 to 64, and down 0.1 percentage points for people aged 24 to 49.
For those aged 16 to 24 in Wales, the economic inactivity rate generally increased which is opposite to the employment and unemployment rates where there was generally an overall decrease. This might suggest people in this age group may have moved from both employment and unemployment to economic inactivity in 2020-21.
Reasons for economic inactivity
The data used throughout this section are published by the Office for National Statistics on Nomis. Changes are calculated using rounded figures.
Age 16 to 24
In 2020-21, being a student was the most common reason for economic inactivity for those aged 16 to 24 in Wales at 77.8%, up 3.5 percentage points over the year. This is considerably higher than the proportion in 2004-05 (66.5%).
The second most common reason in Wales behind ‘other’ is long-term sickness. This reason has increased since 2004-05 to 8.3% in 2021 for Wales. The proportion for this reason decreased 1.2 percentage points in Wales over the year to 2021.
Looking after home/family has seen the largest decrease of any reason over the time-series, falling 13.9 percentage points between 2004-05 and 2020-21 in Wales. Over the year to 2021, the proportion for this reason fell 4.7 percentage points in Wales to 2.5%.
Age 25 to 49
Long-term sickness was the most common reason for economic inactivity for those aged 25 to 49 in Wales in 2021 at 38.2%, the second highest proportion since records began in the year ending December 2004.
Similarly to those aged 16 to 24, the proportion of those looking after home/family has decreased over the series in both Wales. In 2021 the proportion fell 11.6 percentage points in Wales, compared to 2004-05. This proportion fell 4.4 percentage points in Wales.
Age 50 to 64
As for those aged 25 to 49, long-term sickness was the most common reason for economic inactivity in 2021 for those aged 50 to 64 in Wales at 36.9%. This proportion decreased 8.5 percentage points between 2004-05 and 2020-21.
The proportion of those aged 50 to 64 that are retired in Wales decreased 2.4 percentage points over the year to 34.4% in 2020-21. This is the second lowest proportion for this reason since records began in the year ending December 2004.
Age and sex
During the past sixteen years, the male youth unemployment rate has been higher than the female, and the female youth inactivity rate has been higher than the male. However, in both cases, the gap has narrowed considerably.
Data from the APS suggests that young males were more adversely affected than young females by COVID-19 in terms of headline labour market indicators. Male youth employment decreased by 7.6 percentage points in 2020-21. Following considerable changes for both sexes, the male youth economic inactivity rate was higher than the female equivalent for the first time since the series began.
Employment
The youth employment rates for males and females have been broadly similar since the series began, though with both series showing volatility. The employment rate for both sexes decreased between 2004-05 and 2011-12 before generally increasing. The current employment rates are still well below the rates at the beginning of the series.
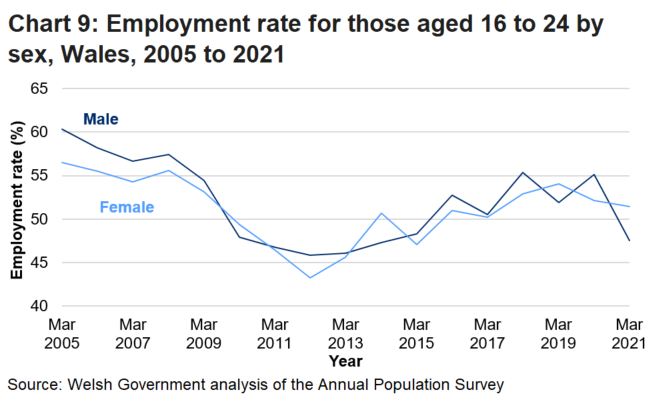
The youth employment rate for males suggest they were significantly impacted by the coronavirus pandemic, with the rate decreasing in Wales by 7.6 percentage points compared to the previous year, to 47.5%. Young females were less impacted, with the employment rate decreasing 0.7 percentage points compared to the previous year, to 51.5%.
The youth employment gap between males and females is currently 3.9 percentage points. This is the smallest gap for every April to March period since 2004-05.
Unemployment
The youth unemployment rate has been volatile for both sexes since the series began, but the rate has been consistently higher for males than females. However, this gap has generally closed over the last 10 years. At the start of the pandemic (2019-20), the unemployment rate gap between the sexes had largely closed and the rate has decreased at a similar pace in the year since.
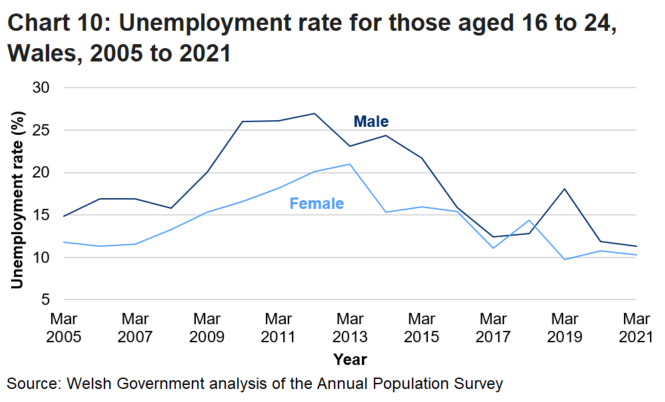
In 2020-21, the male youth unemployment rate was higher than females at 11.3% and 10.3% respectively. Additionally, the youth unemployment gender gap in Wales has significantly closed in the past 10 years (1.0 percentage points in 2020-21 and 7.9 percentage points in 2010-11).
The UK gap has also closed, but not as significantly as Wales, with 3.1 percentage points in 2020-21, down from 4.7 percentage points a decade ago. This also means that the gap is now smaller in Wales than in the UK in 2020-21.
Economic inactivity
Similarly to the employment and unemployment rates, the economic inactivity rate is volatile for both genders throughout the series. However, the rate for males has been consistently below females until 2020-21, where the male rate exceeded the female rate for the first time.
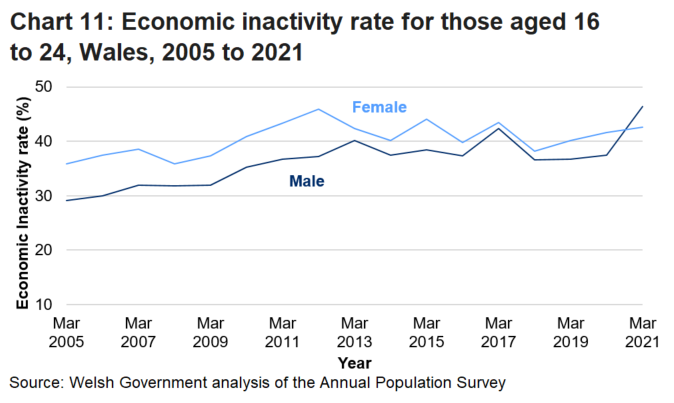
The economic inactivity rate suggests young males were significantly impacted by the pandemic. The youth economic inactivity rate for males increased by 8.9 percentage points compared to the previous year, whilst the female rate increased 1.0 percentage points. The annual increase for males is the largest for any April to March period.
Ethnicity
The definitions for the breakdowns of ethnic groups referenced in this section are available in the glossary.
Employment rates were highest among individuals from the White ethnic group and for those from the ‘other ethnic group’ category. Employment rates were lowest amongst individuals from the Black ethnic group. Employment rates for ethnic groups differed for males and females, with the biggest gap in employment rates seen in the Asian ethnic group (25 percentage points).
The unemployment rate for Black, Asian and minority ethnic groups in Wales has been volatile but consistently higher than the rate for White people over the last 16 years. However, the gap has narrowed considerably.
Employment
As sample sizes allow, employment data has been analysed for five different ethnic groups.
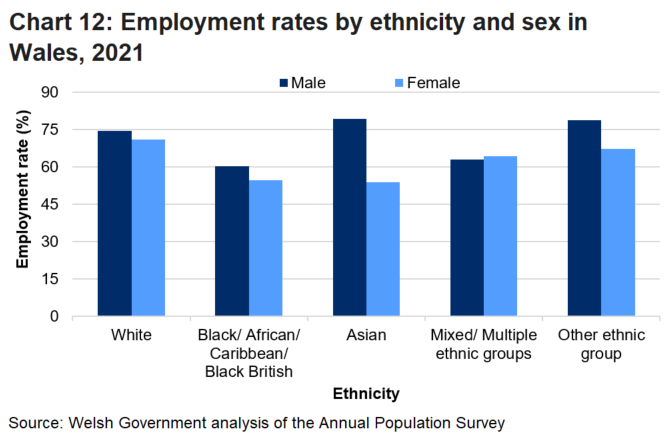
Employment rates (2020-21) were highest among individuals from the White ethnic group and for those from the ‘other ethnic group’ category (both 73%), with employment rates lowest amongst individuals from the Black ethnic group (57%). The equivalent rates among individuals from the Asian ethnic group and people from the mixed ethnic group were, 65% and 64%, respectively.
Employment rates for ethnic groups differed for males and females, with the biggest gap in employment rates seen in the Asian ethnic group (males 79% compared to females 54%).
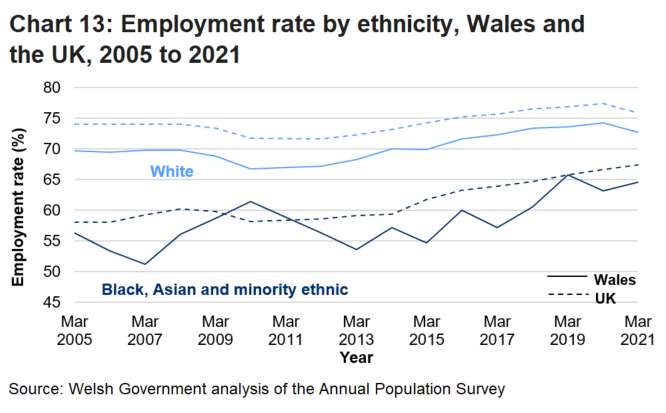
Note: Data for 2010-11 for the Black, Asian and minority ethnic group has been suppressed due to small sample sizes. The graph connects 2009-10 and 2011-12, with no data for 2010-11.
The employment rates for Black, Asian and minority ethnic groups have increased in both Wales and the UK compared to 2004-05. However, the employment rate for Black, Asian and minority ethnic groups remains lower than the rate for White people. The series for Black, Asian and minority ethnic groups in Wales is more volatile than that of White people due to a smaller sample size.
The employment rate for the Black, Asian and minority ethnic group in Wales increased 1.4 percentage points over the year to 64.6%. This compared to 72.7% for White people, down 1.5 percentage points over the year.
In the UK, the employment rate for individuals from a Black, Asian and minority ethnic backgrounds was 67.4% in 2020-21, up 0.8 percentage points compared to 2019-20. The rate for White people was 75.9%, down 1.5 percentage points over the year.
Unemployment
Due to limitations in the sample size, unemployment rates for the five ethnic groups aren't robust enough to publish, therefore unemployment rates for the White ethnic group and for the Black, Asian and minority ethnic group have been analysed in this section.
The unemployment rate for Black, Asian and minority ethnic groups in Wales has been volatile but consistently higher than the rate for the White ethnic group over the last 16 years. But the rate has generally been decreasing and the gap narrowing. The unemployment rate for the Black, Asian and minority ethnic group has been consistently lower than the UK series since 2014-15 and fell below the rate for White people in Wales in 2016-17.
In 2019-20, at the start of the pandemic, the unemployment rate for the Black, Asian and minority ethnic group in Wales was 4.7%, down 1.8 percentage points compared to a year earlier. However, since the data for 2020-21 is suppressed due to small sample size, we cannot determine the impact of the pandemic on unemployment for this group.
The unemployment rate for the White ethnic group in Wales increased between 2008 and 2010 before decreasing to a series low in 2019-20, before the impact of the coronavirus pandemic. The Welsh series also follows the UK series closely.
In 2020-21, the unemployment rate for the White ethnic group in Wales was 4.0%, up from 3.7% a year earlier. This falls slightly below the UK rate which increased 0.8 percentage points over the year to 4.2%.
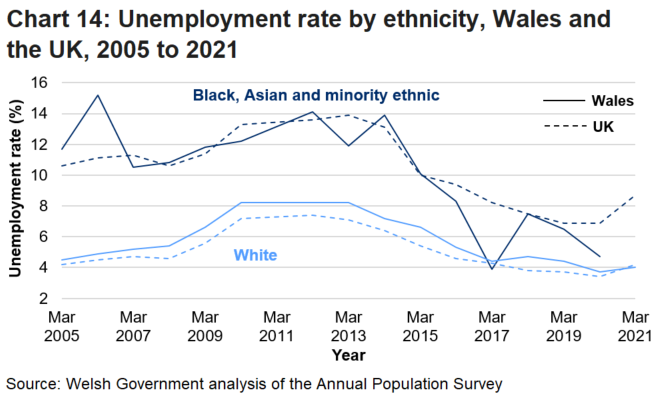
Note: Data for 2010-11 and 2020-21 for the Black, Asian and minority ethnic group has been suppressed due to small sample sizes. The graph connects 2009-10 and 2011-12, with no data for 2010-11.
Economic inactivity
The economic inactivity rate for the Black, Asian and minority ethnic group in Wales has been volatile since the series began in 2004-05 but has been consistently higher than the rate for the White ethnic group.
In the UK, the economic inactivity rate for the Black, Asian and minority ethnic group has been decreasing since the series began in 2004-05. While the rate for the White group has decreased slightly over the same period.
Note: Data for male individuals from mixed or multiple ethnic groups has been suppressed due to an insufficient sample size.
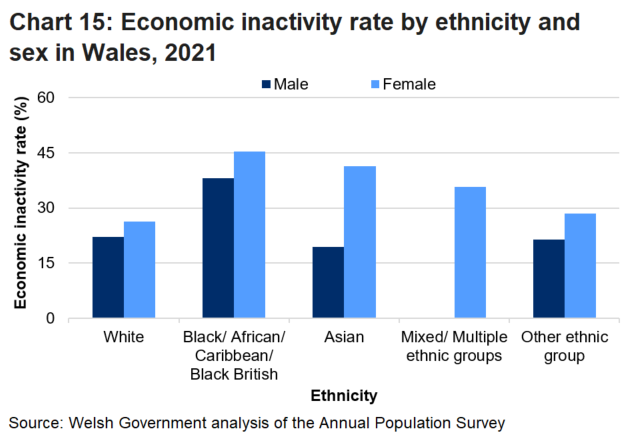
In 2020-21, economic inactivity rates in Wales were lowest among those from the White ethnic group (24.2%), with the highest rates amongst individuals from the Black ethnic group (42.4%). The equivalent rates for individuals from the Asian ethnic group, mixed ethnic group and the ‘other ethnic group’ were 31.6%, 36.4% and 24.5%, respectively.
Economic inactivity rates for all ethnic groups varied for males and females, with the largest gap seen in the Asian ethnic group (males 19.4% compared to females 41.4%). Males had lower rates of economic inactivity than females across all five ethnic groups.
To note, the male economic inactivity rate for mixed/multiple ethnic groups has been suppressed due to small sample size.
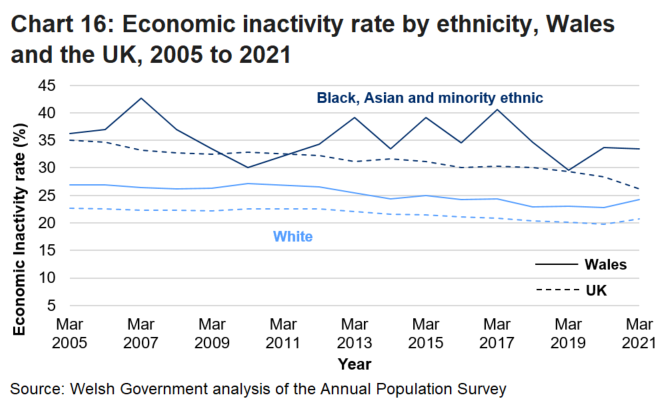
Note: Data for 2010-11 for the Black, Asian and minority ethnic group has been suppressed due to small sample sizes. The graph connects 2009-10 and 2011-12, with no data for 2010-11.
In 2020-21, the economic inactivity rate for people from the Black, Asian and minority ethnic group in Wales decreased 0.2 percentage points to 33.5%. This compared to a rate of 24.2% for the White ethnic group, which increased 1.4 percentage points over the year.
In the UK, the economic inactivity rate for people in the Black, Asian and minority ethnic group decreased 2.2 percentage points compared to a 0.9 percentage point increase for the White ethnic group.
Disability status
The Welsh Government accepts the social definition of disability, in which it is recognised that barriers in society act to disable people who have impairments or health conditions or who use British Sign Language.
The Annual Population Survey, which is the source of data for this release, captures data using the medical definition of disability used in the Equality Act 2010 (UK legislation) (“a physical or mental impairment which has a substantial and long-term impact on a person’s ability to carry out normal day to day activities”).
In April 2013 the Office for National Statistics (ONS)’s Annual Population Survey adopted a new standardised question on individuals with health problems. As a result, this series contains data from 2013-14 onwards.
The employment rate gap between disabled and non-disabled people has generally decreased since 2014, though saw a small increase in 2020-21.
The unemployment rate for disabled people in Wales has been consistently higher than the rate for non-disabled people but the rate for disabled people has generally been decreasing.
Employment
The employment rate gap between disabled and non-disabled people has generally decreased in both Wales and the UK since 2013-14, though decreasing at a faster rate in the UK. Before the impact of the pandemic in 2019-20, the employment gap in Wales was at its lowest point since 2013-14.
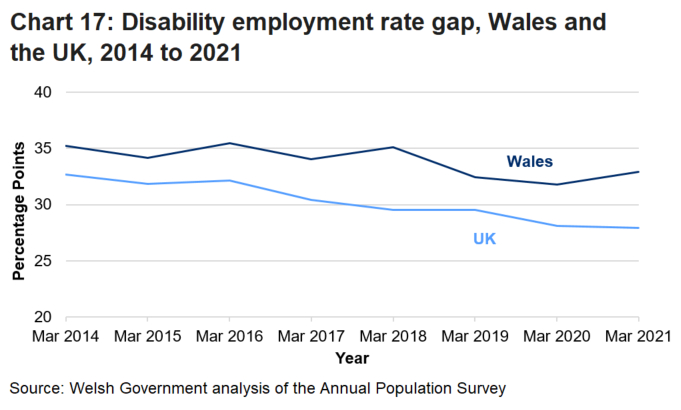
Labour market indicators suggest that disabled people in Wales were more impacted by the pandemic than non-disabled people. The employment rate for disabled people fell by 2.7 percentage points on the previous year, compared to a fall of 1.6 percentage points for non-disabled people.
In 2020-21 the employment rate among disabled people in Wales was 46.7% whilst the rate for people who are not disabled was 79.6%. The disability employment gap for 2020-21, of 32.9 percentage points, is reduced compared to 5 years ago when it was 35.5 percentage points. However, this gap increased 1.1 percentage points compared with 2019-20.
The disability employment gap in the UK was much narrower than Wales in 2020-21 at 27.9 percentage points. This was down 0.2 percentage points over the year and down 4.2 percentage points compared to 5 years ago.
Unemployment
The unemployment rate for disabled people in Wales has been consistently higher than the rate for non-disabled people since 2013-14 but the rate has generally been decreasing. The unemployment rate for disabled people in Wales has been consistently higher than the UK series since 2014-15. In 2019-20, which includes the first few weeks of the pandemic, the unemployment rate for disabled people in Wales reached a series low at 7.5% for all April to March periods.
The unemployment rate for non-disabled people in Wales has steadily decreased since 2013-14 before decreasing to a series low in 2019-20, before the impact of the coronavirus pandemic. The Welsh series also follows the UK series closely.
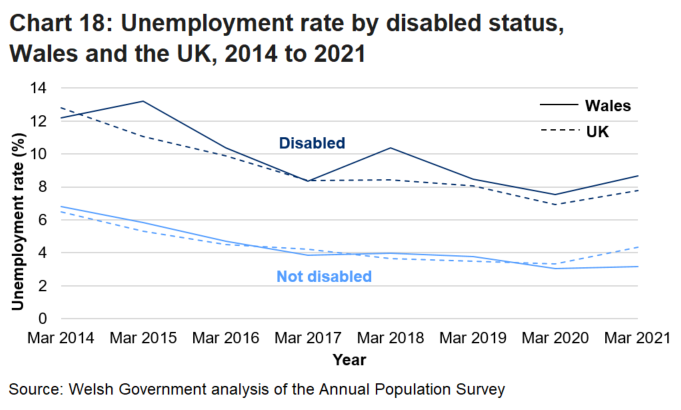
The data for 2020-21 suggests disabled people were more negatively affected by the pandemic than non-disabled people. The unemployment rate for disabled people was 8.7%, up 1.2 percentage points over the year. Whereas the rate for non-disabled people was up slightly over the year to 3.2%.
Economic inactivity
The economic inactivity rate for disabled people in Wales has slightly decreased since the series began in 2013-14 reaching a series low in 2019-20 prior to the coronavirus pandemic. However, the Wales rate remains consistently above the UK rate throughout the series.
In comparison, the rate for non-disabled people in both Wales and the UK have remained relatively stable since the series began in 2013-14.
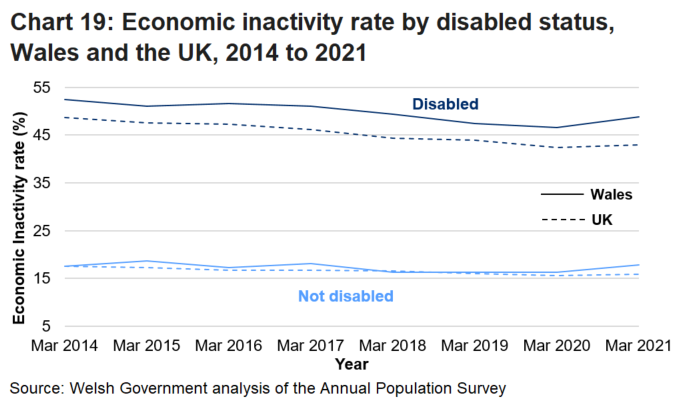
In 2020-21, the economic inactivity rate for disabled people in Wales increased 2.2 percentage points over the year to 48.8%. This was still below the rate at the start of the time series. This compares to an increase of 1.5 percentage points over the year to 2020-21 to 17.8% for non-disabled people.
Religion and sex
Ad-hoc analysis of the employment rate by marital status and sex was included within the Wellbeing of Wales, 2021. This was published by the Welsh Government on 21 September 2021. We are working on developing our labour market data sets on StatsWales to include breakdowns by religion. This will include unemployment and economic inactivity where possible.
To note throughout this section, “Any other religion” includes people who identified as Buddhist, Hindu, Jewish, Sikh and Any other Religion.
In 2020-21, the employment rate was highest in Wales amongst those who identified as having no religion at 72.8%. This was followed by people who identified as Christian (all denominations) in Wales at 72.6%. The employment rate was lowest amongst those who identified as any other religion (this includes people who identify as Buddhist, Hindu, Jewish, Sikh and Any other Religion) at 59.3%.
Looking specifically at females in 2020-21, the employment rate showed a similar pattern to that of all people with no religion the highest at 71.2% followed by people who identified as Christian at 71.0%. The lowest rate for females was people who identified as any other religion at 56.7%. Across all religious status’, the employment rate for females was consistently lower than the rate for all people. The largest difference being for people who identify as Muslim where across all people the employment rate was 61.3%, but it was 37.9% for females.
However, males show a different story with the highest employment rate being for people who identified as Muslim at 78.4% (17.1 percentage points higher than the rate for all people). This was followed by people who identified as Christian at 74.7% and no religion at 74.2%. The lowest employment rate, similar to females and all people, was people who identified as any other religion at 62.4%. In contrast to females, the employment rate was higher for males across all religious groups than the whole population.
Marital status and sex
Ad-hoc analysis of the employment rate by marital status and sex was included within the Wellbeing of Wales, 2021. This was published by the Welsh Government on 21 September 2021. We are working on developing our labour market data sets on StatsWales to include breakdowns by marital status. This will include unemployment and economic inactivity where possible.
For the whole population in 2020-21, the employment rate was highest in Wales amongst those who are married or in a Civil Partnership at 80.3%. This was followed by people who are divorced, separated or Civil Partnership dissolved at 72.0%. The employment rate was lowest amongst those who are widowed at 51.8%.
Looking specifically at females, the employment rate showed a similar pattern to that of all people with married or in a Civil Partnership the highest at 75.0%. This was followed by people who are divorced, separated or Civil Partnership dissolved at 71.8%. The lowest rate for females was people who identified as widowed at 49.1%.
Across all marital statuses except for single, never married, and widowed, the employment rate was consistently lower for females than the rate for all people. The largest difference being for people who are married or in a Civil Partnership where females are 5.3 percentage points lower than the whole population compared to males who are 5.4 percentage points higher. For single, never married, the employment rate was slightly higher for females than the whole population (65.8% for females compared with 65.2% for all people). For females who are widowed, the employment rate was lower than the whole population (49.1% for females compared to 51.8% for the whole population).
Males also shows a similar story with the highest employment rate being people who are married or in a Civil Partnership at 85.7%. This was followed by people who are divorced, separated or in a Civil Partnership at 72.3%. The lowest employment rate was people who identified as widowed at 57.1%. However, this was 5.3 percentage points higher than the whole population and 8.0 percentage points higher than females. The employment rate was higher for males across all marital status’ when compared to the whole population, apart from males who identified as single, never married where it was slightly lower (0.5 percentage points).
Other protected characteristics
The Equality Act 2010 (UK legislation) covers more protected groups than those detailed in this bulletin. We are working with data providers to try to include analysis on more protected characteristics (for example, sexual identity) in future publications.
Glossary
Labour market definitions
Employment
People aged 16 to 64 who did at least one hour of paid work in the reference week (whether as an employee or self-employed); those who had a paid job that they were temporarily away from; those on government-supported training and employee programmes and those doing unpaid family work.
The employment rate is the proportion of people aged between 16 and 64 years who are in employment.
Note: Figures for employment include employees that have been furloughed.
Unemployment
Unemployed people are without a job, have actively sought work in the last four weeks and are available to start work in the next two weeks; or are out of work, have found a job and are waiting to start it in the next two weeks. This is the internationally agreed definition recommended by the International Labour Organisation (ILO), an agency of the United Nations.
The headline unemployment rate is calculated by dividing the unemployment level for those aged 16 and over by the total number of economically active people aged 16 and over.
Economic inactivity
Economically inactive people are those without a job who have not actively sought work in the last four weeks, and/or are not available to start work in the next two weeks.
The headline inactivity rate is calculated by dividing the inactivity level for those aged from 16 to 64 divided by the population for that age group.
Reasons for economic inactivity
The categories for this measure are Student, Looking after family, Long-term sickness, Temporary sickness, Discouraged, Retired, and Other. These are given as a proportion of economically inactive people.
Protected group definitions
White ethnic group
The White ethnic group includes respondents in England, Wales and Scotland identifying themselves as 'White -Gypsy or Irish Traveller' and respondents in Scotland identifying themselves as 'White -Polish'.
Black, Asian and Minority Ethnic
Black, Asian and minority ethnic aggregated group includes people who are Mixed/Multiple ethnic groups, Indian, Pakistani, Bangladeshi, Chinese, Any other Asian background, Black, African, Caribbean, Black British, and Other ethnic group. The Other ethnic group includes respondents in Northern Ireland identifying themselves as 'Irish Traveller' and respondents in all UK countries identifying themselves as 'Arab'.
Black, African, Caribbean and Black British
This is a subgroup of Black, Asian and Minority Ethnic and includes respondents identifying as Black, African, Caribbean, and Black British.
Asian
This is a subgroup of Black, Asian and Minority Ethnic and includes respondents identifying as Indian, Pakistani, Bangladeshi, Chinese and Any other Asian background.
Mixed or multiple ethnic groups
This is a subgroup of Black, Asian and Minority Ethnic and includes respondents identifying as mixed or multiple ethnic groups.
Other ethnic group
This is a subgroup of Black, Asian and Minority Ethnic and includes respondents includes respondents in Northern Ireland identifying themselves as 'Irish Traveller' and respondents in all UK countries identifying themselves as 'Arab'.
Disabled
The Welsh Government accepts the social definition of disability, in which it is recognised that barriers in society act to disable people who have impairments or health conditions or who use British Sign Language.
The Annual Population Survey, which is the source of data for this release, captures data using the medical definition of disability used in the Equality Act 2010 (“a physical or mental impairment which has a substantial and long-term impact on a person’s ability to carry out normal day to day activities”).
Not disabled
This refers to respondents who have not reported having a medical definition of disability used in the Equality Act 2010 (“a physical or mental impairment which has a substantial and long-term impact on a person’s ability to carry out normal day to day activities”).
Religion
The analysis on religion presented in this release refers to Christian (all denominations), Muslim, Any other religion, No religion, and the respondents were also given the option to not answer the question.
“Any other religion” includes people who identified as Buddhist, Hindu, Jewish, Sikh and Any other Religion.
Marital status
The analysis on marital status presented in this release refers to Single, never married; Married or in a Civil Partnership; Divorced, separated or Civil Partnership dissolved; and Widowed.
“Married or in a Civil Partnership” refers to people who are married, living with husband/wife or are a civil partner in a legally-recognised Civil Partnership.
“Divorced, separated or Civil Partnership dissolved” refers to people who are Married, separated from husband/wife; Divorced; In a legally-recognised Civil Partnership and separated from his/her civil partner; and Formerly a civil partner, the Civil Partnership now legally dissolved.
Quality and methodology information
Relevance
The labour market in Wales can be measured by both the Labour Force Survey (LFS) and the Annual Population Survey (APS). The APS combines the boosted samples of the LFS. It provides rolling four-quarter labour market data for UK countries and regions and also for local areas. For Wales, the APS consists of a sample of about 18,000 households every year. The larger sample of the APS allows for estimates at a local authority level and for sub-groups of the population.
This release provides a more detailed commentary on people with protected characteristics within the Welsh labour market. The data presented in this bulletin is available on StatsWales, Nomis and as an ad-hoc publication.
This statistical bulletin is likely to be used by other public sector organisations, businesses, academia and private individuals as a means of identifying the key trends for Wales in the headline labour market statistics by protected characteristics. Our 2012 user consultation provides more information on how our outputs are used.
The LFS remains the main source for headline labour market indicators at a Wales level, and the data are updated monthly. The latest LFS data is published by the Welsh Government each month in the labour market overview release. The APS allows for a more detailed commentary on smaller areas and groups in Wales with the labour market statistics (Annual Population Survey) published quarterly. This release uses data from the APS to provide more detailed information on the labour market in Wales by protected characteristics.
The statistics in this release are used by the Welsh Government to monitor the headline statistics for the Welsh labour market by protected characteristics as well as providing comparisons to the UK labour market. This release is also used to monitor progress against some of the targets in Welsh Government’s Employability Plan. The release complements the Welsh Economy in Numbers dashboard, which provides a broad picture of the Welsh economy and labour market.
Accuracy
The data presented in this release is based on sample surveys, therefore is subject to sampling variability. This means the data is subject to differing degrees of sampling variability, i.e. the true value for any measure lies in a differing range about the estimated value. This range or sampling variability increases as the detail in the data increases, for example data for small groups are subject to higher variability than larger groups.
Estimates of employment, unemployment and economic inactivity are available from both the Labour Force Survey (LFS) and the APS. This release presents estimates from the APS. Estimates from the LFS are based on a rolling quarter and are updated monthly. LFS sample sizes are too low to produce reliable estimates for many groups of protected statuses such as ethnicity and disability status.
Estimates from the APS are based on a rolling twelve months, updated each quarter. The APS uses a bigger sample than the LFS so is used to produce estimates for geographies and sub-groups of the population in Wales. At Wales level, the APS is a slightly more robust measure than the LFS, but it is less timely and slower to adapt to changes in the labour market.
Wider context
The Well-being of Future Generations Act 2015 is about improving the social, economic, environmental and cultural wellbeing of Wales. The Act puts in place seven wellbeing goals for Wales, including a more prosperous Wales. The set of national indicators includes an indicator on:
- (21) percentage of people in employment
We report on all national indicators through the annual Wellbeing of Wales report and the individual national indicator data summaries.
In December 2021, the first set of National Milestones were published. The national milestones are a series of measures against the national indicators that set out Welsh Government expectations of what the indicators should show in the future. The milestones include:
- eradicate the gap between the employment rate in Wales and the UK by 2050, with a focus on fair work and raising labour market participation of under-represented groups
Contact details
Statistician: Vanessa Allis
Telephone: 0300 025 9019
Email: economic.stats@gov.wales
Media: 0300 025 8099
SB 40/2021