Caring (National Survey for Wales): April 2019 to March 2020
The report looks at people who care for or support family, friends or neighbours for free and the time they spend caring for April 2019 to March 2020.
In this page
In 2019-20, the National Survey asked people whether they looked after or gave help or support to family, friends, neighbours or others because of long-term physical or mental ill-health, disability or age-related problems. This report refers to people who gave such unpaid help or support as ‘carers’. Questions on caring were also asked in 2020 during the coronavirus pandemic, and are reported on here as well.
Main findings
In 2019-20, 29% of people provided unpaid help or support to others; with half of this group doing so for more than five hours a week.
The following factors are independently associated with people who care for others (for more than 5 hours per week):
- being aged 45 and over
- being female
- living in social housing rather than being an owner-occupier
- living in the 20% most deprived areas of Wales
- feeling low levels of satisfaction with life
- having a limiting long-term illness
- being unemployed or economically inactive
In June to September 2020, a similar proportion of people said they were carers (31%), with 95% of these saying they would continue providing help for at least 6 months or for as long as necessary.
Carers
When controlling for other factors (see regression technical report) the following characteristics were significantly associated with being a carer (for more than 5 hours a week) in 2019-20.
Age
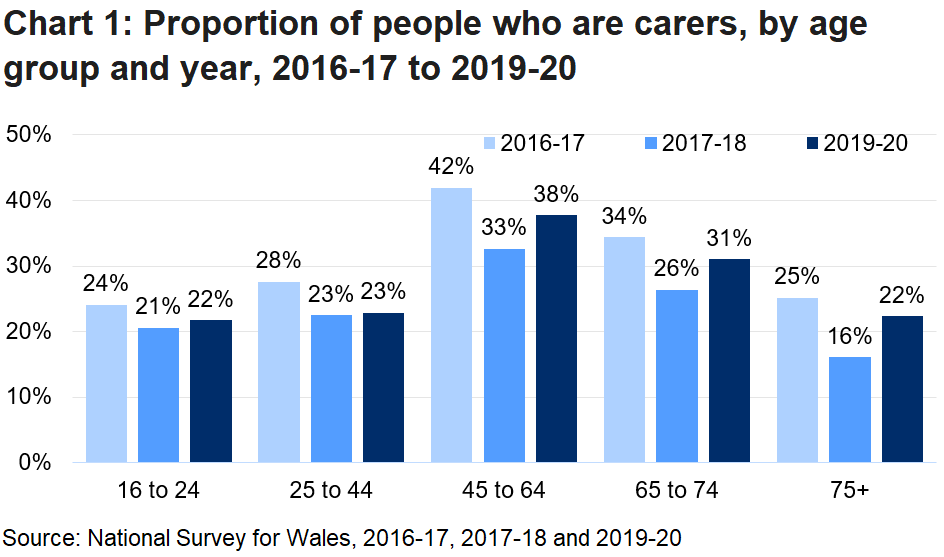
- People between the ages of 45 and 74 were the age group most likely to be carers. Chart 1 shows this remains the case when all carers are included; there has been some variation in results across years but the pattern of participation remains the same.
Sex
- 31% of women were carers compared with 27% of men.
Housing
- When controlling for other factors people living in social housing were more likely to be carers (for 5+hours) than owner-occupiers. Simple analysis showed that of all carers, 31% of people in social housing were caring for someone compared with 29% of owner-occupiers and 22% of people in private rented homes. This low proportion within private rented housing is more likely explained by the younger age demographic in this type of accommodation than by the type of tenure itself.
Area deprivation
- When controlling for other factors area deprivation was seen to be related to whether a person was a carer (for 5+ hours) or not. People living in the most deprived 20% of areas were more likely to be carers than those living in the 20% least deprived areas. This distinction was not apparent in simple cross-tab analysis for all carers but was true for those caring for more than 5 hours per week.
Wellbeing
- 31% of people who said that they had low to medium levels of life satisfaction were carers, compared with 27% of people who said they were highly satisfied with their life. This is likely to be a complex relationship where in some cases caring may decrease a person’s satisfaction with life whilst for other people supporting someone else adds to their life satisfaction.
Long-term limiting illness
- People who themselves had long-term illnesses or conditions which limited their ability to carry out everyday tasks were more likely to be carers than those without such an impairment.
Employment status
- Perhaps unsurprisingly, people who were in employment were less likely to be carers than the retired or unemployed.
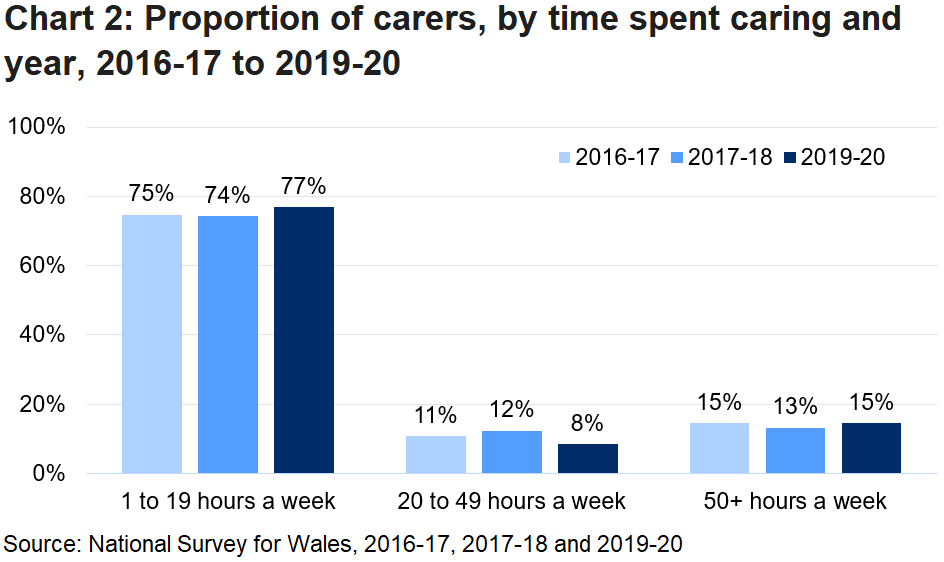
Time spent caring
- 51% of carers provided up to 5 hours of unpaid care per week supporting family, friends or neighbours. In 2016-17 and 2017-18 the 5 hour measure was not available but Chart 2 shows comparable time splits across years and with consistent results.
- 31% of carers who were aged 75 and over looked after someone else for fifty or more hours per week. This compares with 15% of people age 45 to 74 who spent this amount of time caring.
- 63% of young carers (aged 16 to 24) spent between 1 and 5 hours a week supporting someone else. 4% of young carers said they spent 50 or more hours per week caring.
- 24% of carers who we consider to be materially deprived, cared for someone for 50 or more hours per week. This compares with 13% of non- materially deprived carers who looked after someone for 50 or more hours per week.
Caring and COVID-19
Following the start of the coronavirus pandemic the National Survey could no longer be conducted face-to-face and from May 2020 it became a shorter telephone survey. From June to September, people were asked whether they looked after, helped or supported anyone else because of ill-health, disability or old age.
- 31% of people said they were carers for one or more hours per week. This is in keeping with the 2019-20 results reported earlier. Women (33%) were more likely to be carers than men (28%) as previously, and the pattern of caring was similar for different age groups.
- These results suggest that despite the pandemic people in general did continue to offer care to others and even when the recipient was in a different household.
Policy context
Under the Social Services and Well-being (Wales) Act 2014 a duty is placed on the Welsh Government, local authorities and health boards to promote the well-being of people who need care and support, and of carers.
The Strategy for unpaid carers was launched on March 23rd, 2021 which reaffirmed Welsh Government’s commitment to improving the recognition of and support provided to unpaid carers in Wales. The strategy sets out revised national priorities for unpaid carers, including the addition of a new priority on education and employment and will be followed by a more detailed delivery plan in autumn 2021.
Quality and methodology information
The 2019-20 National Survey was a face-to-face survey of over 12,000 randomly selected adults across Wales running from April 2019 to March 2020.
Due to the coronavirus pandemic we changed to a shorter, monthly telephone survey. From May 2020 onwards telephone interviews were carried out with a random sample of people who had previously taken part in a full-year, face-to-face National Survey.
Detailed charts and tables of results are available in our interactive results viewer. For information on data collection and methodology please see our Quality report and Regression technical report.
National Statistics status
The United Kingdom Statistics Authority has designated these statistics as National Statistics, in accordance with the Statistics and Registration Service Act 2007 and signifying compliance with the Code of Practice for Statistics.
National Statistics status means that official statistics meet the highest standards of trustworthiness, quality and public value.
All official statistics should comply with all aspects of the Code of Practice for Statistics. They are awarded National Statistics status following an assessment by the UK Statistics Authority’s regulatory arm. The Authority considers whether the statistics meet the highest standards of Code compliance, including the value they add to public decisions and debate.
It is Welsh Government’s responsibility to maintain compliance with the standards expected of National Statistics. If we become concerned about whether these statistics are still meeting the appropriate standards, we will discuss any concerns with the Authority promptly. National Statistics status can be removed at any point when the highest standards are not maintained, and reinstated when standards are restored.
The continued designation of these statistics as National Statistics was confirmed in June 2020 following a compliance check by the Office for
Statistics Regulation (letter of confirmation). These statistics last underwent a full assessment (full report) against the Code of Practice in 2013.
Since the latest review by the Office for Statistics Regulation, we have continued to comply with the Code of Practice for Statistics, and have made the following improvements:
- provided more detailed breakdowns in the results viewer and made it easier for users to compare results across years
- updated the survey topics annually to ensure we continue to meet changing policy need
- made regression analysis a standard part of our outputs to help users understand the contribution of particular factors to outcomes of interest
Well-being of Future Generations Act (WFG)
The Well-being of Future Generations Act 2015 is about improving the social, economic, environmental and cultural wellbeing of Wales. The Act puts in place seven wellbeing goals for Wales. These are for a more equal, prosperous, resilient, healthier and globally responsible Wales, with cohesive communities and a vibrant culture and thriving Welsh language. Under section (10)(1) of the Act, the Welsh Ministers must (a) publish indicators (“national indicators”) that must be applied for the purpose of measuring progress towards the achievement of the wellbeing goals, and (b) lay a copy of the national indicators before Senedd Cymru. The 46 national indicators were laid in March 2016. The National Survey collects information for 15 of the 46 indicators.
Further information on the Well-being of Future Generations (Wales) Act 2015.
The statistics included in this release could also provide supporting narrative to the national indicators and be used by public services boards in relation to their local wellbeing assessments and local wellbeing plans.
Contact details
Statistician: Siobhan Evans
Telephone: 0300 025 6685
Email: surveys@gov.wales
Media: 0300 025 8099
![]()
SB 12/2021