Wales tourism accommodation occupancy surveys: January to September 2020
The occupancy surveys provide trend information on the demand for tourist accommodation in Wales for January to September 2020.
In this page
The first 2 months of this report covers the period before the full effects of the COVID-19 pandemic were seen in the UK. From 23 March 2020, the accommodation industry closed due to the lockdown regulations implemented across the UK which saw businesses across Wales temporarily close. Therefore, the sample sizes during April to July in the hotel sector are very small and extreme caution should be used when interpreting these results. Data for the other sectors was not collected during this period of mandatory closures.
Main points
- Due to the mandatory closures in place across the UK, from April to July 2020, occupancy results for this period across all sectors are very low or no occupancy data was available.
- During the period March to September 2020, room[1] occupancy saw responding hotels reporting substantially lower occupancy levels across the first three quarters of the year. With bedspace occupancy experiencing the same pattern.
- Self-catering occupancy rates for September 2020 increased compared to previous years, with unit occupancy during this month at its highest level over the last three years.
- Occupancy rates in the static caravans and holiday homes sector peaked in September 2020 with 92% occupancy; a rise of 2 percentage points on both September 2018 and 2019.
- The first two months of the year were on a par with previous years for hostels but the national lockdown period from 23 March to 11 July 2020 saw occupancy levels in hostels severely affected by the COVID-19 pandemic, with September 2020 falling 31 percentage points on September 2019. The nature of the hostel and bunkhouse accommodation was a key factor in the low levels of occupancy seen across the sector, with the restrictions on numbers staying in multi-occupied rooms along with social distance guidelines.
[1] Some occupancy rates for individual hotels may be slightly higher than they would have been in a normal year as some rooms/units may have been taken out of operation due to the need for social distancing. The data reported during January to September is based on net occupancy which refers only to those businesses that were open and who provided data during this period
Change in weighting
During several months of 2020, a significant number of hotels, and guesthouses and B&Bs were not open due to COVID-19 restrictions which limited serviced accommodation operating resulting in only a small number of hotels and, guesthouse and B&Bs providing data, which impacted the weightings. Weighting of occupancy data is designed to adjust for different levels of response across regions and size bands but when the sample size is small the effect of the weighting for certain regions or size bands can be exaggerated. In the months of COVID-19 lockdown when sample sizes in some regions were in single figures, it would have had the effect of making individual establishments dominate the results. Therefore, the data in 2020 is presented unweighted and only reflects occupancy levels of responding hotels and guesthouse/B&Bs which were open in the relevant month. Due to this, it should be noted that the hotel, and guesthouse and B&B occupancy data shown in this report for 2020 cannot be interpreted as representing the serviced accommodation market as a whole, and given the methodological differences, is not comparable to 2018 and 2019 data shown within the hotel and, guesthouse and B&B sections of this report.
Hotels
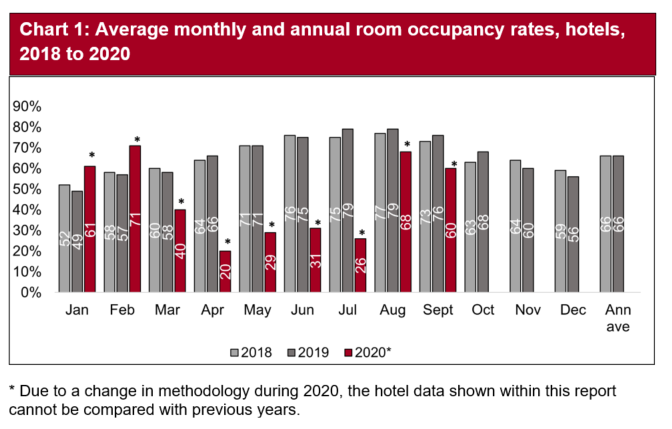
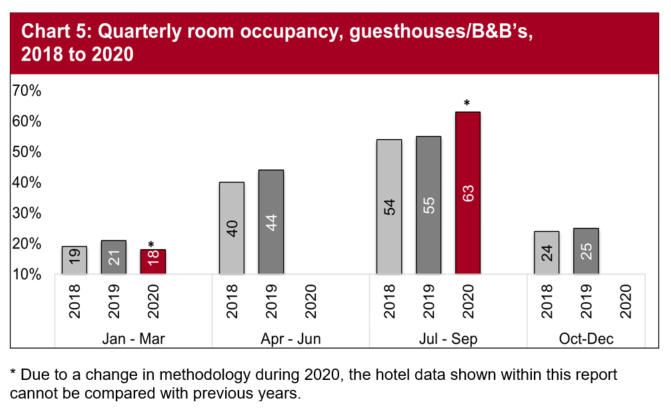
During the period March to September 2020, room occupancy saw responding hotels reporting substantially lower occupancy levels, with bedspace occupancy experiencing the same pattern. Both measures had been affected by the temporary closures in the serviced accommodation sector by the COVID-19 pandemic, as from 23 March to 11 July only essential guests were permitted in the small number of hotels which were open. Both August and September saw the number of open establishments increase although capacity may have still been reduced during this period due to COVID-19 restrictions.
Note: Some occupancy rates for individual hotels may be slightly higher than they would have been in a normal year as some rooms/units may have been taken out of operation due to the need for social distancing. The data reported during January to September is based on net occupancy which refers only to those businesses that were open and who provided data during this period
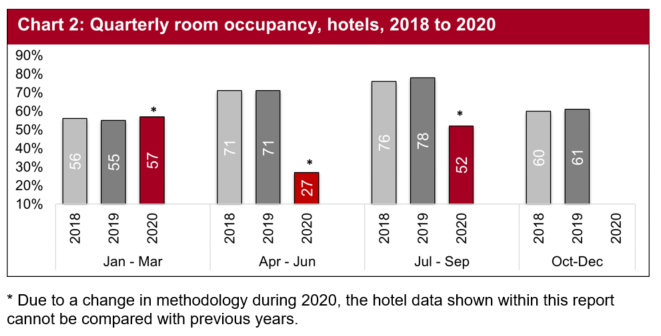
Both room and bedspace occupancy was affected in the first three quarters of the year, with April-June 2020 most influenced by the mandatory closure of businesses during this period. The following period in July to September began to see occupancy rates rise. However, not all businesses reopened on 11 July due to implementing COVID-19 measures to safeguard both guests and staff (see context section).
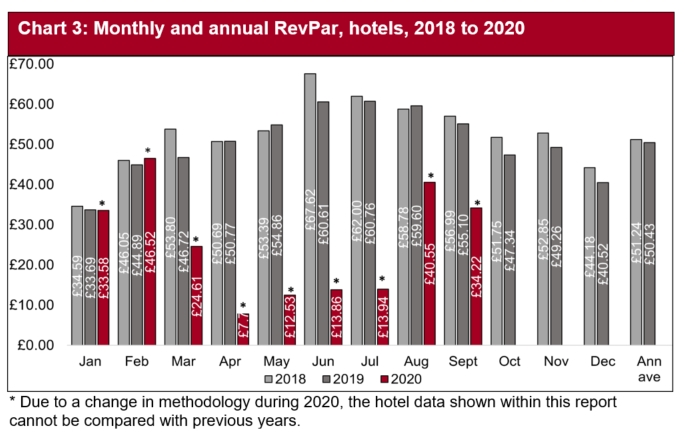
With only a small number of hotels open to key workers during the period of mandatory closure, the RevPAR rates during this period were much lower than would normally be expected during the peak summer months.
Note: Revenue per available room (RevPAR) is a metric used in the hospitality industry to measure performance. The measurement is calculated by multiplying a hotels average daily room rate (ADR) by its occupancy rate
Guesthouses and, Bed and breakfast
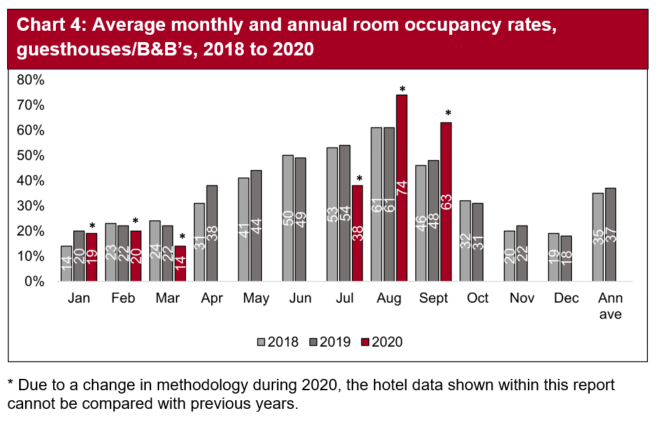
Most guesthouses/B&Bs did not offer accommodation to key workers and the majority of establishments were closed completely during the lockdown period from 23 March until 11 July and therefore data was not collected during this period. In addition, the sample size for this sector is historically very low and should be interpreted with caution.
Similarly to the hotel sector, the occupancy rates are reflected in the period affected by the lockdown, from 23 March to 11 July. Although businesses began to reopen in July, and the months of August and September saw an increase in the number of open establishments, capacity may still have been reduced during this period due to COVID-19 restrictions.
As with the hotel sector, both room and bedspace occupancy saw the effects of the pandemic in the first and third quarters of the year.
Self-catering
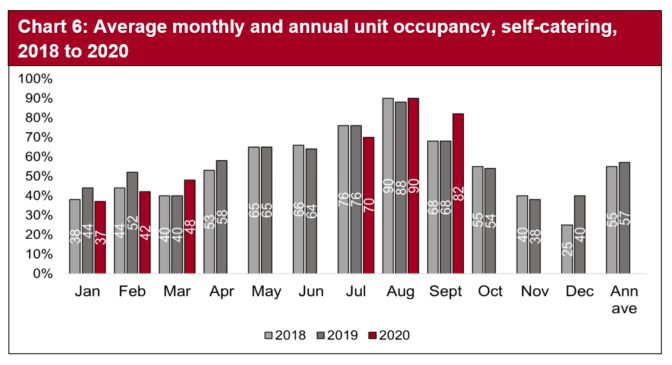
Self-catering occupancy rates are generally affected by school holidays, with higher occupancy rates during this period. The month of August recorded its highest monthly unit occupancy since August 2018 (both 90%), with many people booking to go away once the lockdown restrictions had been fully lifted. In September, unit occupancy was the highest it had been over the last three years.
The effects of the pandemic can be seen in the January to September 2020 year to date average, which was 52%, comprising a fall of 10 percentage points compared with the same period in 2019 at 62%. This is even more evident when you compare the January to September average from 2018 at 60 per cent, to the 2019 figure where unit occupancy rates had risen by 2 percentage points.
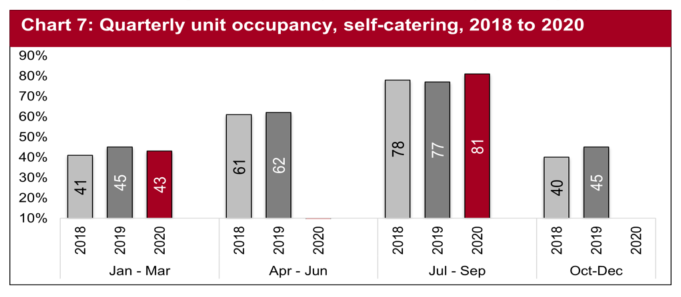
As with other sectors, the April to June 2020 quarter was severely affected by the COVID-19 pandemic. However, the following quarter covering July to September 2020 saw an increase of 4 percentage points on the previous two years with confidence in booking holidays and short breaks increasing during the summer months immediately after the lockdown period.
Static caravan holiday homes
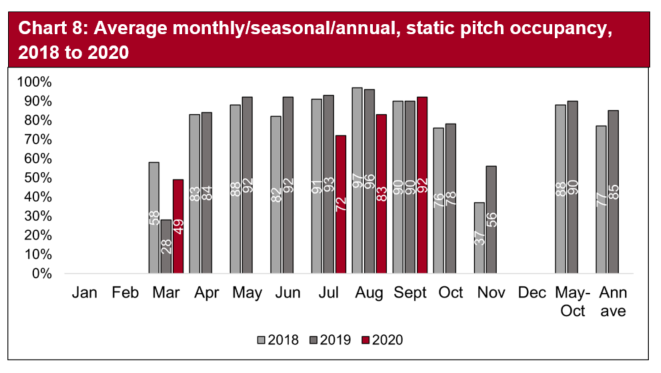
On 11 July 2020, lockdown restrictions on accommodation use started to be lifted in a phased approach. Accommodation that was entirely self-contained such as static holiday caravans could re-open although facilities on site were not available to use.
Occupancy in the static caravans and holiday homes sector peaked in September with 92% occupancy; a rise of 2 percentage points on both September 2018 and 2019. With most businesses closed throughout the lockdown period from 23 March to 11 July, pitch occupancy in July and August were considerably lower than would be expected during the main season for holidaymakers.
Revision note
Due to additional data becoming available for incorporation into the aggregate occupancy rate, figures for static caravan occupancy in July and August 2020 have been revised since this report was published. Please see Wales tourism accommodation occupancy surveys: October to December 2020 report for updated figures.
Touring caravan and camping parks
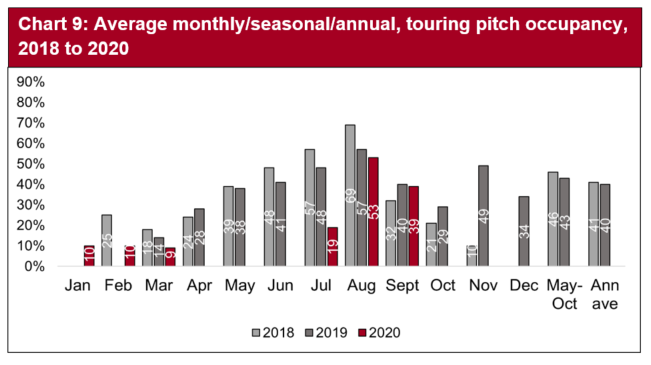
As with static caravan and camping parks, accommodation that was entirely self-contained such as modern touring caravans, motorhomes and some glamping accommodation which had their own facilities; could re-open on the 11 July 2020.
Pitch occupancy across the touring caravan and camping parks fell marginally during September 2020 when compared with the same month in 2019, although August 2020 had returned to a reasonable level, down by only 4 percentage points on August 2019.
Hostels
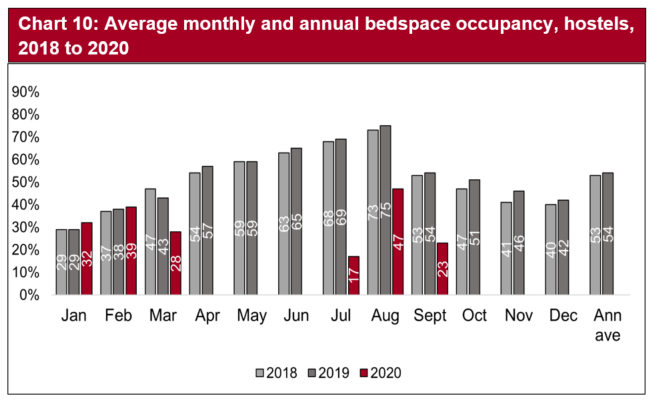
The first two months of the year were on a par with both previous years but the national lockdown period from 23 March to 11tJuly saw occupancy levels in hostels severely affected by the COVID-19 pandemic, with September 2020 falling 31 percentage points on September 2019. Although August saw a rise in occupancy levels, the nature of the sector made it difficult to fully reopen for businesses with COVID-19 restrictions on the number of guests staying in hostels.
Overall, hostel bedspace occupancy had fallen by 25 percentage points in the period from January to September 2020
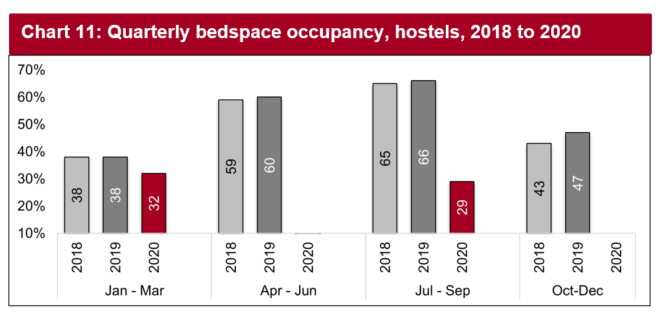
The first quarter of 2020 fell by 6 percentage points and as mentioned previously, the nature of the hostel and bunkhouse accommodation was a key factor in the slow recovery across the sector, with restrictions on the numbers staying in the multi-occupied rooms. The July to September 2020 quarter had fallen significantly, down from 66 percentage points in 2019 to 29 percentage points in 2020, a decrease of 37 percentage points.
Context
Before the national lockdown started on 23 March 2020, occupancy levels across all of the sectors covered in this summary report were fairly consistent with previous years in 2018 and 2019. During the lockdown period from 23 March to mid-July, many businesses had temporarily closed due to the COVID-19 pandemic. The small sample reported on during this period in the hotel sector, was in relation to hotels that provided necessary accommodation to key workers, vulnerable groups and those who had been stranded at their accommodation due to the lockdown and restrictions on travel. On 6 July 2020, Wales lifted its “Stay Local” restrictions which enabled people to visit other areas of the country and further afield. On 11 July 2020, lockdown restrictions on accommodation use was lifted, although a phased approach during July was adopted. Accommodation that was entirely self-contained such as holiday cottages, holiday caravans including modern touring caravans and motorhomes and some glamping accommodation could re-open. This also included hotels and other serviced accommodation (B&Bs, hostels etc) which provided en-suite rooms and can room service meals. Accommodation that offered shared facilities such as camping and caravan sites and hostels did not reopen until 25 July 2020.
However, not all businesses re-opened immediately and delayed their re-opening to ensure that their premises were COVID-19 safe and risk assessments were in place, and others who ran small family businesses did not think it financially viable to open with restrictions in place. The risk to some business owners who had been shielding was also a factor in their decision not to reopen when lockdown restrictions had been lifted.
Main timelines in 2020
- UK National Lockdown from 23 March 2020.
- 6 July 2020 Wales lifts its “Stay Local” travel restrictions and outdoor attractions were allowed to re-open.
- Lockdown ends 11 July 2020 for accommodation businesses without shared facilities.
- 13 July 2020 re-opening of indoor visitor attractions but excluding any part of a visitor attraction which is underground.
- Tourist accommodation with shared facilities such as camping sites were able to reopen from 25 July 2020 but shared facilities on the premises remained closed, such as swimming pools, leisure facilities, shared shower and toilets blocks.
- 27 July 2020 museums and galleries allowed to reopen.
- Eat Out to Help Out Scheme (3 to 31 August 2020).
- 7 September 2020 residents of Caerphilly County Borough Council are made subject to the first local lockdown in Wales, which takes effect from 6pm on 8 September 2020.
- 21 September 2020 lockdown restrictions are announced for Merthyr Tydfil, Bridgend, Blaenau Gwent and Newport with effect from 6pm on 22 September 2020.
- 26 September 2020 Wales first town-only lockdown comes into force in Llanelli.
Sample size
When the national lockdown began on 23 March 2020, almost all accommodation businesses across Wales temporarily closed with the exception of a small number of large hotels who remained open to provide temporary accommodation to key workers and other groups affected by the COVID-19 pandemic. Although lockdown ended on 11 July 2020, and sample sizes began to increase, not all business re-opened immediately. By September, sample sizes were beginning to return to the levels seen in the early months of 2020 but uncertainty across the sectors was still apparent. It is worth noting that the lower self-catering sample in September is not related to the COVID-19 pandemic but the change in ownership of one of the large agencies who supply occupancy data and therefore data was not available during this month.
Each of the monthly samples sizes by sector shown below are those businesses that were open and provided data in their return for that month.
| Hotels | Guest houses and, bed and breakfast |
Self-catering | ||||
|---|---|---|---|---|---|---|
| Open | Closed | Open | Closed | Open | Closed | |
| January | 175 | 6 | 20 | 7 | 856 | 84 |
| February | 170 | 4 | 20 | 6 | 627 | 89 |
| March | 163 | 18 | 18 | 10 | 759 | 104 |
| April | 19 | 162 | 1 | 27 | 3 | 736 |
| May | 20 | 161 | 2 | 26 | 0 | 739 |
| June | 22 | 164 | 1 | 27 | 0 | 740 |
| July | 126 | 56 | 13 | 12 | 950 | 17 |
| August | 162 | 16 | 17 | 6 | 945 | 19 |
| September | 162 | 13 | 18 | 7 | 653 | 17 |
| Static caravan | Touring caravan | Hostels | ||||
|---|---|---|---|---|---|---|
| Open | Closed | Open | Closed | Open | Closed | |
| January | 2 | 20 | 2 | 32 | 21 | 0 |
| February | 2 | 20 | 2 | 32 | 18 | 1 |
| March | 11 | 11 | 6 | 28 | 18 | 2 |
| April | 0 | 22 | 0 | 34 | 0 | 20 |
| May | 0 | 22 | 0 | 33 | 0 | 21 |
| June | 0 | 22 | 0 | 33 | 0 | 21 |
| July | 18 | 1 | 18 | 7 | 20 | 1 |
| August | 18 | 1 | 18 | 6 | 20 | 1 |
| September | 17 | 2 | 16 | 6 | 21 | 0 |
Contact details
Birgitte Magnussen
Telephone: 0300 062 5296
Email: tourismresearch@gov.wales
Social research number: 4/2021
Digital ISBN 978-1-80082-699-1