SARS-Cov-2 Genomic Insights with cover statement
This document outlines some of the insights that have been gained from the genomics work that has been undertaken to date, in order to support decision making.
In this page
Context
This document was prepared in response to an urgent request from Welsh Government to summarise any insights from genomic data that were relevant to decision making relating to the current phase of the pandemic.
The scientific process can take months or years to take data, craft it into a paper and then pass through peer review, before finally being published. During a pandemic, it is necessary that preliminary data and analyses are shared more rapidly with government to provide a basis for decision making, where findings are then often discussed within the context of scientific advisory groups such as SAGE or the Welsh Technical Advisory Group.
This document has been prepared for ministers/government advisors and so has been written in such a way as to render the results more understandable to a more general audience. It has not been peer reviewed, although work described within this document may form part of papers that will be published and peer reviewed in the future.
Although the normal process would see this document considered within scientific advisory groups first, because of the public interest around this subject matter, and for reasons of transparency, it is being released prior to this occurring.
This document summarises a large number of analyses and activities that are currently taking place to analyse SARS-CoV-2 genome sequence data in Wales. Many of the results presented are preliminary, and the document is caveated at the start to reflect this. It is important to emphasise that genomic data should be interpreted along with other information, and that as new data is collected and analysed, the conclusions that can be drawn from the data may change.
You can read more on the background on the COG-UK project, which is the national consortium that is performing sequencing of SARS-CoV-2 viral genomes.
COG-UK provides a number of genomics explainers relating to SARS-CoV-2 which may be relevant. Particularly What studying the virus' genomes can tell us about the pandemic
Other members of the COG-UK team have previously conducted analyses looking at importation into the UK and Scotland during the first wave of the pandemic. These papers may provide additional useful context to this document.
Analysis continues within COG-UK to look at the areas examined in this document, and more, and further analyses will be published in due course via a range of routes.
Background
The first Welsh SARS-CoV-2 genome was sequenced on 6 March. Since then, over 7,500 SARS-CoV-2 genomes from Welsh cases have been sequenced and analysed alongside over 50,000 other SARS-CoV-2 genomes sequenced across the UK as part of the COVID-19 Genomics UK Consortium (COG-UK). Since March we have used genomics data in real-time to support the pandemic response in Wales and the UK, to analyse what is occurring at a UK level, at a Welsh level, and at a local level. This includes the provision of analysis results to Welsh Government, as well as performing outbreak analysis in response to requests from within the NHS. This document outlines some of the insights that have been gained from the genomics work that has been undertaken to date, in order to support decision making. This data has been collated rapidly, and so comes with a number of caveats.
Caveats
The analysis presented here is part of ongoing efforts to analyse the COVID-19 pandemic. Some results are preliminary and the results may change as further analysis is conducted. In all cases the data should be interpreted with other information, and not accepted as a single grand truth. The data presented also makes extensive use of phylogenetics and population genomics. The results of broad phylogenetic and population genetic analyses may be consistent with a particular scenario, but this does not constitute definitive proof. Indications may shift as more data accumulate, for example there can be bias caused by differences in sampling effort across global regions, or reduced precision due to lags between infection and confirmation of infections. Furthermore, interventions often vary in concert and the effects of one intervention will be confounded by others. Nevertheless, these approaches can be extremely informative when confirming a priori expectations, assessing trends, and in investigations at a local level.
Terminology
The genome sequence data is analysed by the COG-UK team, and makes use of genome sequences from other parts of the world. We identify differences between the virus genomes, and use this to broadly group genetically similar viruses into UK Lineages. A UK lineage is an approximation of one or more introductions of SARS-CoV-2 into the UK, and its subsequent evolution whilst in the UK . Because in the UK and Wales we sequence many more SARS-CoV-2 genomes than other countries, there are often cases where contextualising SARS-CoV-2 genome sequences from other countries are not available, and a single UK lineage represents several imports into the UK, with subsequent local transmission. We perform additional analyses to break UK Lineages down into smaller, more granular groups for outbreak analyses. These we call Phylotypes.
Current Situation in Wales
In the 14 days preceding 5 October, 31 UK lineages of SARS-CoV-2 had been seen in at least one Welsh patient and 12 UK Lineages had been seen in 5 or more Welsh patients. Lineage counts are now ticking up, although the numbers of active lineages are growing, the situation is still clearly different to the situation in March/April (Figure 1).
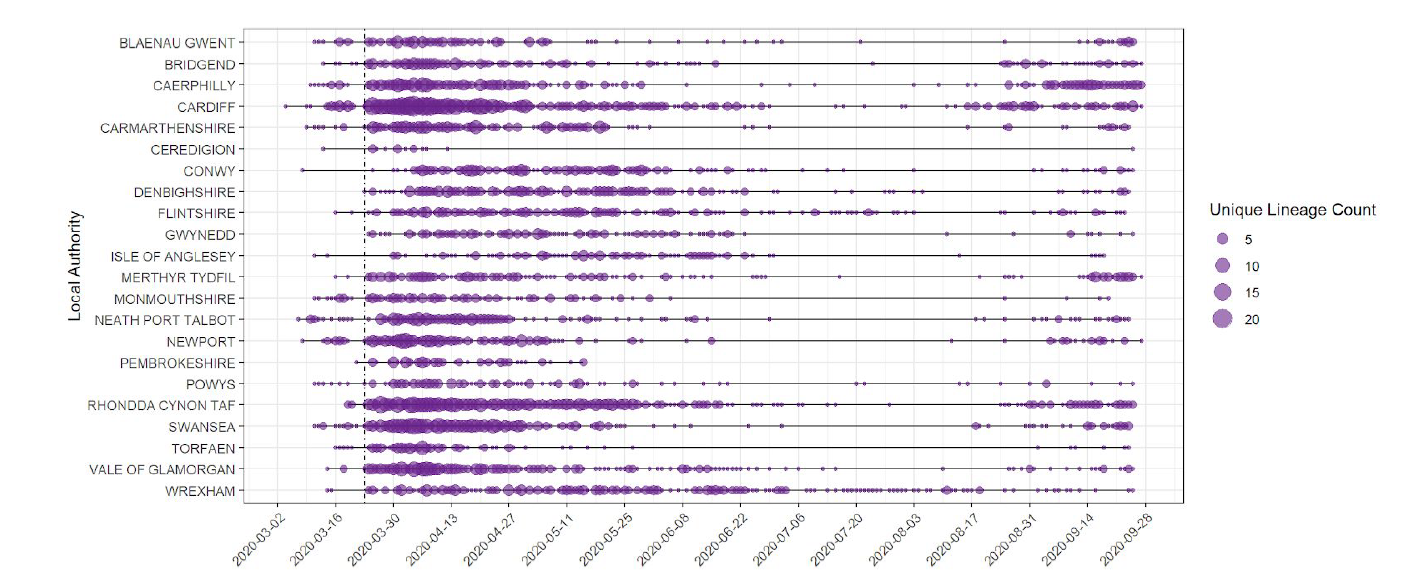
Figure 1: Unique SARS-CoV-2 UK lineages observed per Welsh local authority over time. The size of circle represents the number of UK lineages seen in a local authority at a given point in time.
Since 27 February 2020, 243 distinct phylotypes with 5 or more cases in Wales have been detected. Figure 2 shows changes in active UK lineages in Wales over time. While we have seen increases over the summer, the numbers of UK lineages remain less than in mid-March (Figure 1 and 2). Recent dips in the number of active lineages may relate to the fact that many cases currently fall within particular lineages (i.e there has been a fall off of imports into Wales), a focus on outbreak sequencing in the last 2-4 weeks, time lag associated with receiving samples from labs across Wales and lack of availability of community samples from Lighthouse labs.
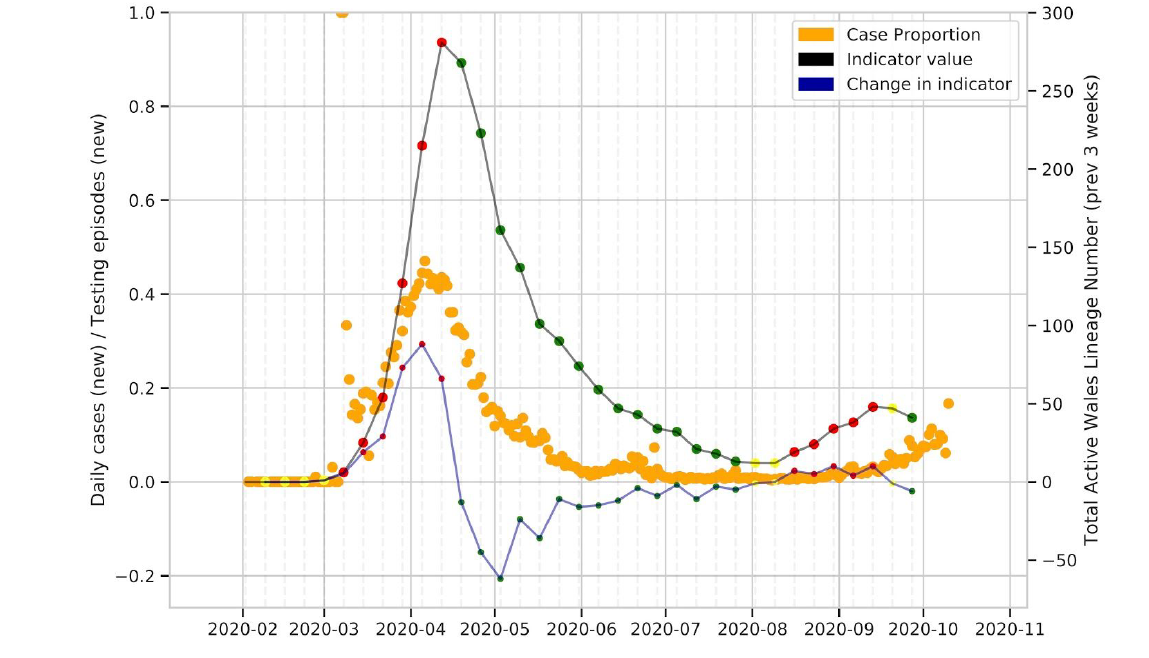
Figure 2: Active UK lineages observed in Wales over time. Point colours are the RAG rating for the indicator. The thick black line is the indicator value, with the thinner blue line being the change in number of active lineages over time.
Across Wales we see that most cases are from a limited number of UK lineages. In particular, lineages UK389, UK395, UK461 and UK5 have increased in recent weeks in multiple parts of Wales. In most cases the lineages that are predominantly responsible for cases now have not been seen in Wales prior to the August-October period (Figure 3).
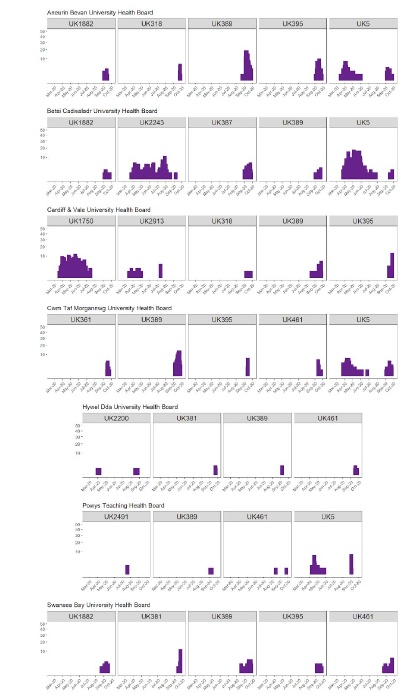
Figure 3: Showing case numbers associated with the top 5 UK lineages in each health board in the 12 most recent epidemiological weeks prior to 5 October. Only lineages with more than 1 sample in the last 12 epi weeks are shown. For context, the graphs show the case counts for these top 5 current lineages all the way back to the start of the pandemic in Wales.
The graphs demonstrate the two types of lineage that are currently causing disease in Wales.
Firstly, UK lineages such as UK5 and UK2243 have been long term causes of disease in Wales. UK5 is the largest UK lineage and was probably introduced into the UK multiple times in February/March, and became rapidly established in community transmission. As one of the largest lineages, it has continued to transmit in the community as other smaller lineages have died out. Secondly, we see a new wave of lineages arriving in Wales over the summer. Lineages such as UK389 and UK395 have never been seen before in Wales and have arrived in the August-September timescale to cause considerable numbers of cases in multiple locations, simultaneously. Examining these new arrival lineages reveals that they have arrived in many parts of the UK simultaneously, presenting a signature that is consistent with the idea that these lineages have been seeded by multiple simultaneous imports from outside Wales/the UK.
We have been actively examining the key lineages within health boards, and we have observed evidence of key UK lineage increases being driven by multiple imports into different parts of the UK. What seems evident from the data is that travel into the UK has played a role in establishing the second wave.
Since July we have performed over 20 outbreak analyses in Wales, these provide a number of insights relating both to local spread and to the effect of control measures.
As well as examining outbreaks we have also worked to understand the affect of mutations on severity, viral transmission and testing accuracy. This surveillance continues and has implications for laboratory testing and on modelling efforts.
Insights
We have undertaken a range of analyses as part of the pandemic response to date. Here we summarise a set of insights that are evident from our analyses to date which are potentially relevant to policy decisions being considered.
Insights from geographic analysis of sequence data within Wales
Examining transmission patterns across Wales we find that cases in areas of high population density (e.g. cities) are more likely to result from local chains of transmission, whereas those in less urban areas are more likely to be imports from elsewhere and rarely lead to local onward transmission (Figure 4).
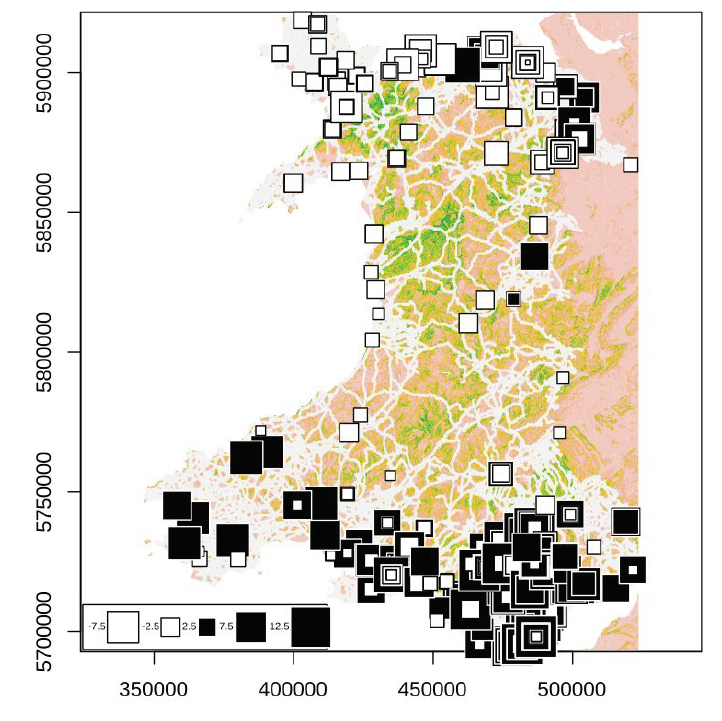
Figure 4: Visualisation of the extent of local transmission for cases in Wales up to the end of August. Larger black squares indicate that cases arising close together in space are also closely related (i.e. positive spatial-autocorrelation), whereas large white squares indicate that cases occurring close together in space are generally quite unrelated genetically. The plot represents mapping of the first principal components of a PCA onto geographic space, with black for positive values (produced using R package ade4). Base map is a resistance surface generated using digital elevation and road network data, colours reflect potential barriers to dispersal.
This data covers the pandemic to the end of August and considers only the major principal axes; however, the pattern implied by these results remains consistent with the picture from recent investigations of increases of cases in locations such as Wrexham. Analyses are ongoing to determine the full significance of these results.
Insights on imports from England into Wales and the impact of lockdown rules
We have been analysing evidence for importation of lineages into Wales, particularly from England. Using phylogenetics, we have inferred the likely origin of a phylotype (subtree) from sequence data, and from this identified the fraction of samples in an epi week that are from a new import. This shows that early on in the pandemic a high proportion of cases could be linked to imports, with the number decreasing considerably following lockdown (Figure 5).
This analysis shows that the proportion of cases that could be related back to new introductions began to rise again during July and August, coinciding with UK-wide lockdown relaxations (Figure 5). This observation/analysis also supports the conclusions from the analysis of outbreak cases.
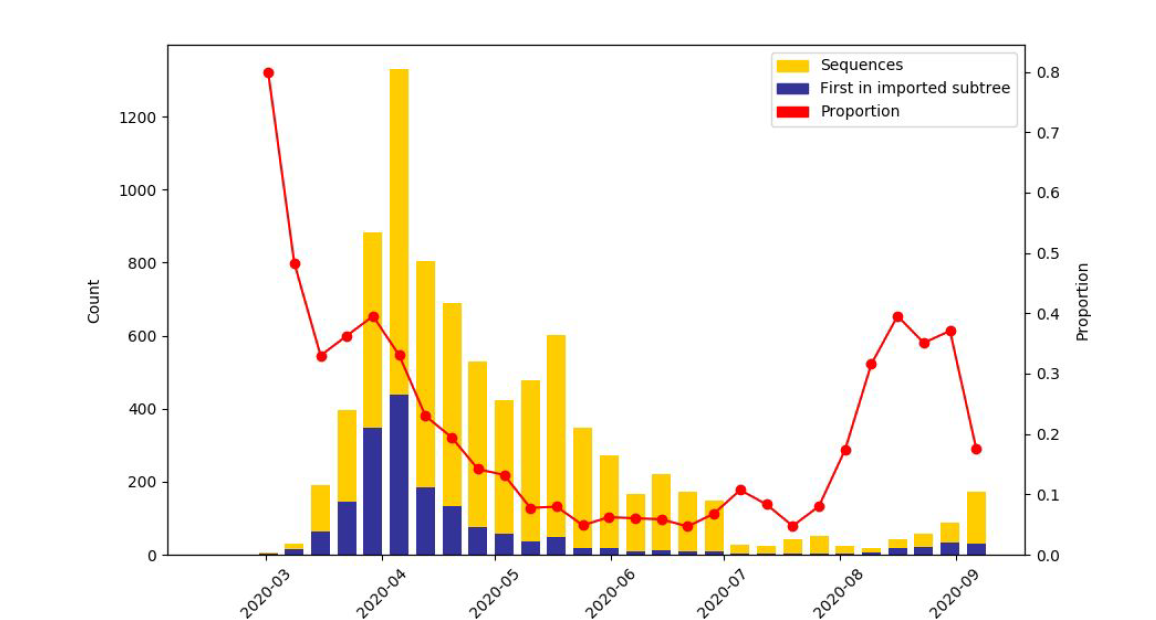
Figure 5: The results of analysis using ancestral state reconstruction to estimate where groups of samples represent imports from England/outside Wales. The blue blocks relate to the introduction of new phylotypes, and the red line relates to the proportion of cases that could potentially be linked to imports from England/outside Wales. It is likely that some of the proportion from August onwards represents travel cases to common destinations, where English cases were recorded first, and no sequence exists from that foreign location
When looking at the situation during the first wave, it is clear that the lockdown restrictions had a considerable effect in reducing imports from England/outside Wales. It is also clear that there has been an increase in imports into Wales over the course of the summer (Figure 5).
Collectively the import and geographic analyses point towards the fact that, both during the full lockdown and when limits on movement remained in Wales, these measures helped reduce long-distance transmission within/into Wales. Within our data, over the summer months, we also observe increased signatures of importation, which coincide with lockdown restriction easing. Other analyses (such as the analysis covering outbreaks, below) collectively suggest that travel has played a role in seeding new cases/lineages into Wales, which in some cases have gone on to transmit extensively within the community.
Insights from outbreaks
Genomic outbreak analyses have examined a range of settings, from food factories through to local community exceedances.
In community settings, recent outbreaks (e.g. Caerphilly) have largely been attributable to single UK lineages increasing in frequency in the community.
Examining these lineages identified that Welsh cases were often contemporaneous with cases from other parts of the UK, a signature that is suggestive of multiple simultaneous imports into Wales/the UK (Figure 6)
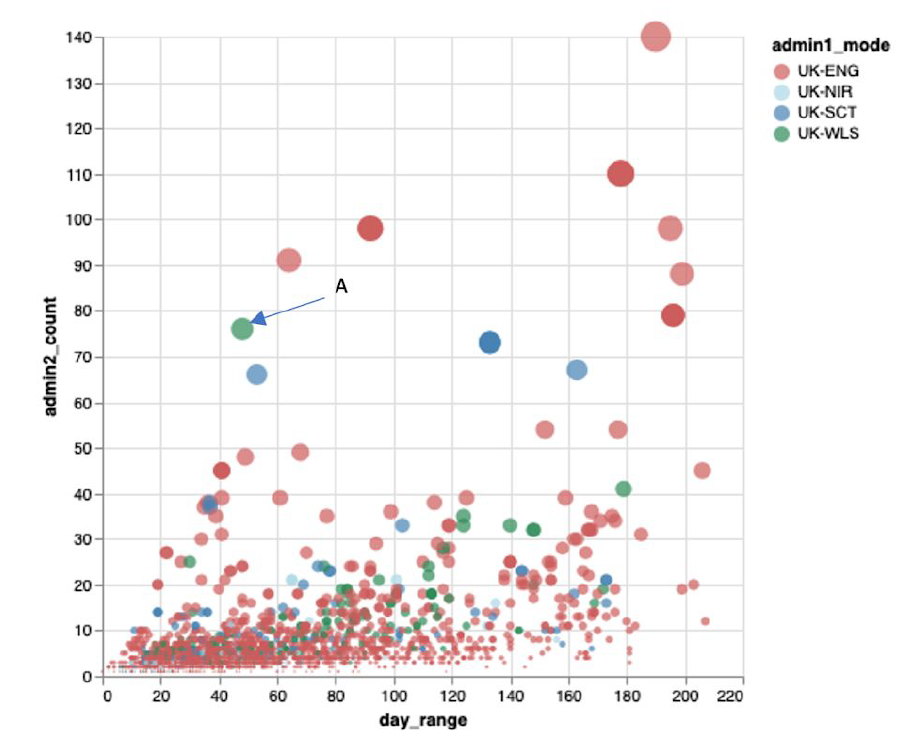
Figure 6: Graph taken from the Polecat tool developed by Professor Andrew Rambaut at the University of Edinburgh. The graph shows the lifetime of groups of related/similar viruses (in days, x-axis) plotted against the number of local authorities in the UK where that group is found (y-axis). The colours relate to the UK nation that has the most cases for that group. In general, one would expect groups of cases further on the right of the graph to be higher up, as transmission within the UK (as evidenced by occurrence across multiple local authorities) should be a function of time. Clusters such as those indicated that are further to the left imply implausibly fast spread, and may relate to groups of phylotypes that have been introduced multiple times into the UK by travel. The group marked ‘A’ includes the Caerphilly outbreak.
It is important to appreciate that by performing genomic surveillance, we are also able to see introductions that fizzle out, alongside the outbreaks that do take off.
In the case of the Caerphilly outbreak, viruses from the same group of phylotypes that caused disease in Caerphilly were also introduced multiple times elsewhere in the UK, but did not take off in the same way. The same is true of viruses from the group of phylotypes that caused the much-publicised outbreak in Aberdeen. These observations may relate to the importance of superspreading events in powering the pandemic.
We have performed outbreak analysis in multiple hospitals to date, and have seen evidence both of multiple introductions into a hospital, and also cases where hospital outbreaks are from a single lineage. In all cases this analysis has been contextualised with community cases. Recent hospital outbreaks have been caused by the same lineages circulating in the community, although in some cases it appears that there may be multiple introductions into hospitals, emphasising the challenges posed for IPC staff to prevent COVID-19 spreading in hospitals, especially when cases rapidly increase in numbers.
Insights from Wales-wide genomics indicators
We have been generating indicators based on changes in the size and number of UK lineages in Wales since August.
We observe that the lockdown resulted in a decrease in the number of circulating lineages, with low numbers of lineages circulating in Wales over the summer (Figure 1, Figure 7, Figure 8).
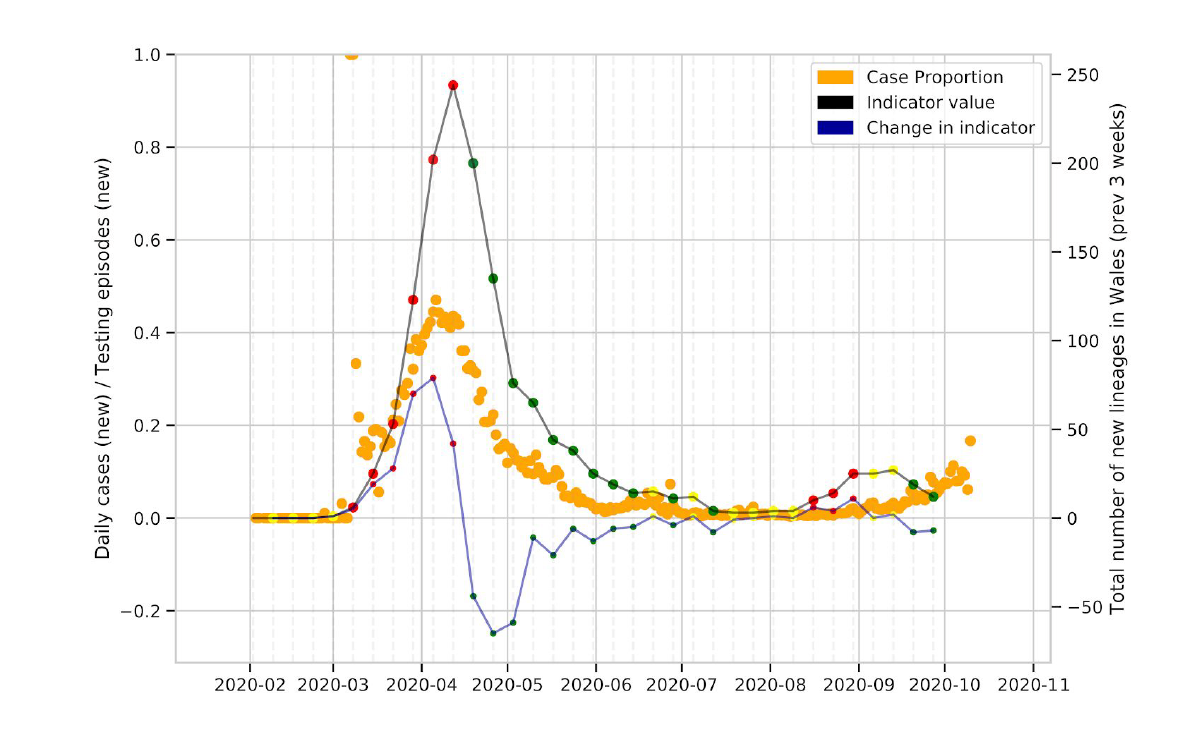
Figure 7: Change in the number of new UK lineages observed in Wales over time. The thick black line is the absolute number of cases, and the blue line is the change over time.
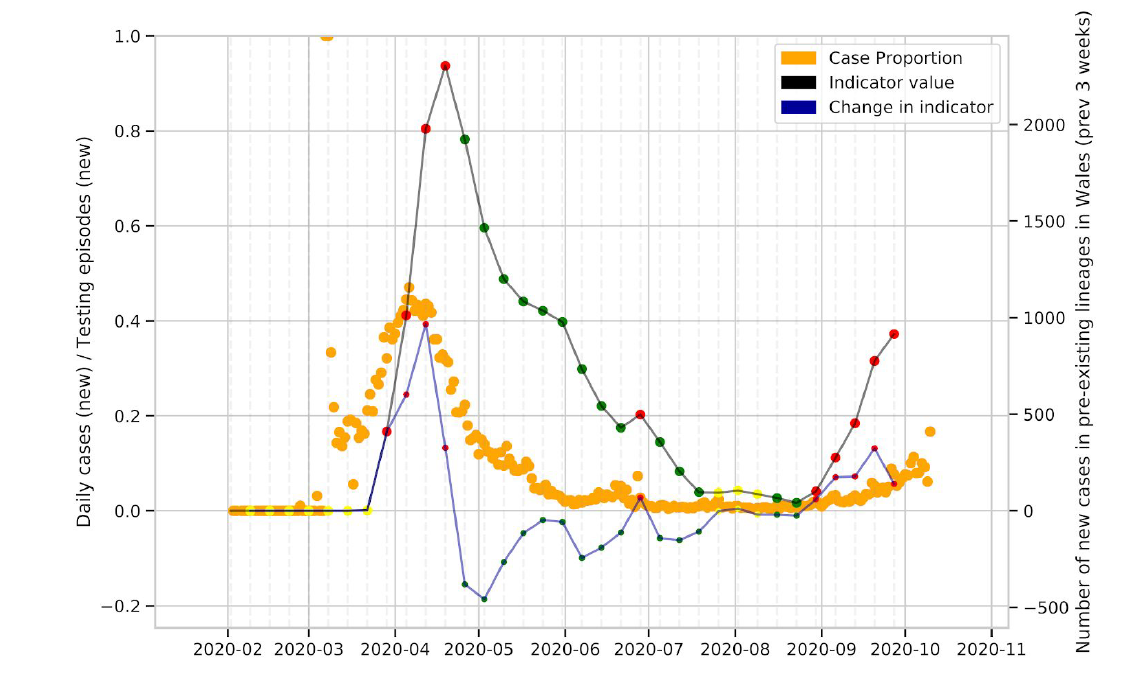
Figure 8: Change in the number of cases in UK lineages observed in Wales over time. The thick black line is the absolute number of cases, and the blue line is the change over time
The number of new lineages observed in Wales over time provides an indication of importations of SARS-CoV-2 into Wales, and we observe that this peaked most recently in August-September, but has declined since (Figure 7).
Looking at the number of cases in lineages in Wales (Figure 8), which has increased considerably and continues to increase, we gain added context for the analysis of new lineages observed in Wales.
Collectively the indicators imply that while the rate of imports may be decreasing at the moment (which could possibly relate to the effect of current control measures) we are seeing a potential transition to sustained community transmission within Wales, related to a limited number of lineages. It is likely that a proportion of these cases are related to outbreaks, however, the genomic data demonstrates that in a number of cases specific outbreaks are representative of circulating community phylotypes, indicating that community transmission is occurring for some phylotypes/lineages.
We also continue to examine lineages and transmission at a local level. At the present time we see clear evidence that local cases are dominated by a limited number of lineages (as shown in Figures 1 and 2), however, this should be caveated with the fact that at the moment we have limited access to community samples from lighthouse labs for sequencing.
Insights on transmissibility and severity
There has been considerable interest in the evolution of variants that might affect transmissibility or severity of SARS-CoV-2, with particular interest in a mutation at position 614 of the Spike protein.
This mutation has been shown to have a biological effect in cells.
We have undertaken the largest analysis of this question anywhere in the world to examine the effect of this mutation.
We found that the mutation did have an effect on transmissibility, which was potentially significant.
We found no evidence that the mutation has had any effect on severity of disease or severity of outcome (Figure 9).
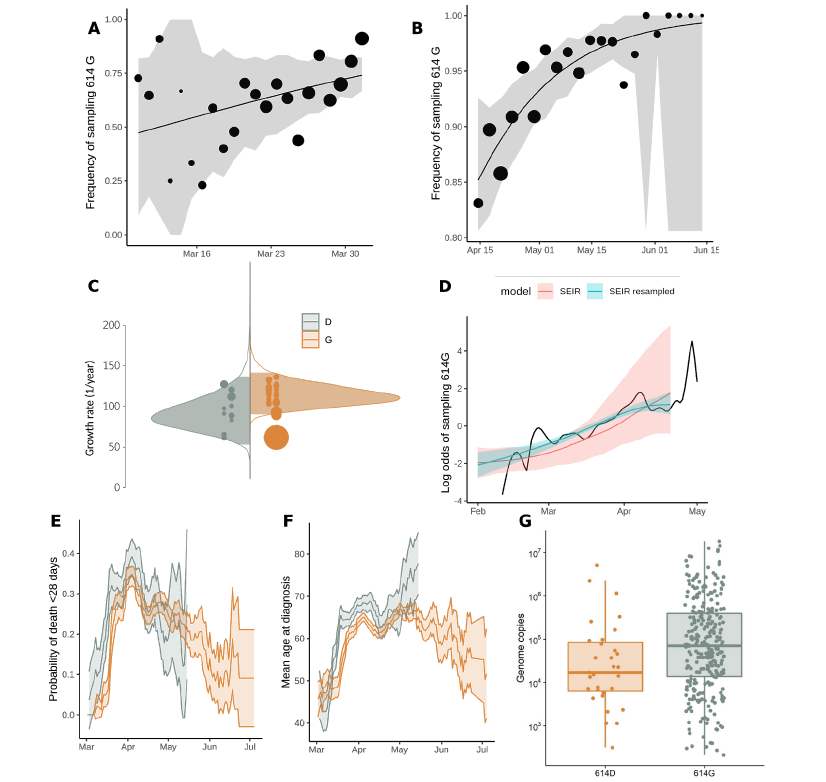
Figure 9: Relative frequency of Spike 614 D and G over time (A-B), phylodynamic growth rates (C-D), and comparison of clinical severity metrics (E-G).
- Frequency of sampling Spike 614G over time for clusters sampled during exponential growth phase. The size of points represents the number of samples collected on each day. The line and shaded region showed the MLE and confidence interval fit of the logistic growth model.
- As in (A) but including samples during a period after April 15 during a period of epidemic decline.
- Distribution of exponential growth rate for Spike 614G (brown) and 614D (grey) in units of 1/year. Solid areas span the 95% credible interval. Points indicate the rates estimated for specific clusters, and are sized by the number of sequences in that cluster.
- Log odds of sampling Spike 614G in London comparing empirical values (black line) and estimates based on the phylodynamic SEIR model (shaded regions). The green shaded region shows estimates making use of both genetic data and sample frequency data.
- The probability over time of fatal outcome within 28 days of diagnosis among UK patients with sequence data that can be matched to clinical records. Shaded regions show 95% confidence region of a 7-day moving average. Points with fewer than 20 observations are omitted.
- Moving average of age among samples included in (E).
- Viral load (RT-qPCR mean genome copies) estimated using SARS-CoV-2 RNA strands from 31 614D (614D) and 290 614G samples. From Voltz et al: https://www.medrxiv.org/content/10.1101/2020.07.31.20166082v2
Other work has demonstrated that this mutation shouldn’t have an effect on immunity or vaccine development.
We are monitoring other mutations, but we have no evidence of mutations affecting severity in Wales.
Our work is summarised in Evaluating the effects of SARS-CoV-2 Spike mutation D614G on transmissibility and pathogenicity.
Conclusions
The genomics data make clear that the current structure of the population of circulating SARS-CoV-2 in Wales is different to that which was observed in March/April. The data point towards a number of insights relating to the impact of the lockdown and potential impact of restrictions such as the 5 mile rule. What seems clear from this and other data is that the easing of lockdown rules from July/August has corresponded with an increase in cases, with the genomic data suggesting that increases in Wales may partly be driven by imports from other parts of the UK and wider world.
Wales has generated an unprecedented amount of SARS-CoV-2 data, rapidly establishing a world class capacity in the area of SARS-CoV-2 genomics. The genomics data have been widely used to date, and have had an impact on the pandemic response at multiple levels within Wales and the wider UK. The data presented here - much of which is part of analyses that are ongoing - provide a number of pieces of information that should support policy and planning. Further analyses can and will be conducted to continue to seek to gain insight from the genomics data that can then be used to inform government and the NHS.
Funding
Welsh Government has provided substantial funding for COVID-19 genomic sequencing to Public Health Wales, through Genomics Partnership Wales.
The sequencing of COVID-19 samples from the other UK nations used in this analysis is funded by the COVID-19 Genomics Consortium (COG-UK). COG-UK also provides significant funding for sequencing samples from Wales.
COG-UK also provides analysis and data management tools that underpin and coordinate sequencing activities on a national level. COG-UK is funded by the MRC and NIHR.
Analysis of data is performed on computational hardware hosted by Cardiff University and the University of Birmingham as part of MRC CLIMB. MRC CLIMB is funded by the MRC (from grant MR/L015080/1 and from COG-UK) and Welsh Government, who have provided additional funding for the purchase of dedicated hardware for the processing and analysis of Welsh samples.
Sequencing method and basic sample handling
The majority of the graphs generated in this report derive from reporting tools that have been developed within PHW as part of the pandemic response and are due to be released as an R package in the near future.
The analysis of Welsh samples is built upon a sequencing process that runs within PHW and remotely as part of COG-UK.
Samples were received into PenGU, with residual diagnostic samples proceeding directly to reverse transcription and amplification. Samples that required re-extraction were extracted using the PerkinElmer Chemagic platform.
All samples were reverse-transcribed and then amplified using the ARTIC v3 primers and protocol [1,3]. Resulting amplicons were prepared for sequencing using Illumina Nextera XT library preparation kit and sequencing was performed on the Illumina NextSeq using the NextSeq Mid-output v2.5 sequencing kit (300 cycles).
For each sample, all sequences were quality trimmed using Trim-Galore v0.6.5 [4] and then aligned to the SARS-CoV-2 reference sequence (MN908947.3) using bwa v0.7.17 [4,5]. Once aligned, primer sequences were coordinate-trimmed and consensus fasta sequences generated using iVar v1.2.2 [6]. The complete pipeline has been developed as a nextflow workflow that is freely available online [7]. Consensus fasta sequences generated using the processing pipeline were submitted to the COVID-19 Genomics UK Consortium (COG-UK) analysis environment hosted on MRC CLIMB, and each sequence was assigned a global lineage [7,8]. Alongside this, to facilitate analyses of local outbreaks, a more granular “UK lineage” and “phylotype“ were assigned to each sample using a bespoke phylogenetic analysis pipeline also running on MRC CLIMB.
Further local analysis was undertaken within PHW to perform bespoke sequence alignment using Mafft [9] and the generation of phylogenetic trees using IQ-Tree [10]. Metadata was collated from a range of sources within PHW using Data-flo [11]. Internal analysis includes the visualisation of trees and samples on maps were using a MicroReact instance running within PHW.
The process for data management and analysis on COG-UK is detailed in a preprint [12], and the methods and other analysis results for the examination of D614G are also detailed in another preprint for that work [13].
For the analysis of imports included in this report, ancestral state reconstruction (ACCTRAN) was performed on a maximum likelihood phylogeny of 114,638 SARS-COV-2 genomes from England and Wales. 1,831 subtrees with a root state assigned to Wales were extracted with Python, and the first Welsh sample from each was counted. This method is based on a fast heuristic algorithm and may be sensitive to sampling bias; furthermore, model-based methods may provide better inferences (although require longer).
References
- Quick J. nCoV-2019 sequencing protocol. published on protocols.io 2020.
- The COVID-19 Genomics UK Consortium, An integrated national scale SARS-CoV-2 genomic surveillance network. The Lancet Microbe. 2020. pp. e99–e100.
- Connor TR, Loman NJ, Thompson S, Smith A, Southgate J, Poplawski R, et al. CLIMB (the Cloud Infrastructure for Microbial Bioinformatics): an online resource for the medical microbiology community. Microbial genomics. 2016;2.
- Babraham Bioinformatics - Trim Galore! Available: https://www.bioinformatics.babraham.ac.uk/projects/trim_galore/
- Li H. Aligning sequence reads, clone sequences and assembly contigs with BWA-MEM. 2013. Available: http://arxiv.org/abs/1303.3997
- Grubaugh ND, Gangavarapu K, Quick J, Matteson NL, De Jesus JG, Main BJ, et al. An amplicon-based sequencing framework for accurately measuring intrahost virus diversity using PrimalSeq and iVar. Genome Biol. 2019;20: 1–19.
- connor-lab. connor-lab/ncov2019-artic-nf. In: GitHub Available: https://github.com/connor-lab/ncov2019-artic-nf
- Rambaut A, Holmes EC, O’Toole Á, Hill V, McCrone JT, Ruis C, et al. A dynamic nomenclature proposal for SARS-CoV-2 lineages to assist genomic epidemiology . Nature Microbiology. 2020; 1–5.
- Katoh K, Standley DM. MAFFT multiple sequence alignment software version 7: improvements in performance and usability. Mol Biol Evol. 2013;30: 772–780.
- Minh BQ, Schmidt HA, Chernomor O, Schrempf D, Woodhams MD, von Haeseler A, et al. IQ-TREE 2: New Models and Efficient Methods for Phylogenetic Inference in the Genomic Era. Mol Biol Evol. 2020;37: 1530–1534.
- Data-flo - Data-flo. Available: https://data-flo.io/
- Nicholls SM, Poplawski R, Bull MJ, Underwood A, Chapman M, Abu-Dahab K, Taylor B, Jackson B, Rey S, Amato R, Livett R, Gonçalves S, Harrison EM, Peacock SJ, Aanensen DM, Rambaut A, Connor TR, Loman NJ on behalf of The COVID-19 Genomics UK (COG-UK) Consortium. MAJORA: Continuous integration supporting decentralised sequencing for SARS-CoV-2 genomic surveillance bioRxiv 2020.10.06.328328; doi: https://doi.org/10.1101/2020.10.06.328328
- Volz EM, Hill V, McCrone JT, Price A, Jorgensen D, O'Toole A, Southgate JA, Johnson R, Jackson B, Nascimento FF, Rey SM, Nicholls SM, Colquhoun RM, da Silva Filipe A, Shepherd JG, Pascall DJ, Shah R, Jesudason N, Li K, Jarrett R, Pacchiarini N, Bull MJ, Geidelberg L, Siveroni I, Goodfellow IG, Loman NJ, Pybus O, Robertson DL, Thomson EC, Rambaut A, Connor TR, on behalf of The COVID-19 Genomics UK Consortium. Evaluating the effects of SARS-CoV-2 Spike mutation D614G on transmissibility and pathogenicity. medRxiv 2020.07.31.20166082; doi: https://doi.org/10.1101/2020.07.31.20166082
Authors
Report prepared by Thomas Connor (1, 2) with contributions and analysis from (alphabetical order) Stephen Attwood (1), Matt Bull (1), Amy Gaskin (1), Nicole Pacchiarini (1), Sara Rey (1), Joel Southgate (1)
1. Bioinformatics team, Public Health Wales Pathogen Genomics Unit
2. Cardiff University School of Biosciences