Relative income poverty: April 2019 to March 2020
For the period up to March 2020, households with an income less than 60% of the UK median, analysed by attributes such as age, economic status and family type.
In this page
What is relative income poverty?
We define a person to be living in relative income poverty if they live in a household where the total household income from all sources is less than 60% of the average UK household income (as given by the median). All figures in this report relate to relative income poverty in Wales after housing costs such as mortgage interest payments/rent, water rates and structural house insurance were paid.
The data we have for relative income poverty comes from the Households Below Average Income (HBAI) report published by the Department of Work and Pensions (DWP).
These figures are based on results from the Family Resources Survey (FRS) which currently has a relatively small sample for Wales. This is why data are presented as 3 to 5 year rolling averages, to reduce (but not eliminate) unreliability.
More information on the definition of relative income poverty can be found on the Relative income poverty series page.
Main findings
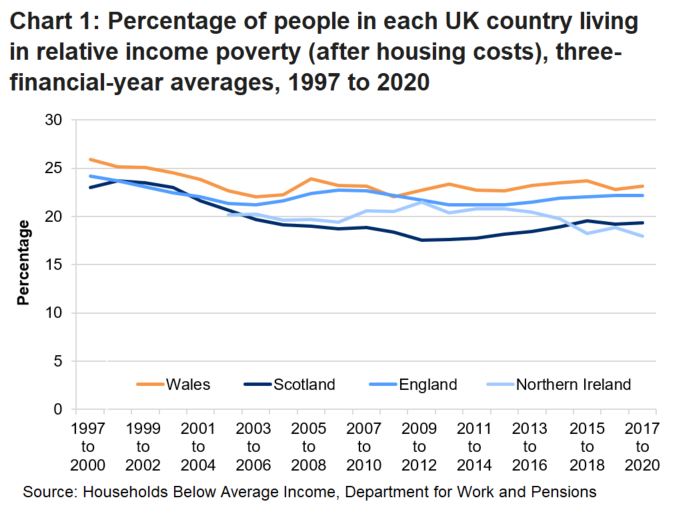
- Between 2017-18 and 2019-20, 23% of all people in Wales were living in relative income poverty.
- The percentage of people living in relative income poverty has been relatively stable in Wales for over 15 years.
- In England the percentage of people living in relative income poverty was 22% between 2017 and 2020; in Scotland and Northern Ireland the figures were 19% and 18% respectively. (chart 1)
Children in relative income poverty
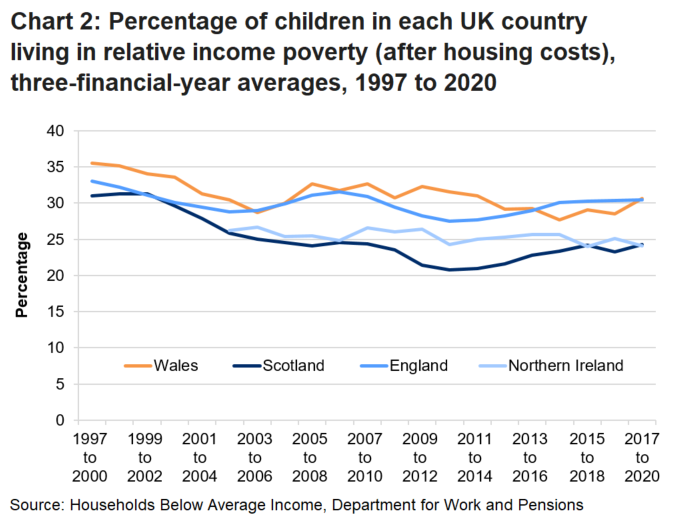
- In Wales, 31% of children were living in relative income poverty in 2017 to 2020. This figure has increased from 28% reported last year and is a 2 percentage point increase based on the unrounded data. However, please take care when interpreting change over the short term because trends can be volatile due to small sample sizes.
- In England the percentage of children living in relative income poverty was 30% between 2017 and 2020. Although this is slightly lower than the rounded figure for Wales the difference is less than 0.2 percentage points on unrounded data. In Scotland and Northern Ireland the figure was 24%. (chart 2)
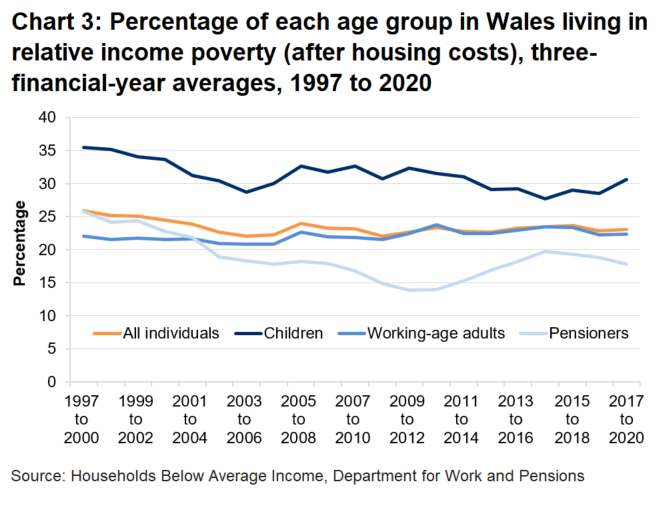
- Children are consistently the age group most likely to be in relative income poverty; this is true across all four UK nations. A possible reason for this is that adults with children are more likely to be out of work or working fewer hours due to childcare responsibilities. (chart 3)
Working-age adults in relative income poverty
- Relative income poverty for working-age adults remains steady in Wales but is still above that seen for other UK countries.
- Between 2017 and 2020, 22% of working-age adults in Wales were living in relative income poverty.
Pensioners in relative income poverty
- The percentage of pensioners in relative income poverty fell by 1 percentage point for the second consecutive period following a gradual rise since around 2013.
- 18% of pensioners in Wales were living in relative income poverty between 2017 and 2020.
Housing tenure
Chart 4 shows that people in social rented housing were more likely to be in relative income poverty (at 48%) than those in private rented (41%) or owner occupied housing (13%). However, when considering all people in Wales in poverty (710,000), most people lived in owner occupied housing (39%) followed by those living in social rented housing (32%).

Economic status and type of employment
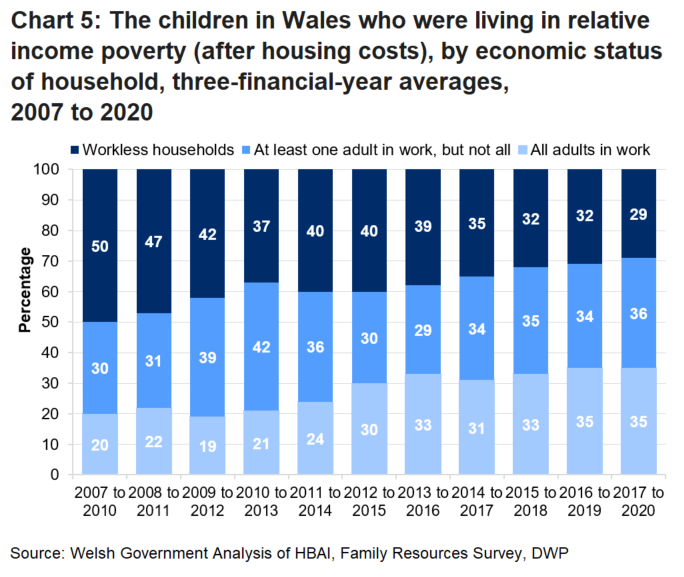
73% of children living in a workless household were in relative income poverty compared to 25% living in a working household in 2017 to 2020. Within working households, there was also a marked difference between the likelihood of poverty for children in households where all the adults work (17%) compared to households where some (but not all) adults work (45%).
In the most recent period, 71% of children who were living in relative income poverty lived in working households (around 140,000 children). This has increased for the last five periods from 60% in the period 2012 to 2015. In addition, about the same proportion of children living in relative income poverty lived in households where all adults were working compared with where one adult but not all adults were working (chart 5).
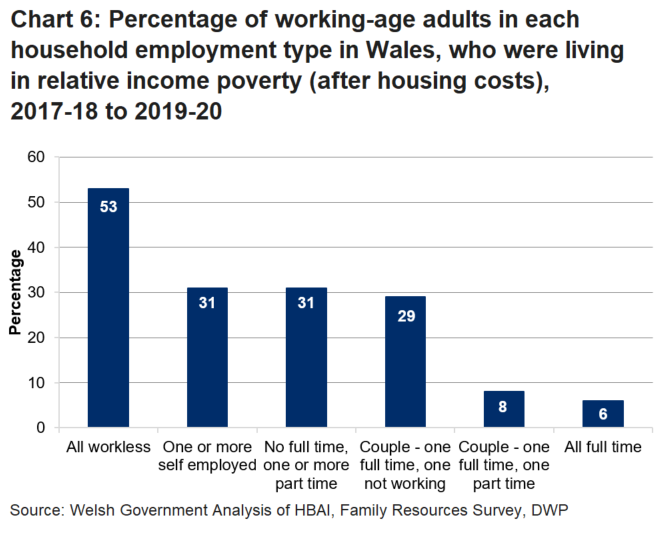
As shown in chart 6, around half of working-age people living in workless households lived in poverty in 2017 to 2020. Living with people who work reduces the likelihood of poverty. This risk is especially reduced where all adults work full time. However, there were still an estimated 40,000 working-age adults in relative income poverty despite living in households where everyone worked full-time.
Family characteristics
Chart 7 shows that in the period 2017 to 2020:
- lone parent households were the family type most likely to be in relative income poverty (at 46%)
- 30% of people in single female households with no children lived in relative income poverty
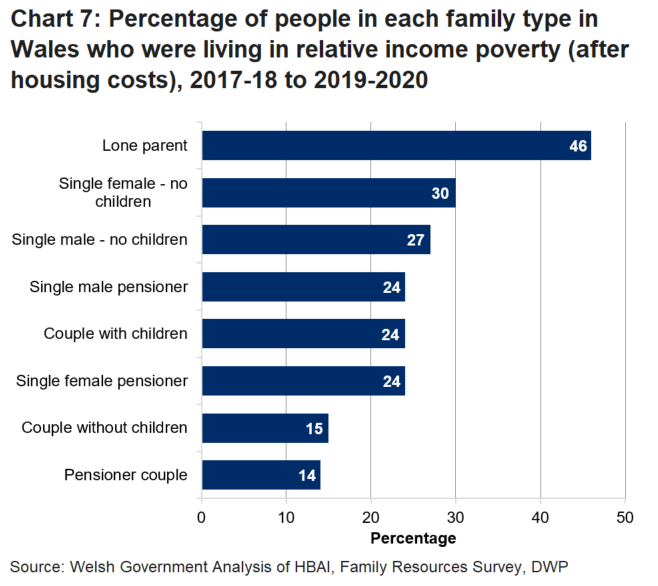
Around 60,000 of children (46%) who lived in lone parent families lived in relative income poverty in the latest period, 2017 to 2020.
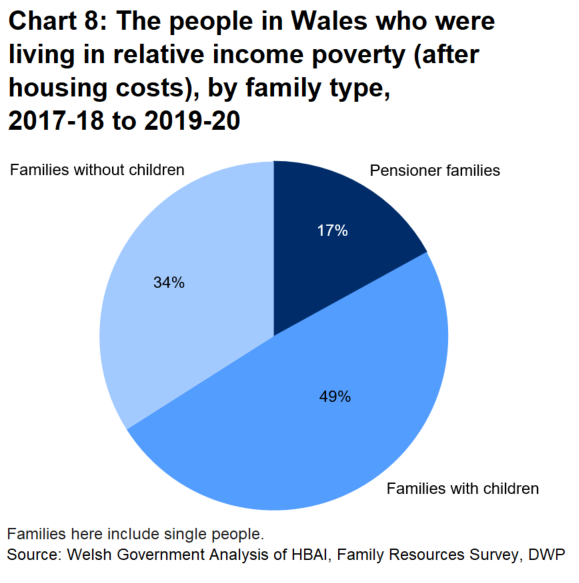
What type of families live in poverty?
In the past, most people living in relative income poverty were living in households with children. However, the pattern is now less clear with a similar proportion of those living in relative income poverty living in households with children and without children (see chart 8).
Children who lived in households where the youngest child was aged 0 to 4 accounted for half of all children that were in relative income poverty in 2017 to 2020.
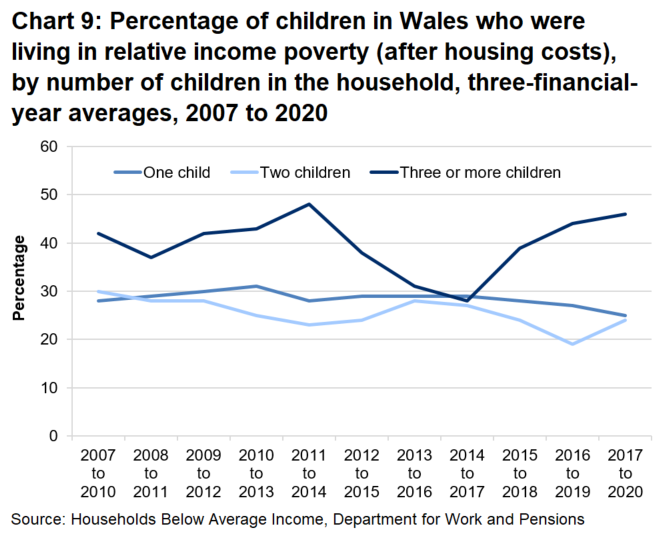
As shown in Chart 9, children who lived in households where there were three or more children were nearly twice as likely to live in relative income poverty between 2017 and 2020, compared with those who lived in households with two children.
Ethnicity
Non-white ethnicity is linked with a greater likelihood of relative income poverty.
For the period 2015-16 to 2019-20 (an average of 5 financial years) there was a 29% likelihood of people whose head of household comes from a non-white ethnic group living in relative income poverty. This compares to a 24% likelihood for those whose head of household comes from a white ethnic group. However, because the vast majority of households in Wales have a head who is from a white ethnic group, most people (97%) who were living in relative income poverty were from such households.
We were not able to produce robust figures for children or pensioners by ethnic group of head of household due to low sample sizes. For UK data by ethnic group (including further breakdowns by ethnicity) please see the HBAI tables produced by the Department for Work and Pensions.
Disability
In the survey data, disabled people are identified as those who report any physical or mental health condition or illness that are expected to last 12 months or more, and which limit their ability to carry out day-to-day activities a little, or a lot. This is in line with the Equality Act definition.
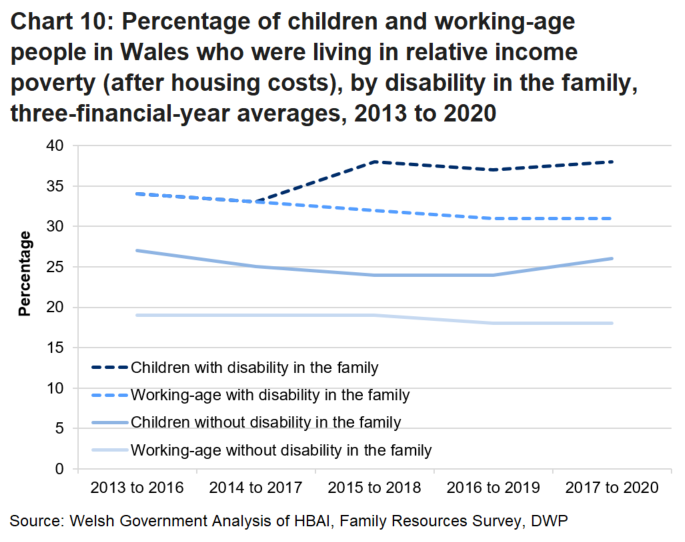
Living with a person who has a disability makes relative income poverty more likely for children and working age people. In the latest period (2017-18 to 2019-20):
- 38% of children who lived in a family where there was someone with a disability were in relative income poverty compared with 26% of those in families where no-one was disabled
- for working-age adults, 31% who lived in a family where there was someone with a disability were in relative income poverty compared with 18% of those in families where no-one was disabled
Quality and methodology information
Summary information on what to keep in mind when interpreting these statistics can be found on the Relative income poverty series page.
It’s important to remember that these figures are based on results from the Family Resources Survey (FRS) which is based on a small sample for Wales (around 900 households every year). We advise caution when looking at year on year changes as these are unlikely to be statistically significant. For more detailed methodological information go to the Relative income poverty: methodology page.
National Statistics status
The United Kingdom Statistics Authority has designated these statistics as National Statistics, in accordance with the Statistics and Registration Service Act 2007 and signifying compliance with the Code of Practice for Statistics.
National Statistics status means that official statistics meet the highest standards of trustworthiness, quality and public value.
All official statistics should comply with all aspects of the Code of Practice for Statistics. They are awarded National Statistics status following an assessment by the UK Statistics Authority’s regulatory arm. The Authority considers whether the statistics meet the highest standards of Code compliance, including the value they add to public decisions and debate.
The data we have for relative income poverty comes from the Households Below Average Income (HBAI) report published by the Department of Work and Pensions (DWP). Since the latest review by the Office for Statistics Regulation, DWP have continued to comply with the Code of Practice for Statistics, and have made a number of improvements. For more information please refer to the latest HBAI report on the GOV.UK website.
Well-being of Future Generations Act (WFG)
The Well-being of Future Generations Act 2015 is about improving the social, economic, environmental and cultural wellbeing of Wales. The Act puts in place seven wellbeing goals for Wales. These are for a more equal, prosperous, resilient, healthier and globally responsible Wales, with cohesive communities and a vibrant culture and thriving Welsh language. Under section (10)(1) of the Act, the Welsh Ministers must (a) publish indicators (“national indicators”) that must be applied for the purpose of measuring progress towards the achievement of the Well-being goals, and (b) lay a copy of the national indicators before Senedd Cymru. The 46 national indicators were laid in March 2016 and this release includes one of the national indicators:
(18) Percentage of people living in households in income poverty relative to the UK median: measured for children, working age and those of pension age.
Information on the indicators, along with narratives for each of the wellbeing goals and associated technical information is available in the Well-being of Wales report.
Further information on the Well-being of Future Generations (Wales) Act 2015.
The statistics included in this release could also provide supporting narrative to the national indicators and be used by public services boards in relation to their local wellbeing assessments and local wellbeing plans.
Contact details
Statistician: Samantha Collins
Telephone: 0300 025 7371
Email: stats.inclusion@gov.wales
Media: 0300 025 8099
SFR 92/2021