NHS activity and performance summary: September and October 2022
Report summarising data on activity and performance in the Welsh NHS for September and October 2022.
In this page
Introduction
Data for each topic area is also available in more detail on our StatsWales website.
In light of the impact COVID-19 has had on NHS activity and performance levels, the Welsh Government has published its programme for transforming and modernising planned care and reducing waiting lists in Wales. This plan sets out a number of key ambitions to reduce waiting times for people in Wales. We have incorporated these measurements of performance against these ambitions into this statistical release and on StatsWales.
Main points
In October a total of 81,887 calls were made to the 111 helpline service. Of these, almost 66,400 calls were answered. This is an increase of 13.6% compared to the previous month. There were also almost 406,000 hits on the NHS 111 Wales website and just over 18,400 completed symptom checks (NHS 111 Wales).
In October there were 4,545 red (life threatening) calls to the ambulance service, 12.1% of all calls. This was the highest number of red calls made in a month, and on average almost 150 immediately life-threatening calls made each day.
48.0% of red calls received an emergency response within 8 minutes, 2.0 percentage points lower than the previous month and the lowest on record. Data for red calls are only comparable from May 2019 onwards.
There was an average of 2,949 daily attendances to emergency departments, a similar level of activity compared with the previous month. Performance decreased against the four hour and twelve hour targets, both remaining low in historical context, with the 12 hour target the second worst on record. The average (median) time spent in emergency departments is similar in October to the previous month and remains high at two hours and fifty-three minutes.
The pandemic has caused a large increase in patient pathways waiting to start treatment, and in September lists continued to increase, to almost 755,000. The number of patient pathways is not the same as the number of individual patients, because some people have multiple open pathways. More information is available in the Welsh Government’s Chief Statistician’s blog.
New management information suggests that in September 2022, when there were almost 755,000 open patient pathways, there were around 590,000 individual patients on treatment waiting lists in Wales. This was an increase of about 2,100 patients from the previous month.
September saw just over 99,000 patient pathways closed, back to pre-pandemic levels.
The proportion of patient pathways waiting less than 26 weeks remained 54.8% in September, the same level as in August. This has been relatively stable for some time after falling significantly from the levels pre-pandemic. The number of pathways waiting longer than 36 weeks decreased in September but remains the fourth highest level on record at over 263,000.
Over 57,000 pathways were waiting more than two years, though this fell for the sixth consecutive month following a consistent increase over the previous year. The average (median) time patient pathways had been waiting for treatment at the end of September decreased slightly on the previous month to 21.8 weeks.
In September, the number of pathways waiting longer than one year for their first outpatient appointment decreased to around 100,000, falling from the highest on record in August.
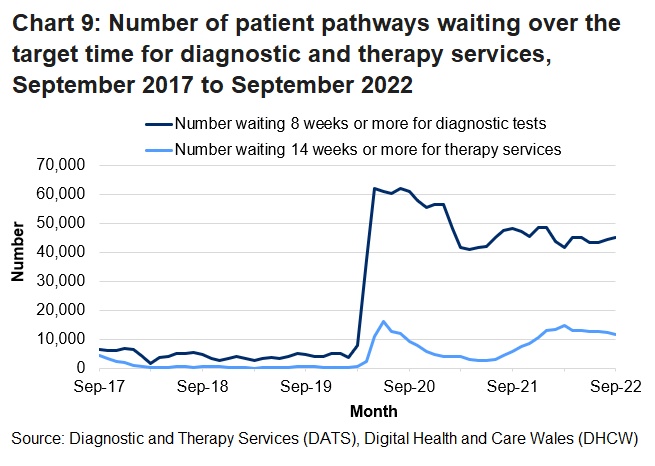
For diagnostic services, the number of patient pathways waiting increased to just over 109,000 in September. The number of patient pathways waiting longer than 8 weeks (the target maximum wait) increased to just over 45,000, in September.
For therapies, the number of patient pathways waiting increased to over 68,000 in September, and is the highest level on record. The number waiting longer than fourteen weeks (the target maximum wait) decreased to just over 11,600, falling for the sixth consecutive month.
For cancer services, slightly fewer people started their first definitive treatment in September (1,657), but more pathways were closed following the patient being informed they did not have cancer (13,856) than in the previous month. Performance increased slightly against the 62 day target in September to 53.3% compared to 52.5% the previous month, but is still the second lowest since current data collections began.
Unscheduled care
New data relating to unscheduled care are provided for the month of October 2022.
Calls to 111 service
As of 16 March 2022, the non-emergency 111 helpline service has been rolled out across the whole of Wales.
In October, a total of 81,887 calls were made to the 111 helpline service. Of these, almost 66,400 (81%) calls were answered by the 111 service in Wales, an average of around 2,140 calls per day. This is an increase of 13.6% compared to the previous month.
An estimated 15,488 (19%) calls were ended by the caller before being answered. Of these, 3,800 were ended within 60 seconds of the automated messages, suggesting their needs were likely to have been met.
Over 11,600 calls were abandoned after 60 seconds and these are regarded as callers who were more likely to have still required the service after the messages, but were unable to get through or decided not to wait. This is a proportion of 75.5% of the total abandoned calls and this proportion has increased in comparison with the previous month.
Of the calls answered, over 1,200 calls indicated that they wished to conduct the call in Welsh. This number has been relatively stable since recording began.
There were almost 406,000 hits on the NHS 111 Wales website and almost 18,500 completed symptom checks (NHS 111 Wales) in October.
More data is published on StatsWales.
Emergency calls to the ambulance service
A wider range of ambulance quality indicators are published on the Emergency Ambulance Services Committee (EASC) website and on StatsWales.
Activity
Emergency ambulance calls and responses to red calls, by local health board and month on StatsWales
Note: An update to call handling in May 2019 resulted in a change to red incident volume. It is not possible to directly compare before and after this date. Further details are available in the quality information.
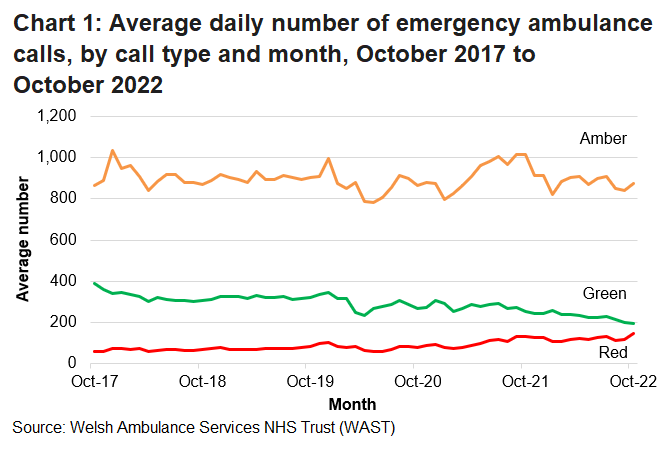
In October, over 37,500 emergency calls were made to the ambulance service. This was an average of 1,213 calls per day, and increase of 52 (4.5%) calls on average per day than the previous month, but 188 (13.4%) fewer calls on average per day than the same month last year.
Calls to the ambulance service are categorised as red (immediately life-threatening), amber (serious but not life-threatening) or green (non-urgent). An average of 147 red calls were made per day in October. This was the highest number on record and the seventeenth month in a row where on average there were more than 100 immediately life-threatening calls made each day since the change to call handling procedures in May 2019 which impacted on the comparability of the time series.
In October, the proportion of all calls that were immediately life-threatening was 12.1%, up from 10.2% in the previous month.
Performance
Target
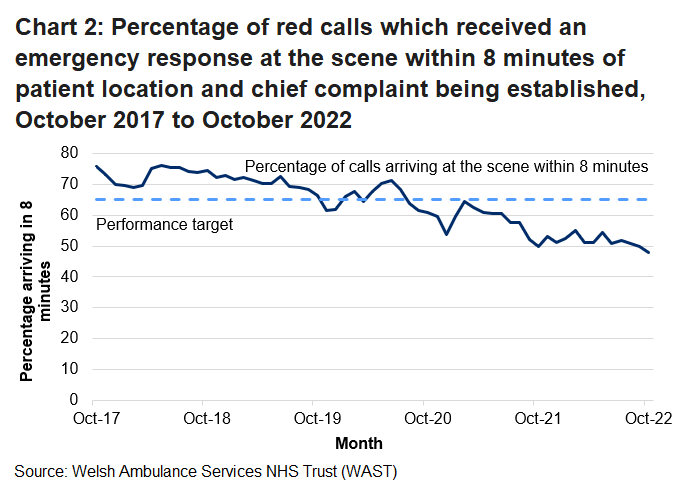
- 65% of red calls (immediately life-threatening; someone is in imminent danger of death, such as a cardiac arrest) to have a response within 8 minutes.
Note: An update to call handling in May 2019 resulted in a change to red incident volume. It is not possible to directly compare before and after this date. Further details are available in the quality information.
In October, 48.0% of emergency responses to immediately life threatening (red) calls arrived within 8 minutes, the lowest on record. This was 2.0 percentage points lower than the previous month, and 0.1 percentage points lower than in October 2021.
The median response time in the four years prior to the pandemic ranged between 4 minutes 30 seconds and 6 minutes for red calls. In October, the average (median) response time to immediately life-threatening ‘red’ calls was 8 minutes and 18 seconds. This was 18 seconds slower than the previous month and 17 seconds slower than October 2021.
The majority of calls to the ambulance service are categorised as ‘amber’ calls, for which there is no performance target for call response times. In October, the median response time for amber calls was just over 1 hour and 48 minutes. This was almost 13 minutes slower than in September and over 3 minutes quicker than in October 2021.
Emergency department attendances and admissions to hospital
A wider range of emergency department performance statistics are published on the National Collaborative Commissioning Unit (NCCU) website, as management information.
Activity
Number of attendances in NHS Wales emergency departments by age band, sex and site on StatsWales
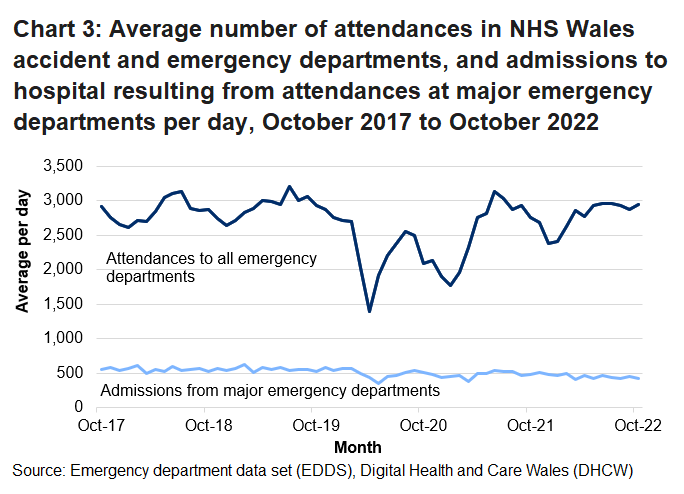
Note: Chart shows number of attendances at both major emergency departments and minor injuries units, and the number of admissions resulting from attending major emergency departments only.
In October there were over 91,000 attendances to all NHS Wales emergency departments. This was an average of 2,949 emergency department attendances per day; 70 attendances more per day on average than in the previous month.
In October, over 14,000 patients were admitted to the same or a different hospital following attendance at a major emergency department. This was 27.1% higher than the previous month but 8.6% lower than the same month in 2021.
Performance
Targets
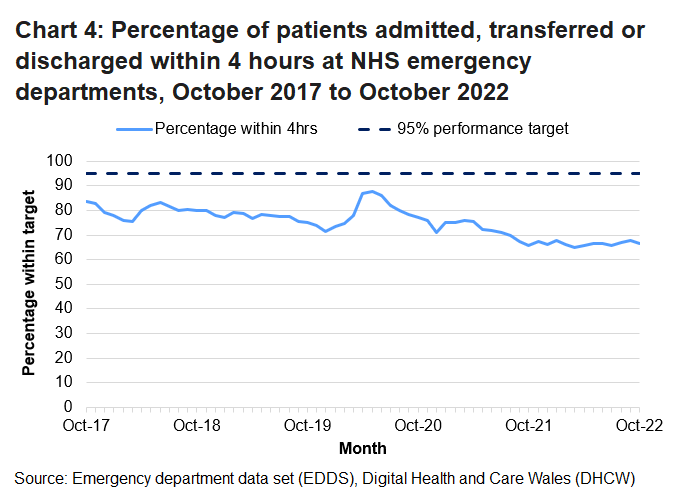
- 95% of new patients should spend less than 4 hours in emergency departments from arrival until admission, transfer or discharge.
- No patient waiting more than 12 hours in emergency departments from arrival until admission, transfer or discharge.
Performance against 4 hour target by hospital on StatsWales
In October, 66.6% of patients in all NHS emergency departments spent less than 4 hours in the department from arrival until admission, transfer or discharge. This was 1.4 percentage points lower than the previous month.
In 2019, the median time patients spent in emergency departments was around 2 hours and 30 minutes. During the early part of the pandemic, as attendances decreased the median time spent in the department decreased, to a low of 1 hours 47 minutes in April 2020. Since then, median times have increased and reached a record high of 3 hours and 8 minutes in March 2022. In the latest data for October, the median waiting time was 2 hours and 53 minutes, high in historical context but one minutes faster than the previous month.
The median time spent in emergency department varies by age. Prior to the pandemic, children (aged 0 to 4) spent between 1 hour and 30 minutes and 2 hours in emergency departments, while older patients (aged 85 or greater) spent between 3 hours and 30 minutes and 5 hours.
In October, children (aged 0 to 4) spent an average of 2 hours and 20 minutes. Adults aged 85 and over spent an average of 7 hours and 10 minutes in emergency departments.
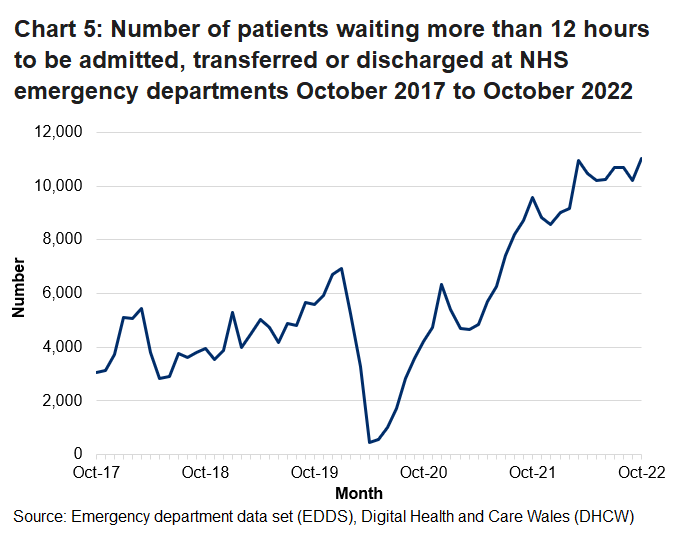
Performance against the 12 hour target by hospital on StatsWales
In October there were 11,030 patients waiting 12 hours or more. This was 819 (8.0%) more than in the previous month and the highest on record.
Scheduled care activity
New data relating to unscheduled care are provided for the month of August 2022.
Outpatient referrals and appointments
Activity
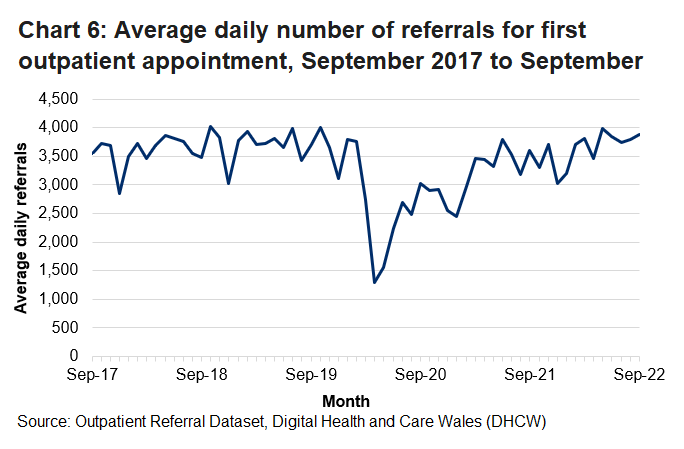
Outpatient referrals on StatsWales
An average of 3,886 referrals for first outpatient appointments were made per day in September. This is an increase of 2.3% (87 more referrals per day on average) compared to August.
Performance
Targets
- No one waiting for longer than a year for their first outpatient appointment by the end of 2022 (new target established in the planned care recovery plan).
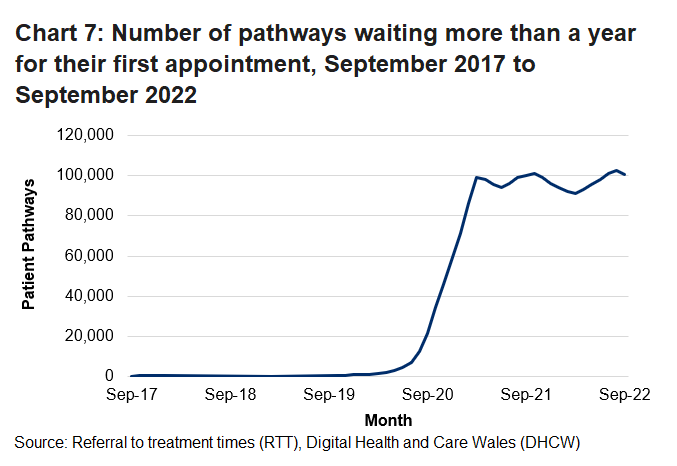
Referral to treatment on StatsWales
In September, the number of pathways waiting longer than one year for their first outpatient appointment decreased to around 100,000, but is still the fourth highest number on record. Pathways waiting longer than one year for a first outpatient appointment increased dramatically over the course of the pandemic.
Diagnostic and therapy waiting times
Activity
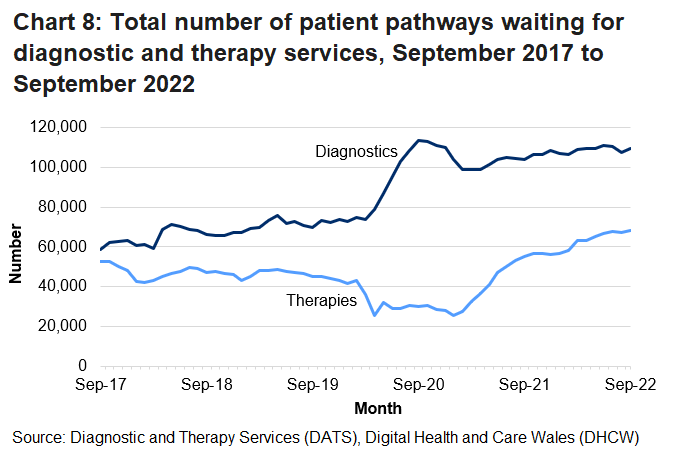
Diagnostic and Therapy Services Waiting Times by week on StatsWales
Note: The low point in April 2020 for therapies is in part due to Betsi Cadwaladr not submitting data for this month, please see the quality information.
In September there were over 109,000 patient pathways waiting for diagnostics, an increase of 2.0% compared with the previous month. There were just over 68,000 patient pathways waiting for therapies, an increase of 0.9% compared to the previous month. This is the highest level on record.
Performance
Targets
- The maximum wait for access to specified diagnostic tests is 8 weeks.
- The maximum wait for access to specified therapy services is 14 weeks.
- The planned care recovery plan established a target date of Spring 2024 to reach these targets.
Diagnostic and Therapy Services Waiting Times by week on StatsWales
Note: Betsi Cadwaladr did not submit data for April 2020, so are not included in the Wales figures for this month.
At the end of September, about 45,000 patient pathways were waiting longer than the target time for diagnostics. This was an increase of 1.2% compared to the previous month.
At the end of September there were just over 11,600 patient pathways waiting longer than the target time for therapies. This was a decrease of 5.9% compared to the previous month and falling for the sixth consecutive month.
Median waiting times had been relatively stable for diagnostic tests since 2017 (2.8 weeks on average) and for therapy services since 2018 (3.6 weeks on average). Median waiting times for both services peaked in 2020 (14.3 weeks for diagnostics and 14.9 weeks for therapies).
In September, the median waiting time for diagnostic tests was 5.8 weeks, compared to 6.0 in the previous month. The median waiting time for therapy services was 5.9 weeks, compared to 6.0 in the previous month.
Referral to treatment time
Referral to treatment time statistics show monthly data on waiting times for both open and closed pathways following a referral by a GP or other medical practitioner to hospital for treatment in the NHS. Open pathways are those that remain on the waiting list for treatment, whereas closed pathways are those taken off the waiting list.
Activity is measured by patient pathways, which differs to the number of patients. More information on this difference is available in the Welsh Government’s Chief Statisticians blog.
Also published is newly collected management information for the number of individual patients on treatment waiting lists in Wales.
Performance
Targets
- No patients waiting longer than two years in most specialities by March 2023, and no patients waiting longer than one year in most specialities by Spring 2025 (new targets established in the planned care recovery plan).
- 95% of patients waiting less than 26 weeks from referral.
- No patients waiting more than 36 weeks for treatment from referral.
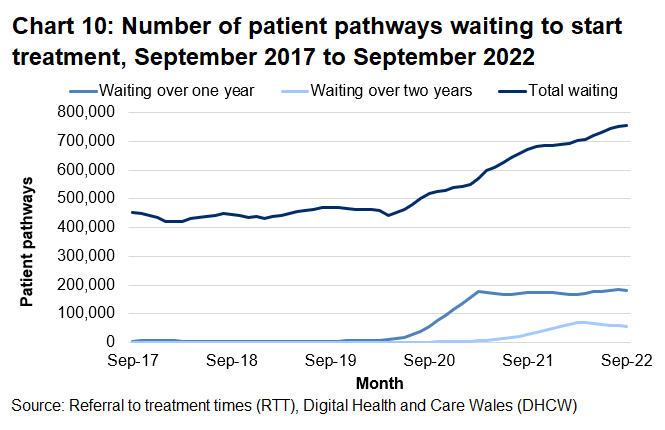
In September there were almost 755,000 patient pathways waiting to start treatment, the highest since comparable data was first collected in 2011. This was 0.6% higher than in the previous month and 62.9% higher than February 2020.
Over 181,000 pathways were waiting more than one year in September. This was a decrease compared to the previous month, though it has been relatively stable since Spring 2021. Over 57,000 pathways were waiting more than two years, following a sixth consecutive monthly fall after a consistent increase over the previous year.
The number of patient pathways is not the same as the number of individual patients, because some people have multiple open pathways.
We do not have official statistics on the number of individual patients waiting to start treatment. However, newly collected management information suggests that in September, when the National Statistics (above) reported there were over 755,000 open patient pathways, there were estimated to be over 590,000 individual patients on treatment waiting lists in Wales. This was an increase of about 2,100 patients from the previous month.
Unlike the National Statistics elsewhere in this release, which have been independently assessed against the Code of Practice for statistics, this estimate is based on newly collected management information. Whilst the principles of the Code of Practice have been applied, quality assurance is not to the level of the National Statistics. Work is ongoing to further understand the strengths and limitations of this data and this will be communicated as we learn more. For these reasons there is greater uncertainty around this estimate than with the other figures in this release. However, the level of public interest in understanding the number of patients in addition to the number of patient pathways adds sufficient value to warrant making this available now.
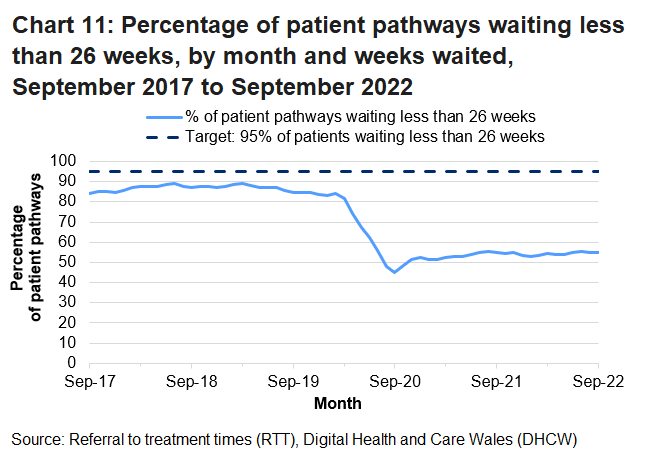
Of the almost 755,000 patient pathways waiting to start treatment, by the end of September, 54.8% had been waiting less than 26 weeks. This was the same level as the previous month and 29.5 percentage points lower than February 2020.
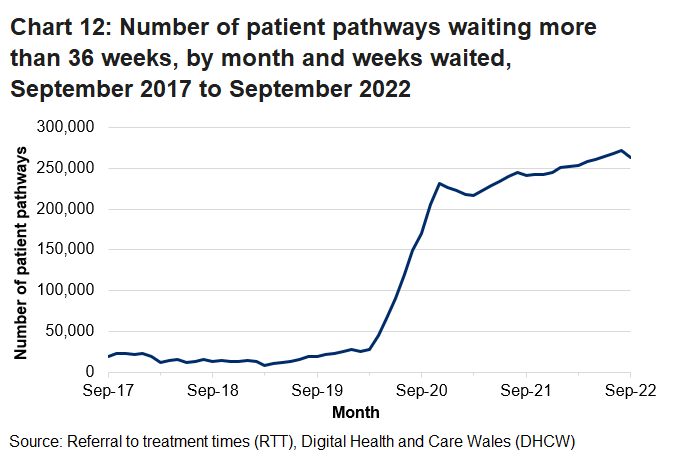
In September over 263,000 patient pathways had been waiting more than 36 weeks. This represented 34.9% of all patient pathways waiting to start treatment. This was 7,445 (or 2.7%) fewer than in the previous month but still the fourth highest figure on record.
The median time waiting to start treatment had generally been around 10 weeks pre pandemic between late 2013 and February 2020. This increased during the pandemic and peaked at a record high of 29 weeks in October 2020. In September, the median waiting time was 21.8 weeks, which was a decrease from 22.1 weeks in the previous month.
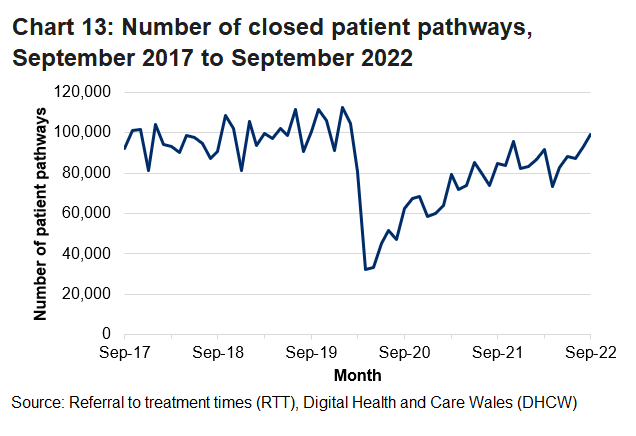
Closed patient pathways by month, local health board and weeks waiting on StatsWales
Note: Data revised to now include Cwm Taf Morgannwg health board closed pathways. Up to the July 2022 statistical release, the data series was not available for Cwm Tag Morgannwg. More details are available in the quality information.
The number of patient pathways closed in September was just over 99,000. This was an average of 4,502 patient pathways closed per working day. This was an increase of 10.9% from the previous month and the highest since February 2020 (pre-pandemic).
Cancer services
Experimental statistics (ONS) are official statistics that are in the testing phase and not yet fully developed.
These statistics were previously labelled as experimental (ONS). Following a review of methods, quality and utility we have now removed the experimental label and from November 2022 these are official statistics (UKSA).
A number of wider measures from the suspected cancer pathway are produced by Digital Health and Care Wales are published alongside this statistical release.
Activity
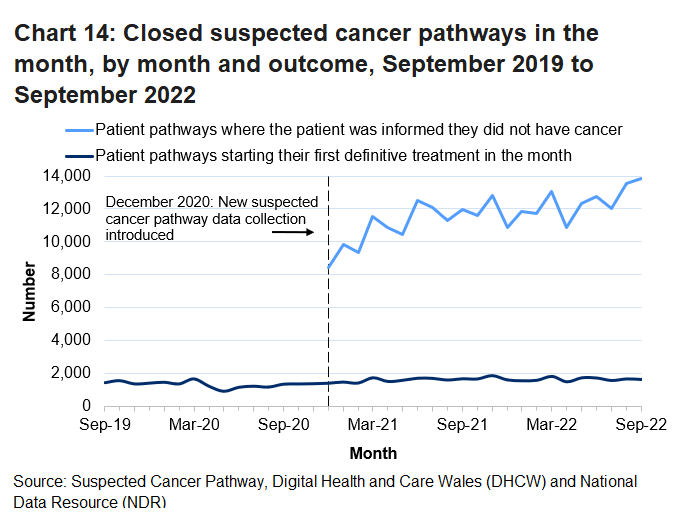
Suspected cancer pathway (closed pathways) on StatsWales
In September 1,657 pathways where the patient was newly diagnosed with cancer started their first definitive treatment in the month. This was a decrease of 2.0% compared to the previous month.
13,856 pathways were closed following the patient being informed they did not have cancer. This is an increase of 2.4% compared to the previous month and the highest level on record.
In September, 15,806 patient pathways were opened in the month following a new suspicion of cancer. This was a decrease of 584 (3.6%) on the previous month.
Performance
Target
- At least 75% of patients should start treatment within 62 days (without suspensions) of first being suspected of cancer. Data published for time periods before December 2020 are not subject to the target.
- The planned care recovery plan established a new target of 80%, to be reached by 2026.
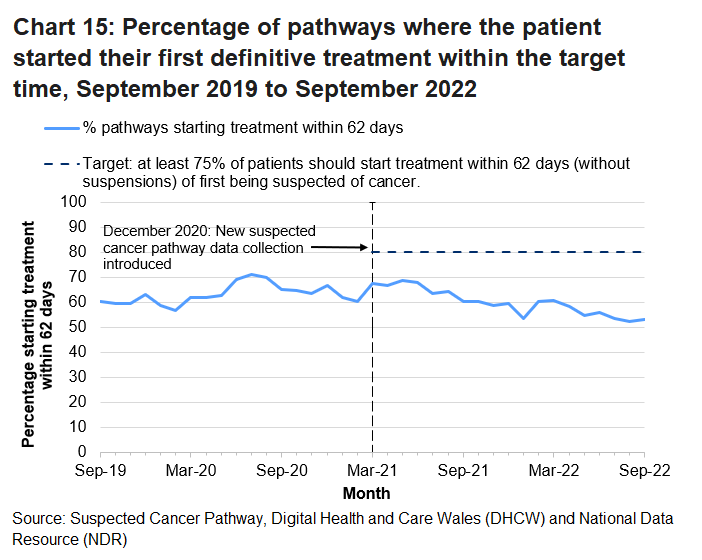
Suspected cancer pathway (closed pathways) on StatsWales
In September, 53.3% (883 out of 1,657) of pathways started their first definitive treatment within 62 days of first being suspected of cancer. This was 0.8 percentage points higher than the previous month, but 7.2 percentage points lower than September 2021 and is the second lowest figure since the current data series began.
Quality and methodology information
All quality and methodology information in relation to this statistical release can be found in the NHS activity and performance summary: quality report
Well-being of Future Generations Act (WFG)
The Well-being of Future Generations Act 2015 is about improving the social, economic, environmental and cultural wellbeing of Wales. The Act puts in place seven wellbeing goals for Wales. These are for a more equal, prosperous, resilient, healthier and globally responsible Wales, with cohesive communities and a vibrant culture and thriving Welsh language. Under section (10)(1) of the Act, the Welsh Ministers must (a) publish indicators (“national indicators”) that must be applied for the purpose of measuring progress towards the achievement of the wellbeing goals, and (b) lay a copy of the national indicators before Senedd Cymru. Under section 10(8) of the Well-being of Future Generations Act, where the Welsh Ministers revise the national indicators, they must as soon as reasonably practicable (a) publish the indicators as revised and (b) lay a copy of them before the Senedd. These national indicators were laid before the Senedd in 2021. The indicators laid on 14 December 2021 replace the set laid on 16 March 2016.
Information on the indicators, along with narratives for each of the wellbeing goals and associated technical information is available in the Wellbeing of Wales report.
Further information on the Well-being of Future Generations (Wales) Act 2015.
The statistics included in this release could also provide supporting narrative to the national indicators and be used by public services boards in relation to their local wellbeing assessments and local wellbeing plans.
We want your feedback
We welcome any feedback on any aspect of these statistics which can be provided by email to stats.healthinfo@gov.wales.
Next update
22 December 2022