NHS activity and performance summary: February and March 2022
Report summarising data on activity and performance in the Welsh NHS for February and March 2022.
This file may not be fully accessible.
In this page
Introduction
Data for each topic area is also available in more detail on our StatsWales website and on our interactive dashboard.
As of 16 March, the 111 service has been rolled out across the whole of Wales. In May’s statistical release, we will publish data on the 111 service for April 2022. This will include data on calls offered, answered, and abandoned. These data will primarily be published on StatsWales.
Main points
Latest data for March shows that on average more calls were made to the ambulance service per day than the previous month. The number, and proportion, of life threatening calls remains high and the performance target continues not to be met.
There was a sharp increase in average daily attendances to emergency departments in March, to the highest level since September 2021. With the lowest performance on record against both the four and twelve hour targets. The average (median) time spent in emergency departments also reached the longest on record, at three hours and eight minutes.
The number of patient pathways waiting, those waiting longer than the target time and average waiting times for diagnostic services all decreased in February.
For therapies, the number of patient pathways waiting and those waiting longer than the target time for increased to the highest level on record in February. However, the average waiting time decreased for the first time since March 2021.
The pandemic has impacted on the total number of patient pathways waiting to start treatment and this continued to increase in February. However, the rate of increase remains much lower than earlier in the pandemic, and was again the second slowest rate of increase since the start of the pandemic. This is in part due to the second highest number of pathways closed per working day since the start of the pandemic.
The percentage of the total patient pathways that were waiting less than 26 weeks increased on the previous month. The number of pathways waiting longer than 36 weeks increased to the highest number on record, but at the slowest rate of increase since September 2021.
The average (median) time patient pathways had been waiting for treatment at the end of February remains high but decreased on the previous month to just under 23 weeks.
The latest data for cancer services shows an increase in both activity levels and performance against the 62 day target on the previous month.
Unscheduled care
New data relating to unscheduled care are provided for the month of March 2022.
Emergency calls to the ambulance service
Activity
Emergency ambulance calls and responses to red calls, by local health board and month on StatsWales
Note: An update to call handling in May 2019 resulted in a change to red incident volume. It is not possible to directly compare before and after this date. Further details are available in the quality and methodology information.
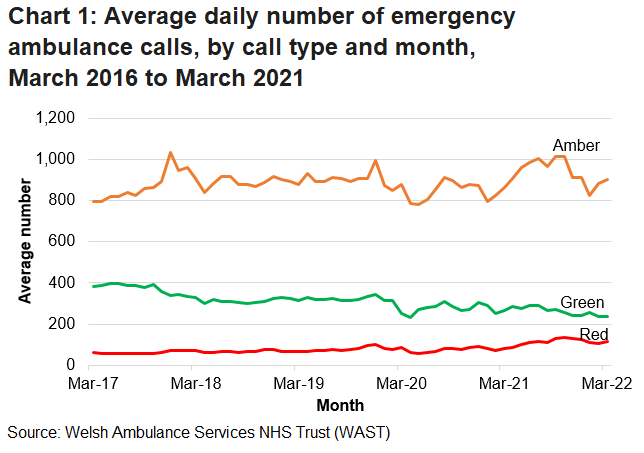
In March, almost 39,000 emergency calls were made to the ambulance service. This is an average of 1,256 calls per day, an increase of 28 (2.3%) calls on average per day than the previous month and 47 (3.9%) more calls on average per day than the same month last year.
Calls to the ambulance service are categorised as red, amber or green depending on the urgency of the call. An average of 116 immediately life-threatening ‘red’ calls were made per day in March. This is the tenth month in a row where on average there were more than 100 immediately life-threatening calls made each day.
In March, the proportion of all calls that were immediately life-threatening (red calls) was 9.2% up from 8.5% in February.
Target
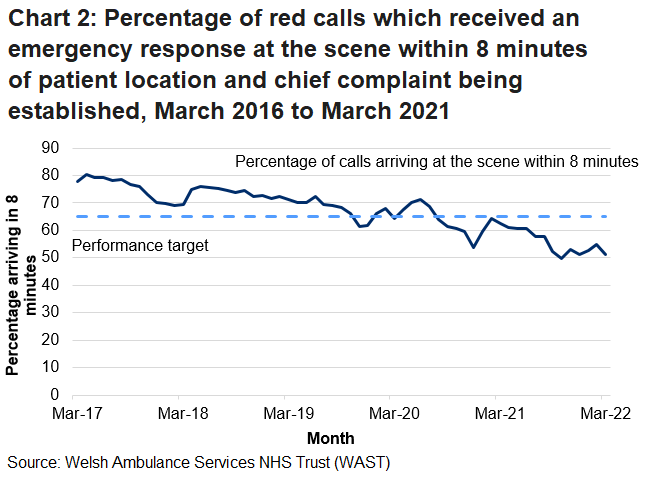
- 65% of red calls (immediately life-threatening – someone is in imminent danger of death, such as a cardiac arrest) to have a response within 8 minutes.
Note: An update to call handling in May 2019 resulted in a change to red incident volume. It is not possible to directly compare before and after this date. Further details are available in the quality and methodology information.
In March, 51.1% of emergency responses to immediately life threatening (red) calls arrived within 8 minutes. This is 3.9 percentage points lower than the previous month, and 11.4 percentage points lower than in March 2021.
The median response time in the four years prior to the pandemic ranged between 4 minutes 30 seconds and 6 minutes for red calls. In March, the average (median) response time to immediately life-threatening ‘red’ calls was 7 minutes and 50 seconds. This was 27 seconds slower than in February and 1 minute 13 seconds slower than in March 2021.
The majority of calls to the ambulance service are categorised as ‘amber’ calls, for which there is no performance target for call response times. In March the median response time for amber calls was just over 1 hour and 43 minutes. This is almost 26 minutes slower than in February, and 1 hour and 7 minutes slower than in March 2021.
Emergency department attendances and admissions to hospital
A wider range of emergency department performance statistics are published on the National Collaborative Commissioning Unit (NCCU) website, as management information.
Activity
Number of attendances in NHS Wales emergency departments by age band, sex and site on StatsWales
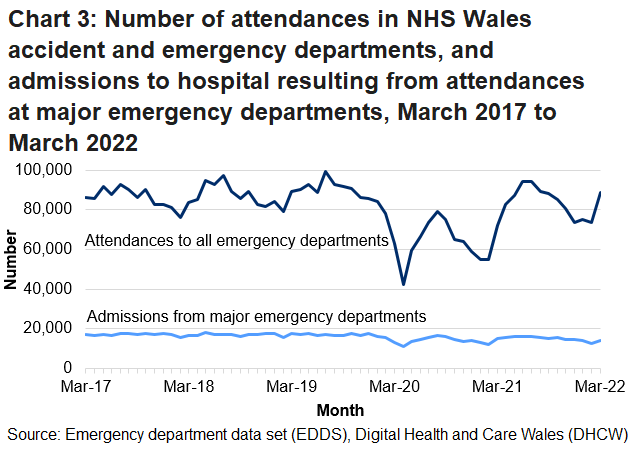
Note: Chart shows number of attendances at both major emergency departments and minor injuries units, and the number of admissions resulting from attending major emergency departments only.
In March there were almost 89,000 attendances to all NHS Wales emergency departments. This is an average of 2,858 emergency department attendances per day; 232 more attendances per day on average than in the previous month, and 536 more than in the same month last year.
In March, almost 14,000 patients were admitted to the same or a different hospital following attendance at a major emergency department. This was 9.6% higher than the previous month, but 8.4% lower than the same month in 2021.
Performance
Targets
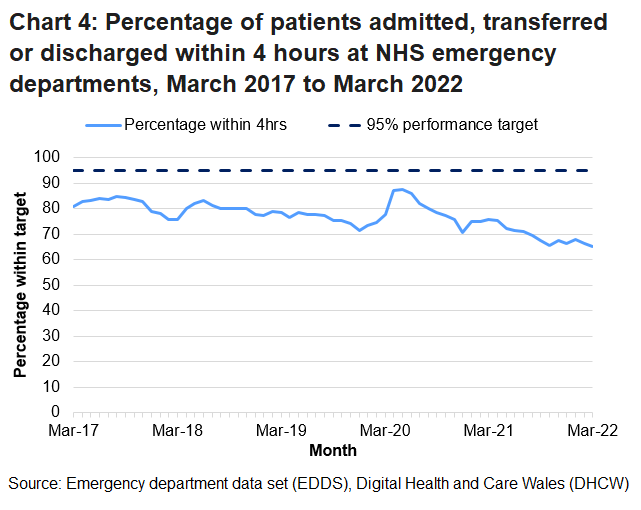
- 95% of new patients should spend less than 4 hours in emergency departments from arrival until admission, transfer or discharge.
- No patient waiting more than 12 hours in emergency departments from arrival until admission, transfer or discharge.
Performance against 4 hour target by hospital on StatsWales
March data shows that 65.1% of patients in all NHS emergency departments spent less than 4 hours in the department from arrival until admission, transfer or discharge, which was the lowest level on record. This was 1.3 percentage points lower than the previous month, and 10.7 percentage points lower than the same month a year ago. The 95% target continues to be missed.
In 2019, the median time patients spent in emergency departments was around 2 hours and 30 minutes. During the early part of the pandemic, as attendances decreased the median time spent in the department decreased, to a low of 1 hours 47 minutes in April 2020. Since then, median times have increased and reached a record high of 3 hours and 8 minutes in March 2022 (latest data). This was eight minutes longer than the previous month.
The median time spent in emergency department varies by age. Prior to the pandemic, children (aged 0 to 4) spent between 1 hour and 30 minutes and 2 hours in emergency departments, while older patients (aged 85 or greater) spent between 3 hours and 30 minutes and 5 hours.
In March, children spent an average of 2 hours and 28 minutes. Adults aged 85 and over spent an average of 7 hours and 57 minutes in emergency departments.
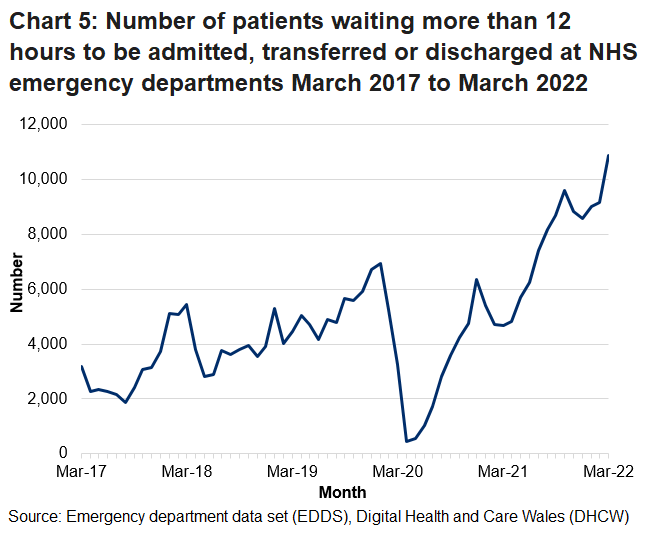
Performance against the 12 hour target by hospital on StatsWales
In March there were almost 11,000 patients waiting 12 hours or more. This was 1,714 more than in the previous month and is the highest on record.
Scheduled care activity
New data relating to unscheduled care are provided for the month of February 2022.
Outpatient referrals
An outpatient appointment is an appointment, often at a hospital or clinic, where the patient does need to stay at hospital overnight. Outpatient referrals statistics show monthly data on the number of referral requests for a first outpatient appointment received by local health boards in Wales.
Activity
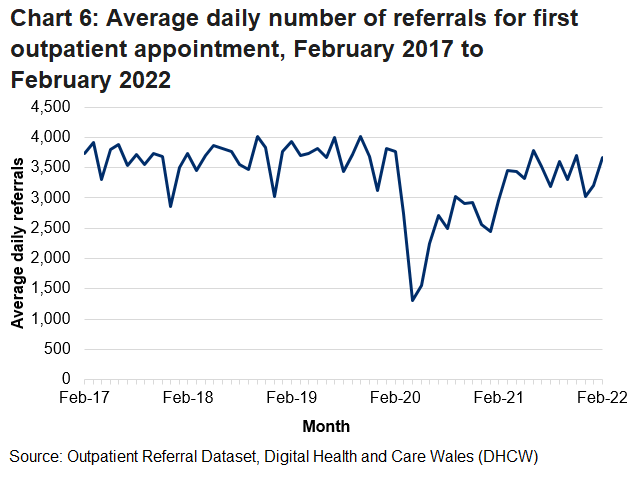
Outpatient referrals on StatsWales
An average of 3,664 referrals for first outpatient appointments were made per day in February 2022. This is an increase of 14.3% (459 more referrals per day on average) compared to January 2022.
Diagnostic and therapy waiting times
Activity
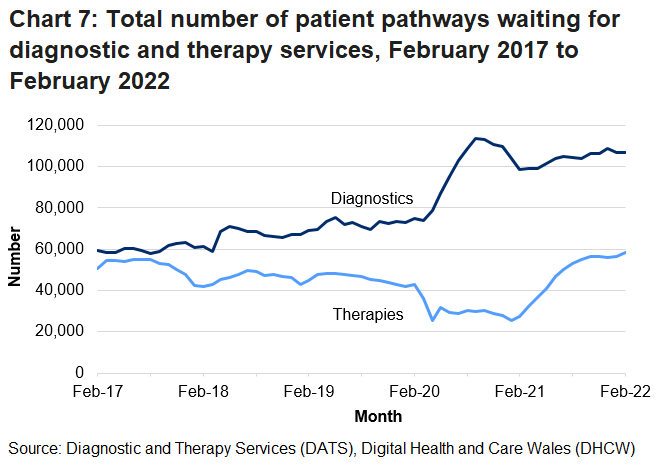
Diagnostic and Therapy Services Waiting Times by week on StatsWales
Note: The low point in April 2020 for therapies is in part due to Betsi Cadwaladr not submitting data for this month, please see the key quality information for more information.
In February there were almost 107,000 patient pathways waiting for diagnostics, a decrease of 0.3% compared with the previous month and there were over 58,000 patient pathways waiting for therapies, an increase of 3.0% compared to the previous month to the highest level on record.
Performance
Targets
- The maximum wait for access to specified diagnostic tests is 8 weeks.
- The maximum wait for access to specified therapy services is 14 weeks.
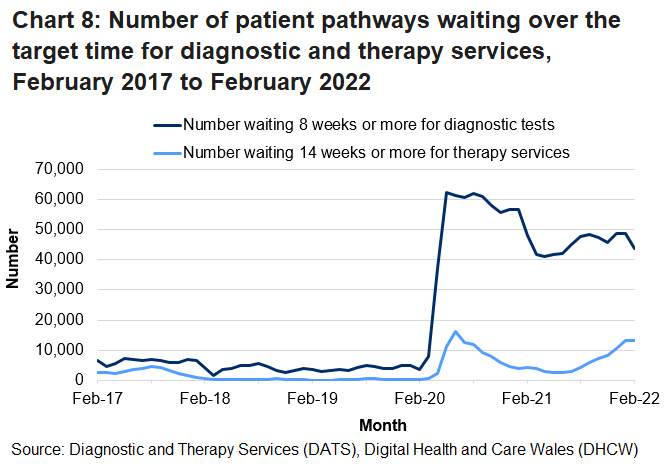
Diagnostic and Therapy Services Waiting Times by week on StatsWales
Note: Betsi Cadwaladr did not submit data for April 2020, so are not included in the Wales figures for this month.
At the end of February, almost 44,000 patient pathways were waiting longer than the target time for diagnostics. This was a decrease of 10.0% compared to the previous month but over twelve times greater than the same month before the pandemic (February 2020).
At the end of February there were over 13,000 patient pathways waiting longer than the target time for therapies. This is an increase of 1.7% compared to January 2022 and although this was the ninth consecutive month on month increase, it was the slowest rate of increase for this period.
Median waiting times had been relatively stable for diagnostic tests since 2017 and for therapy services since 2018. Median waiting times for both services peaked in June 2020 (14.3 weeks for diagnostics and 14.9 weeks for therapies).
In February, the median waiting time for diagnostic tests was 5.4 weeks. This is a decrease from 6.9 weeks in the previous month. The median waiting time for therapy services was 5.3 weeks. This is a decrease from 7.0 weeks in the previous month and the first month on month decrease since March 2021.
Referral to treatment time
Referral to treatment time statistics show monthly data on waiting times for both open and closed pathways following a referral by a GP or other medical practitioner to hospital for treatment in the NHS. Open pathways are those that remain on the waiting list for treatment, whereas closed pathways are those taken off the waiting list.
Activity is measured by patient pathways, which differs to the number of patients. More information on this difference is available in the Welsh Government’s chief statisticians blog.
Activity
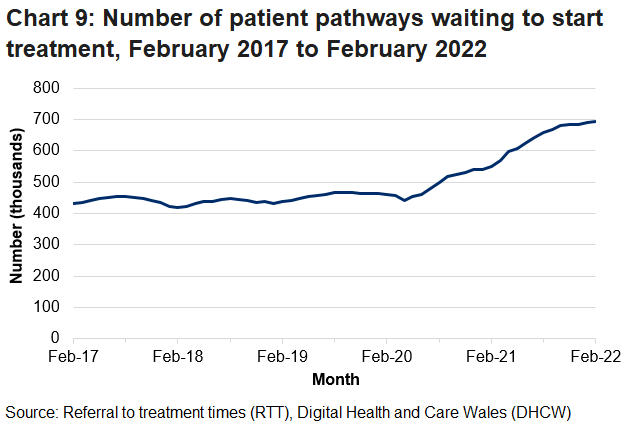
In February there were almost 692,000 patient pathways waiting to start treatment, the highest since comparable data was first collected in 2011. This was 0.4% higher than in the previous month, which is the second smallest month-on-month increase since the start of the pandemic. This was 9.8% higher than the month before the pandemic (February 2020).
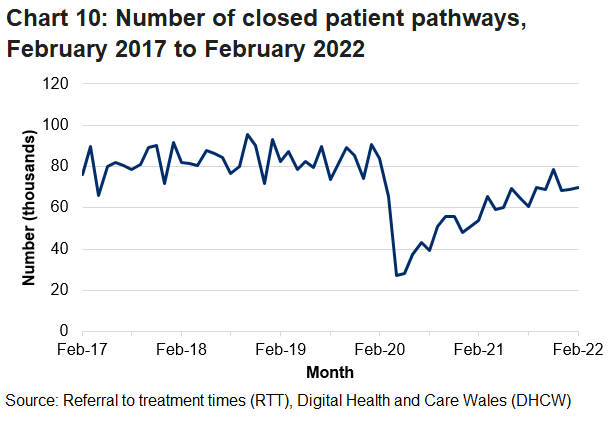
Closed patient pathways by month, local health board and weeks waiting on StatsWales
Note: Cwm Taf Morgannwg health board have been unable to provide closed pathway data since September 2018. Data for this health board is excluded from the Wales total in the chart to allow for trend analysis. More details are available in the quality and methodology information.
The number of patient pathways closed in February was almost 70,000. This is an average of 3,492 patient pathways closed per working day, an increase of 1.7% from January 2022, and the highest since the month before the pandemic (February 2020).
Performance
Targets
- 95% of patients waiting less than 26 weeks from referral.
- No patients waiting more than 36 weeks for treatment from referral.
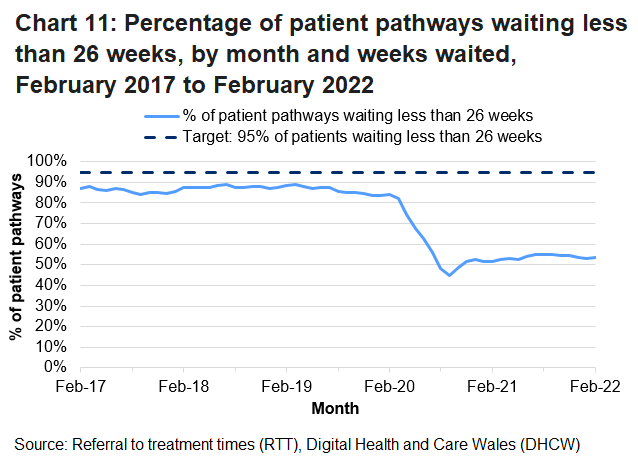
Of the 692,000 patient pathways waiting to start treatment by the end of February, 53.4% had been waiting less than 26 weeks. This is 0.5 percentage points higher than in the previous month but 30.9 percentage points lower than in the month before the pandemic (February 2020).
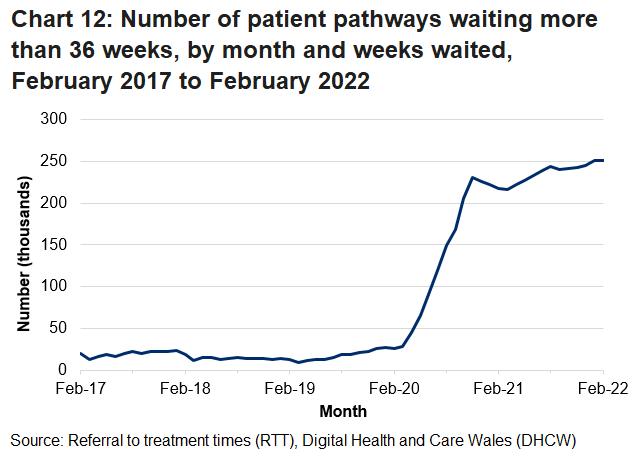
In February almost 252,000 patient pathways had been waiting more than 36 weeks. This represented 36.4% of all patient pathways waiting to start treatment. This is 755 (or 0.3%) more pathways waiting than in the previous month and almost ten times more than the month before the pandemic (February 2020).
The median waiting time to start treatment had generally been around 10 weeks pre pandemic between late 2013 and February 2020. This increased during the pandemic and peaked at a record high of 29 weeks in October 2020. In February, the median waiting time was 22.9 weeks. This is a decrease from 23.6 weeks in the previous month.
Cancer services (experimental statistics)
Data is captured by the suspected cancer pathway, which measures the time on the cancer pathway from the point a patient was suspected of having cancer (for example when a GP makes a referral).
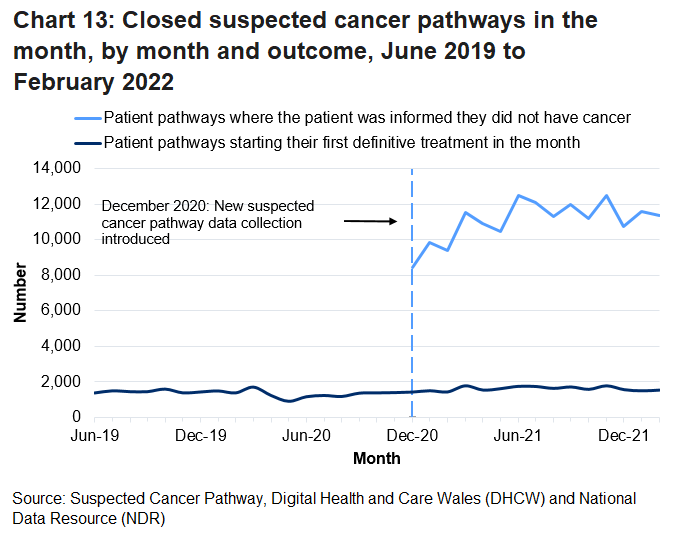
A pathway opens from the first point of suspicion and is closed, and the waiting time ends, if the patient starts their first definitive treatment; is told they do not have cancer (downgraded); chooses not to have treatment; or if the patient dies.
The closed pathway data presented in this statistical release includes only the pathways where the patient starts their first definitive treatment or where the patient is informed they do not have cancer. The open pathway data includes all new patient pathways entering the suspected cancer pathway regardless of their source of suspicion.
A number of wider measures from the suspected cancer pathway are produced by Digital Health and Care Wales are published alongside this statistical release.
Activity
Suspected cancer pathway (closed pathways) on StatsWales
In February, 1,530 pathways where the patient was newly diagnosed with cancer started their first definitive treatment in the month. This is an increase of 2.5% compared to the previous month and an increase of 6.8% from February 2021.
11,377 pathways were closed following the patient being informed they did not have cancer. This is a decrease of 1.8% compared to the previous month.
In February, 13,642 patient pathways were opened in the month following a new suspicion of cancer. This was an increase of 162 (1.2%) on the previous month.
Performance
Target
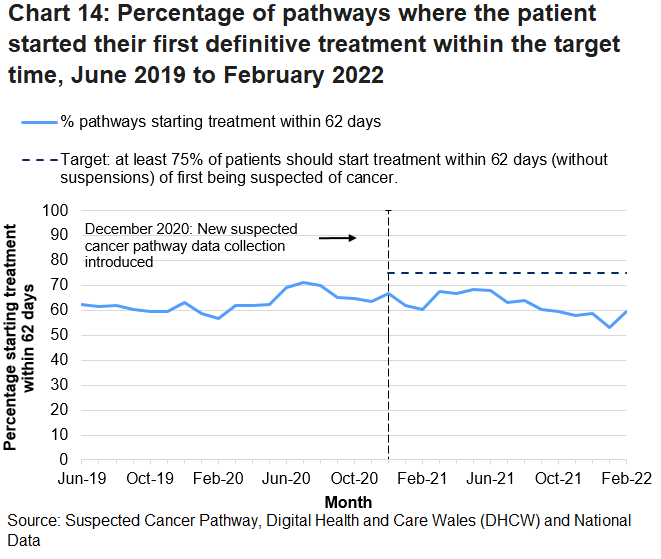
- At least 75% of patients should start treatment within 62 days (without suspensions) of first being suspected of cancer. Data published for time periods before December 2020 are not subject to the target.
Suspected cancer pathway (closed pathways) on StatsWales
In February, 59.5% (910 out of 1,530) of pathways started their first definitive treatment within 62 days of first being suspected of cancer. This was 6.5 percentage points higher than the previous month but 0.7 percentage points lower than February 2021.
Quality and methodology information
All quality and methodology information in relation to this statistical release can be found in the NHS activity and performance summary: quality report
Well-being of Future Generations Act (WFG)
The Well-being of Future Generations Act 2015 is about improving the social, economic, environmental and cultural wellbeing of Wales. The Act puts in place seven wellbeing goals for Wales. These are for a more equal, prosperous, resilient, healthier and globally responsible Wales, with cohesive communities and a vibrant culture and thriving Welsh language. Under section (10)(1) of the Act, the Welsh Ministers must (a) publish indicators (“national indicators”) that must be applied for the purpose of measuring progress towards the achievement of the wellbeing goals, and (b) lay a copy of the national indicators before Senedd Cymru. Under section 10(8) of the Well-being of Future Generations Act, where the Welsh Ministers revise the national indicators, they must as soon as reasonably practicable (a) publish the indicators as revised and (b) lay a copy of them before the Senedd. These national indicators were laid before the Senedd in 2021. The indicators laid on 14 December 2021 replace the set laid on 16 March 2016.
Information on the indicators, along with narratives for each of the wellbeing goals and associated technical information is available in the Wellbeing of Wales report.
Further information on the Well-being of Future Generations (Wales) Act 2015.
The statistics included in this release could also provide supporting narrative to the national indicators and be used by public services boards in relation to their local wellbeing assessments and local wellbeing plans.
We want your feedback
We welcome any feedback on any aspect of these statistics which can be provided by email to stats.healthinfo@gov.wales.
Next update
19 May 2022
Contact details
Statistician: Rhys Strafford
Telephone: 0300 025 0058
Email: stats.healthinfo@gov.wales
Media: 0300 025 8099
SFR 123/2022