NHS activity and performance summary: December 2021 and January 2022
Report summarising data on activity and performance in the Welsh NHS for December 2021 and January 2022.
In this page
Introduction
This statistical release provides a summary of NHS Wales activity and performance data.
New data relating to calls to the ambulance service, emergency department attendances and admissions to hospital from major emergency departments are provided for the month of January 2022.
New data relating to: referrals for first outpatient appointments, diagnostic and therapy waiting times (DATS), referral to treatment times (including both closed patient pathways and patient pathways waiting to start treatment) and the suspected cancer pathway are provided for the month of December 2021.
Data for each topic area is also available in more detail on our StatsWales website and on our interactive dashboard.
Note that data included in this statistical release covers a time period during the coronavirus (COVID-19) pandemic, which has affected both how some NHS services have been offered and people's choices regarding health services. Further information is available in quality information section.
Statistician’s comment
In January 2022 the total number of calls made to the ambulance service decreased on the previous month. However, this was the eighth month in a row where on average there were more than 100 immediately life-threatening calls made each day to the ambulance service. Despite this, performance against the eight minute ambulance response target increased on the previous month but performance remained below pre-pandemic levels.
Average daily attendances to emergency departments increased for the first time since mid-2021. Performance increased against the four hour emergency department target but decreased against the twelve hour target, with the second highest number of patients waiting longer than twelve hours on record.
In December 2021, the number of patient pathways waiting for treatment increased at the slowest rate since the start of the pandemic continuing the trend from last month, with 0.2% more pathways waiting for treatment than the previous month. The number of patient pathways waiting for therapies increased for the seventh consecutive month in a row.
Activity in cancer services decreased on the previous month, which was a record high for the number of pathways newly diagnosed with cancer starting their first definitive treatment. There were also fewer pathways downgraded on the previous month. However, this led to an increase in performance with more pathways starting their first definitive treatment within the target time than the previous month.
Main points
- In January 2022, an average of 109 immediately life-threatening (‘red’) calls were made per day. This is the eighth month in a row where on average there were more than 100 immediately life-threatening calls made each day.
- 52.5% of red calls received a response within 8 minutes in January 2022, 1.4 percentage points higher than the previous month.
- The average (median) response time to immediately life-threatening (red) calls was 7 minutes and 39 seconds, 13 seconds faster than in December 2021.
- The average number of attendances per day at emergency departments increased by 1.5% compared to the previous month.
- In January 2022, performance increased against the four hour emergency department target but decreased against the twelve hour target.
- The average (median) time spent in emergency departments in January 2022 decreased on the previous month to 2 hours and 52 minutes.
- The number of patient pathways waiting for diagnostic tests remains markedly higher than before the pandemic started and increased in December 2021, compared to the previous month. The number waiting longer than the target time also increased.
- The number of patient pathways waiting for therapies increased every month in 2021 but fell slightly in the latest month. The fourteen week performance target continues to be missed, the numbers waiting over the target time increased for the seventh consecutive month.
- The total number of patient pathways referred but waiting to start treatment has risen each month since April 2020. In December 2021, the increase over the month was the smallest month on month increase since the start of the pandemic. There were more than 683,000 patient pathways waiting to start treatment.
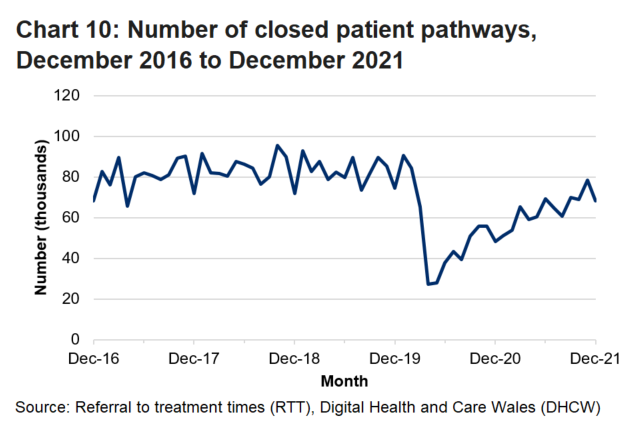
- The number of closed pathways in the month has been on an upward trend since April 2020, with month-to-month fluctuations. There were more than 68,000 pathway closures in December 2021, a decrease on the previous month which was the highest since the start of the pandemic.
- The average number of closed pathways closed per working day was the third highest since the start of the pandemic.
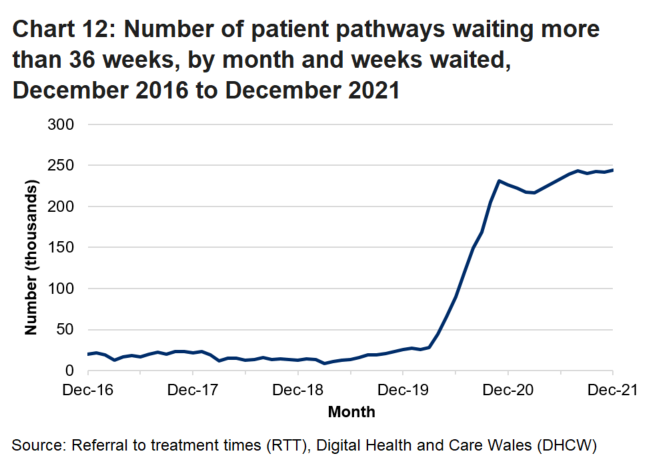
- COVID-19 has had a clear effect on performance against both of the referral to treatment targets. The percentage of the total patient pathways that were waiting less than 26 weeks decreased on the previous month and the number of pathways waiting longer than 36 weeks increased.
- The number of pathways where patients with newly diagnosed cancer started their first definitive treatment decreased on the previous month, November 2021, which was the joint highest since comparable data was first collected in June 2019.
- The number of pathways that closed following the patient being informed they did not have cancer decreased on the previous month.
- Performance against the 62 day cancer target increased compared to the previous month to 58.6% of pathways starting their first definitive treatment in the month within the target time.
Unscheduled care activity
Emergency calls to the ambulance service
Activity
Emergency ambulance calls and responses to red calls, by local health board and month on StatsWales
Note: An update to call handling practices in May 2019 has resulted in a change to red incident volume. Therefore, it is not possible to fairly compare red incident volumes prior to this time. More information is available in the quality information section.
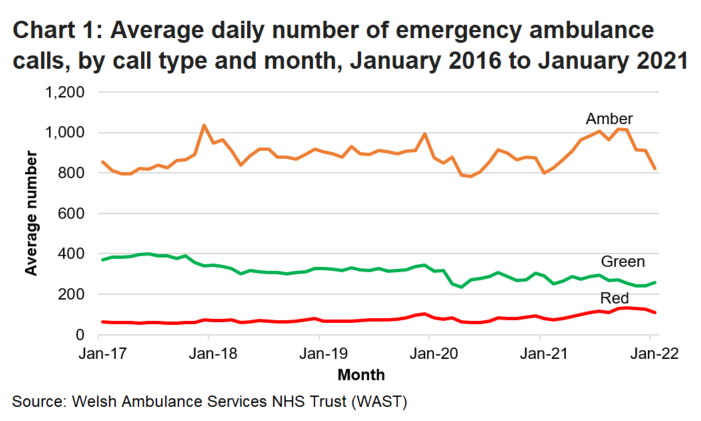
Prior to the pandemic, the total number of emergency calls received by the Welsh Ambulance Services NHS Trust (WAST) had been increasing gradually over the long term, but they fell at the start of the pandemic. However, since February 2021 they have generally increased, with month on month fluctuations, but have started to decrease again in recent months.
In January 2022, almost 37,000 emergency calls were made to the ambulance service. This is an average of 1,191 calls per day, a decrease on the previous month and 81 (5.6%) fewer calls on an average per day than the same month last year.
January 2022 was the eighth month in a row where, on average, there were more than 100 immediately life-threatening calls made each day.
Calls to the ambulance service are categorised as red, amber or green depending on the urgency of the call. In January 2022, the proportion of all calls that were immediately life-threatening (red calls) was 9.2%, down from 9.9% in December 2021.
Target
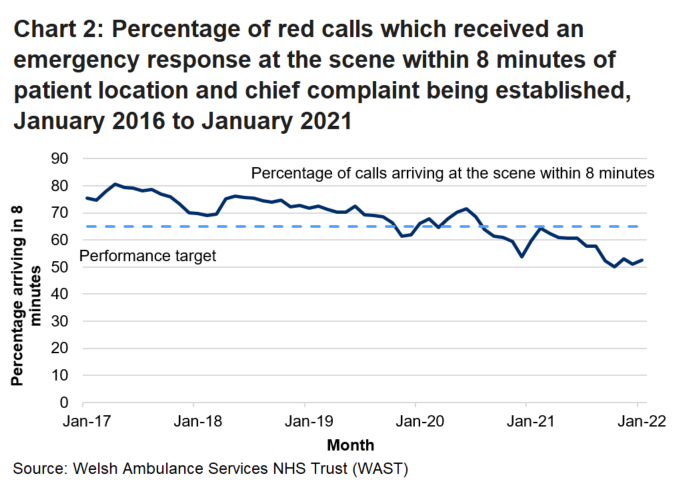
- 65% of red calls (immediately life-threatening, someone is in imminent danger of death, such as a cardiac arrest) to have a response within 8 minutes.
Note: An update to call handling practices in May 2019 has resulted in a change to red incident volume. Therefore it is not possible to fairly compare performance against the target after this date, with performance prior to this date. More information is available in the quality information section.
Whilst the COVID-19 pandemic is ongoing, emergency response teams are required to complete additional procedures including wearing extra personal protective equipment which impacts on the speed at which they can respond to a call.
Performance against the 8 minute response target to red calls has generally been lower since the pandemic started and the target has not been met for the last 18 months.
In January 2022, 52.5% of emergency responses to immediately life threatening (red) calls arrived within 8 minutes. This is 1.4 percentage points higher than the previous month, but 7.1 percentage points lower than in January 2021.
Analysing average response times provides wider context to performance data. The median response time varies from month-to-month, but in the four years prior to the pandemic, had tended to range between 4 minutes 30 seconds and 6 minutes for red calls. However, it has been above 6 minutes for each month since August 2020, reaching a high of 8 minutes 1 second in October 2021. In January 2022, the median waiting time for calls that were immediately life-threatening (red calls) was 7 minutes and 39 seconds. This is 13 seconds faster than in December 2021, but 50 seconds slower than in January 2021.
The majority of calls to the ambulance service are categorised as amber calls. There is no target associated with response times for amber calls but contextual information shows that in January 2022 the median response time for amber calls was just over 62 minutes. This is more than 17 faster than in December 2021, but more than 23 minutes slower than in January 2021.
Emergency department attendances and admissions to hospital
‘Emergency department’ refers to attendances and admissions at both major accident and emergency departments (A&E), other A&E departments and minor injuries units (MIUs), unless otherwise stated.
A wider range of emergency department performance statistics are published on the National Collaborative Commissioning Unit (NCCU) website, as management information. This includes measures on the time from patient arrival to triage, the time from patient arrival to contact with a clinical decision maker and analysis of the patient’s discharge destination when they leave the emergency department. These are updated every month on the same day as this National Statistics publication.
A new attendance is defined as the first visit made by a patient to an emergency department for a particular injury or ailment. If a patient returns to an emergency department with a condition previously treated where they have not been asked to return by the clinician, this is also counted as a new attendance. This means that the data presented is for attendances and not a unique count of patients attending emergency departments.
The time spent in an emergency care facility starts when the emergency care facility is informed of the patient’s arrival at the hospital and stops when the patient is admitted, transferred or discharged.
Activity
Number of attendances in NHS Wales emergency departments by age band, sex and site on StatsWales
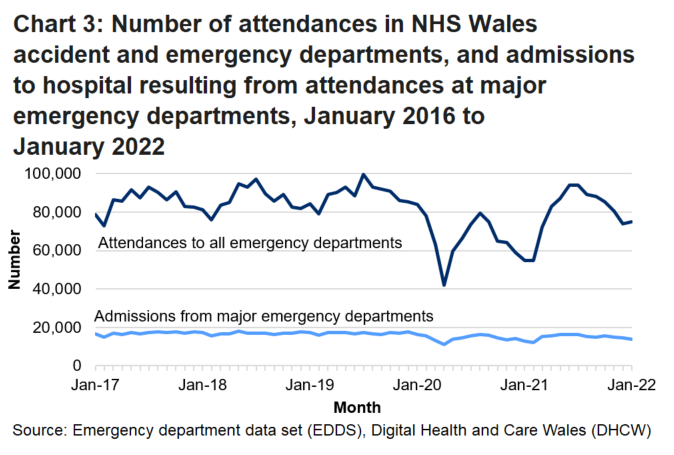
Note: Chart 3 shows the number of attendances at both major emergency departments and minor injuries units, and the number of admissions resulting from attending major emergency departments only. Admissions from minor injuries units are not recorded on a consistent basis throughout Wales and are therefore not counted in this chart.
While attendances to emergency departments fluctuate each month, attendances are generally higher in the summer months than the winter.
Attendances to all NHS Wales emergency departments have been affected by the COVID-19 pandemic which started in early 2020, with sharp falls in attendances in the following spring and winter months, coinciding with waves of the pandemic. While attendances in summer 2021 were broadly in line with summer months prior to the pandemic, since this point attendances fell each month, until December 2021, to below pre-pandemic levels.
The latest data shows that there were almost 75,000 attendances to all NHS Wales emergency departments in January 2022. This was 1.5% higher than the previous month (1,076 more attendances) and 36.4% higher than in the same month last year (19,982 more attendances).
The average number of emergency department attendances per day in January 2022 was 2,416. This was 35 more attendances per day on average than in the previous month, and 1,771 more than in the same month last year.
The total number of emergency department attendances in the year to January 2022 was almost 977,000. This is 25.2% higher than the previous year (year ending January 2021) but 8.7% lower than the last 12 month period before the pandemic (March 2019 to February 2020).
The trend for admissions to hospital resulting from attendances at major emergency departments, is similar to the trend for attendances to all emergency departments since the pandemic.
In January 2022, just over 13,800 patients were admitted to the same or a different hospital following attendance at a major emergency department. This was 4.5% lower than the previous month, but 6.7% higher than the same month in 2021.
Performance
Targets
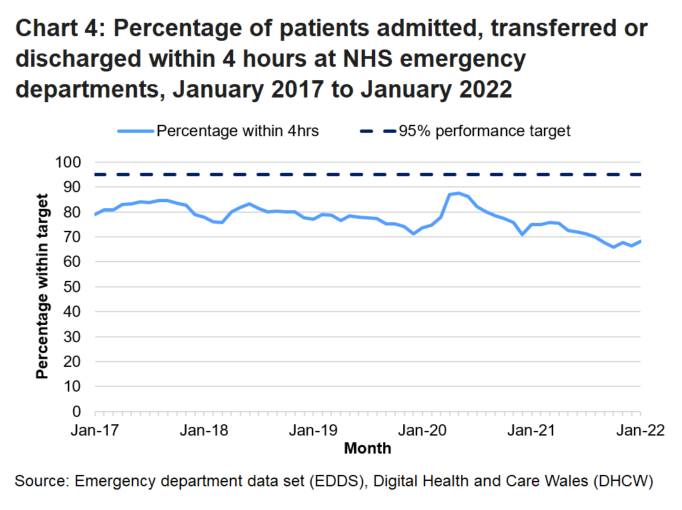
- 95% of new patients should spend less than 4 hours in emergency departments from arrival until admission, transfer or discharge.
- No patient waiting more than 12 hours in emergency departments from arrival until admission, transfer or discharge.
Performance against 4 hour target by hospital on StatsWales
Note: Data for all months between March 2021 and October 2021 revised following a data resubmission. More information in the quality information section.
In the five years prior to the pandemic, the percentage of patients admitted, transferred or discharged within 4 hours of attending an emergency department fluctuated from month-to-month but tended to be close to 80%. However, during the year prior to the COVID-19 pandemic, the percentage decreased most months, reaching a low point in December 2019, before increasing in early 2020.
During the early months of the pandemic performance against the 4 hour target time improved, reaching a high of 87.7% in May 2020. Since then the trend has been broadly downward and in October 2021, monthly performance was the lowest since comparable data was first recorded in April 2012.
The latest month’s data shows that 68.2% of patients in all NHS emergency departments spent less than 4 hours in the department from arrival until admission, transfer or discharge. This was 1.7 percentage points higher than the previous month, but 6.9 percentage points lower than the same month in 2020. The 95% target continues to be missed.
Contextual information shows that the median time which patients spend in emergency departments has increased gradually from under 2 hours in most months in 2012 and 2013 to around 2 hours and 30 minutes throughout 2019, prior to the COVID-19 pandemic.
During the early part of the pandemic, as attendances decreased the median time spent in the department decreased, to a low point of 1 hours 47 minutes in April 2020. Since then, median times have increased alongside increasing attendances and reached a record high in October 2021.
In January 2022, the median time spent in a department was 2 hours and 52 minutes. This was down from 3 hours and 01 minute in the previous month, but up from 2 hours 29 minutes in the same month in 2021.
The median time spent in emergency department varies by age. Prior to the pandemic, children generally spent between 1 hour and 30 minutes and 2 hours in emergency departments, while older patients (aged 85 or greater) generally spent between 3 hours and 30 minutes and 5 hours in emergency departments. In January 2022, children aged 0 to 4 spent an average of 2 hours and 06 minutes and adults aged 85 and over spent an average of 8 hours and 02 minutes in emergency departments, this was the longest average wait since comparable data was first recorded in April 2012 for this age group.
Performance against the 12 hour target by hospital on StatsWales
Note: Data for all months between March 2021 and October 2021 revised following a data resubmission. More information in the quality information section.
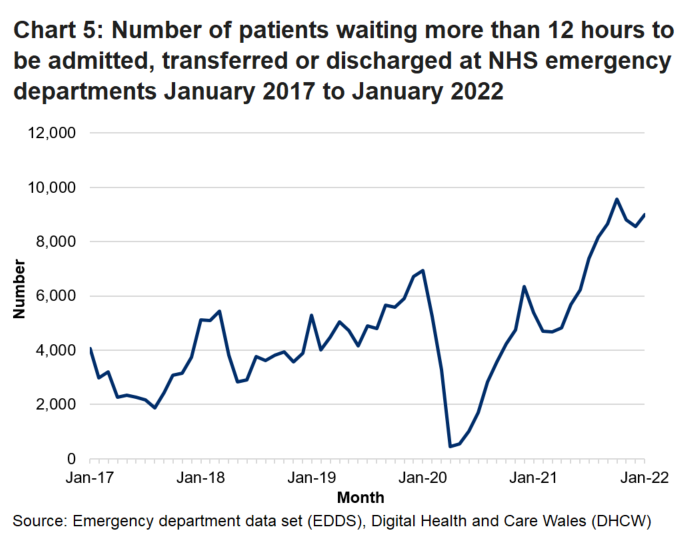
The number of patients who spent 12 hours or more at an NHS emergency department from arrival until admission, transfer or discharge varies each month but had been on an overall upward trend prior to the COVID-19 pandemic.
Just before the pandemic in January 2020, a little under 7,000 patients spent 12 hours or more in emergency departments. This fell to fewer than 500 in April 2020, during the early stages of the COVID-19 pandemic. Since that record low point, the number spending 12 hours or more has generally increased and reached a record high in October 2021.
In January 2022 there were almost 9,000 patients waiting 12 hours or more. This was 445 more than in the previous month and the second highest on record since current reporting began in April 2012.
Scheduled care activity
In the majority of scheduled care datasets, activity and performance is measured by counting patient pathways. This is the specific route a patient follows from their first referral through to the commencement of treatment. Referrals can come from a variety of health professionals, but most commonly come through GPs. Patient pathways are measured rather than patients, as a single patient can have multiple referrals for multiple pathways. Therefore, counting pathways better reflects the activity within NHS services.
Outpatient referrals
The outpatient referrals statistics show monthly data on the number of referral requests for a first outpatient appointment received by local health boards in Wales, regardless of area of residence.
Therefore, this data does not include any referrals made in Wales to a hospital located outside of Wales, but does include referrals made to hospitals in Wales for people resident outside Wales.
The referral date is the date which the local health board receives the referral and not the date which the patient was referred.
Activity
Outpatient referrals on StatsWales
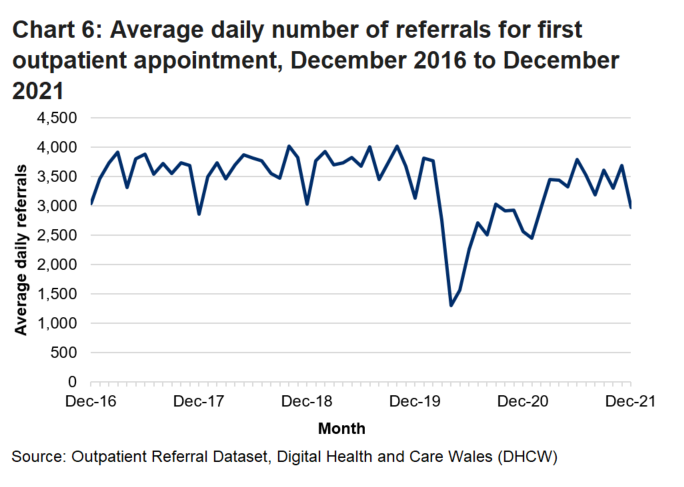
There was a large reduction in the number of referrals for first outpatient appointments in March 2020, following the start of the COVID-19 pandemic. Activity has increased in the months since but the number of referrals made in the latest month (December 2021) is lower than the number made in the same month prior to the pandemic (December 2019).
An average of 2,975 referrals for first outpatient appointments were made per day in December 2021. This is a decrease of 19.3% (713 fewer referrals per day on average) compared to November 2021 and a decrease of 4.9% (152 fewer referrals per day on average) compared to December 2019.
Diagnostic and therapy waiting times
Activity
Diagnostic and Therapy Services Waiting Times by week on StatsWales
Note: The low point in April 2020 for therapies is in part due to Betsi Cadwaladr not submitting data for this month. To provide likely scale of the impact, data for Betsi Cadwaldr in the two months either side showed that 7,519 were waiting for therapies in March 2020 and 9,840 were waiting in May 2020.
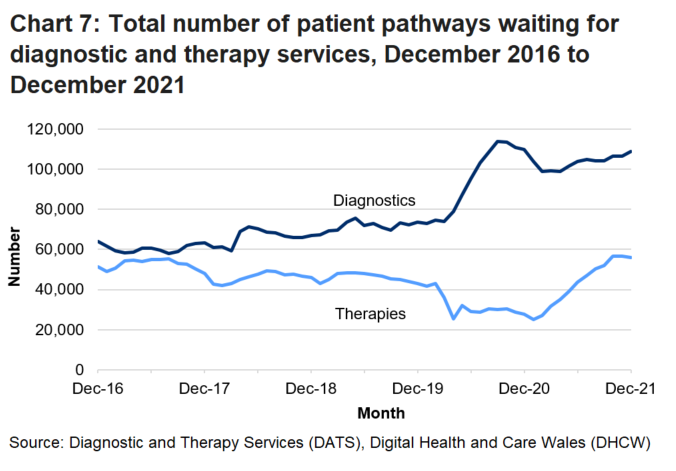
The latest data for December 2021 shows that there were almost 109,000 patient pathways waiting for diagnostics, an increase of 2.1% compared with the previous month. The number of pathways waiting for diagnostics is lower than the peak in September 2020 and but has been on a slight upward trend for the past eight months.
The number of pathways waiting for diagnostics in latest month is 47.8% higher than the same month before the pandemic (December 2019).
Following the record low in April 2020, the number of patient pathways waiting for therapies was relatively stable for the remaining months of 2020, but increased to its highest ever level in November 2021.
The latest data for December 2021 shows that there were a little over 56,000 patient pathways waiting for therapies, a decrease of 0.8% compared to the previous month.
The number of pathways waiting for therapies in latest month is 30.5% higher than the same month before the pandemic (December 2019).
Performance
Targets
- The maximum wait for access to specified diagnostic tests is 8 weeks.
- The maximum wait for access to specified therapy services is 14 weeks.
Diagnostic and Therapy Services Waiting Times by week on StatsWales
Note: Betsi Cadwaladr did not submit data for April 2020, so are not included in the Wales figures for this month.
The COVID-19 pandemic has had a clear impact on the number of patient pathways waiting longer than the target times for diagnostic and therapy services. More details are available in the quality information section.
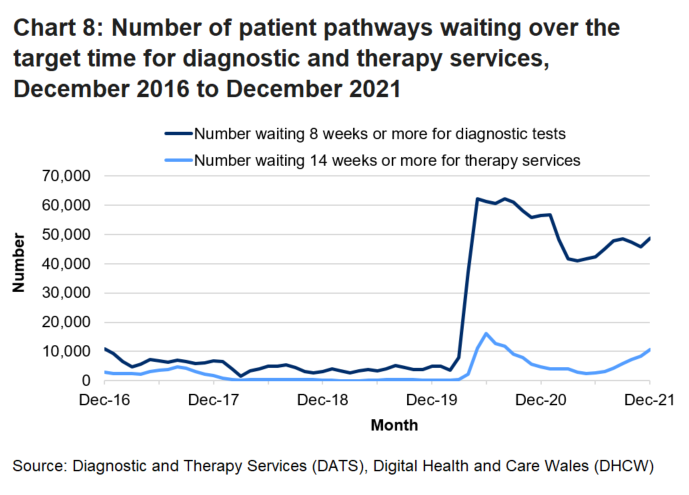
The largest number of pathways waiting longer than the target time for diagnostics was recorded in May 2020. The number waiting has decreased in recent months.
At the end of December 2021, almost 49,000 patient pathways were waiting longer than the target time. This was an increase of 6.6% compared to the previous month and almost ten times greater than the same month before the pandemic (December 2019).
The largest number of pathways waiting longer than the target time for therapies was recorded in June 2020. The trend from this high point was downwards until May 2021; the number has increased in each month since. At the end of December 2021 there were almost 11,000 patient pathways waiting longer than the target time for therapies. This is an increase of 26.5% compared to November 2021 and the seventh consecutive month on month increase.
Contextual information shows that until the COVID-19 pandemic, median waiting times had been relatively stable for diagnostic tests since 2017 and for therapy services since 2018. Median waiting times for both services peaked in June 2020 (14.3 weeks for diagnostics and 14.9 weeks for therapies).
In December 2021 the median waiting time for diagnostic tests was 6.7 weeks. This was an increase from 6.2 weeks in November 2021 and an increase from 3.3 weeks in December 2019.
In December 2021 the median waiting time for therapy services was 6.5 weeks. This is an increase from 5.4 in November 2021 and 4.2 weeks in December 2019.
Referral to treatment time
The referral to treatment time statistics show monthly data on the waiting times for both open and closed pathways following a referral by a GP or other medical practitioner to hospital for treatment in the NHS in Wales.
Data for Welsh residents treated or waiting for treatment outside of Wales are not included.
A patient is defined to have been treated, or their pathway closed if either, following consultation with a hospital specialist, no hospital treatment is necessary or if treatment begins. This could include:
- being admitted to hospital for an operation or treatment;
- starting treatment that does not require a stay in hospital (for example, medication or physiotherapy);
- beginning the fitting of a medical device such as leg braces; or
- starting an agreed period of time to monitor the patient’s condition to see if further treatment is needed.
COVID-19 has impacted the way treatments are offered. More details are available in the quality information section.
Note that the day of referral is defined as the day that the referral letter is received by the hospital.
Activity
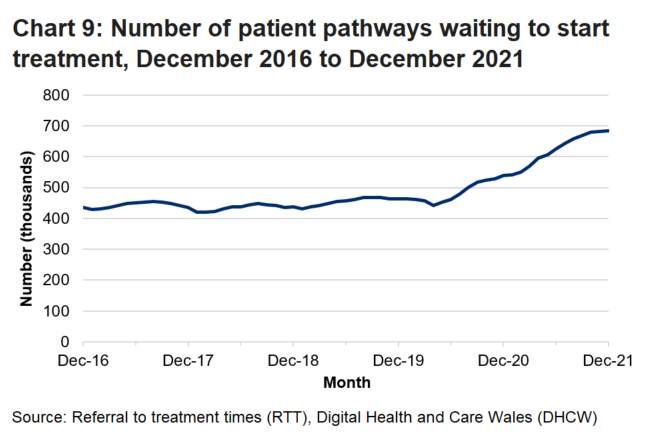
Prior to the COVID-19 pandemic, the number of patient pathways waiting to start treatment typically varied each month and tended to be highest in late summer and lowest in January.
The COVID-19 pandemic has impacted on the total number of patient pathways waiting to start treatment, with the number increasing steadily every month since April 2020, reaching a little over 683,000 by the end of December 2021. This is the highest since comparable data was first collected in 2011.
The number waiting in December 2021 was 0.2% higher than in the previous month, the slowest rate of increase since the start of the pandemic, and 47.7% higher than in the same month before the pandemic (December 2019).
Closed patient pathways by month, local health board and weeks waiting on StatsWales
Note: Cwm Taf Morgannwg health board have been unable to provide closed pathway data since September 2018. Data for this health board is excluded from the Wales total in the chart to allow for trend analysis. More details are available in the quality information section.
The number of closed patient pathways varies considerably each month and tends to be lower in April and December, but remained at a broad level close to 80,000 per month for the 3 years prior to the COVID-19 pandemic.
At the start of the pandemic, the number of closed pathways fell sharply with the fewest closed on record in April 2020. In most months since then the number of patient pathways closed has increased and has almost returned to pre-COVID-19 levels.
The number of patient pathways closed in December 2021 was over 68,000. This is an average of 3,252 patient pathways closed per working day (in December there were 21 working days), this is a decrease 8.6% from November 2021 and a decrease of 12.5% from December 2019.
Performance
Targets
- 95% of patients waiting less than 26 weeks from referral.
- No patients waiting more than 36 weeks for treatment from referral.
During the COVID-19 pandemic, health boards have not performed the same level of validation on referral to treatment performance data as they had previously. Therefore, caution is advised when comparing statistics from March 2020 onwards with previous months. Additional information is provided in the quality information section.
Prior to the COVID-19 pandemic, performance against both referral to treatment targets was fairly stable between 2016 and early 2019, but had been deteriorating since mid-2019.
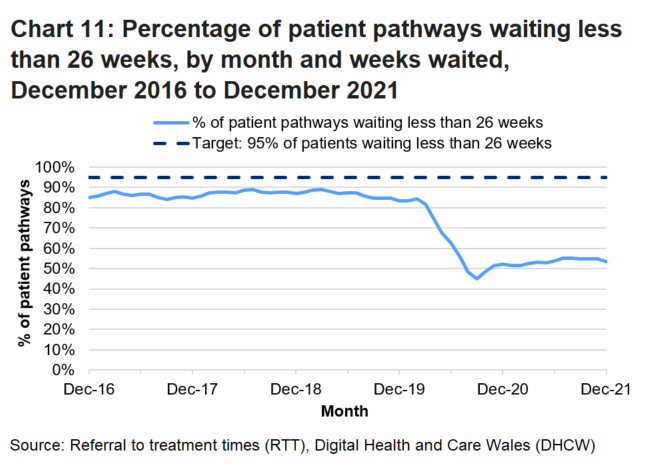
The percentage of patient pathways waiting less than 26 weeks decreased at the start of the COVID-19 pandemic, reaching the lowest level on record in September 2020. There has been a slight upward trend in the percentage of patients waiting less than 26 weeks since then. However, this has levelled off in recent months and remains markedly lower than in the pre-pandemic period.
Of the 683,000 patient pathways waiting to start treatment by the end of December 2021, 53.5% had been waiting less than 26 weeks.
This is 1.2 percentage points lower than November 2021 and 30.0 percentage points lower than in December 2019.
Further information on the clinical prioritisation of waiting times are can be found in our quality information section.
The number of patient pathways waiting more than 36 weeks has markedly increased since the start of the COVID-19 pandemic. There was a slight fall between November 2020 and March 2021, however the number increased since July 2021 and is approaching 250,000.
In December 2021, over 244,000 patient pathways had been waiting more than 36 weeks from the date the referral letter was received by the hospital. This was the highest number of patient pathways waiting over 36 weeks since comparable data was first collected in 2011. This represented 35.8% of all patient pathways waiting to start treatment.
This is 2,664 (or 1.1%) more pathways waiting than in November 2021 but almost ten times more than in December 2019.
Contextual information shows that the median waiting time to start treatment had generally been around 10 weeks between late 2013 and February 2020 but has increased since the COVID-19 pandemic and peaked at a record high of 29 weeks in October 2020. Since then, average waiting times have decreased in most months but remain above pre-pandemic levels.
In December 2021, the median waiting time was 23.2 weeks, an increase from 22.3 weeks in November 2021.
Cancer services
Data for both open and closed pathways is now sourced through the National Data Resource, hosted by Digital Health and Care Wales.
More detail is available in the quality information section.
Suspected cancer pathway (experimental statistics)
The suspected cancer pathway starts at the point of suspicion (for example when a GP makes a referral) and this is when the recorded waiting time starts. The pathway is closed, and the waiting time ends, if the patient starts their first definitive treatment; is told they do not have cancer (downgraded); chooses not to have treatment; or if the patient dies.
The closed pathway data presented in this statistical release includes only the patient pathways that start their first definitive treatment or are informed they do not have cancer (downgraded). Data does not include pathways where the patient chooses not to have treatment or pathways where ethe patient dies before they start their first definitive treatment (regardless of a positive or negative diagnosis of cancer).
Suspected cancer pathway data is measured by patient pathways rather than unique patients. This is because a single patient can have multiple cancer pathways opened if cancer is suspected in more than one tumour site. When quality assuring open pathway data for October, November and December 2021, it was estimated that the number of pathways opened is approximately 2-3% higher than the number of unique patients who were suspected of having cancer.
Closed pathway data does not include clinical suspensions and for this reason, the data is only comparable with the historical single cancer pathway data collection for the number and percentage of patient pathways starting treatment within 62 days without suspensions.
A number of wider measures from the suspected cancer pathway produced by Digital Health and Care Wales are published alongside this statistical release, to provide more context to the activity and performance of cancer services in Wales.
Activity
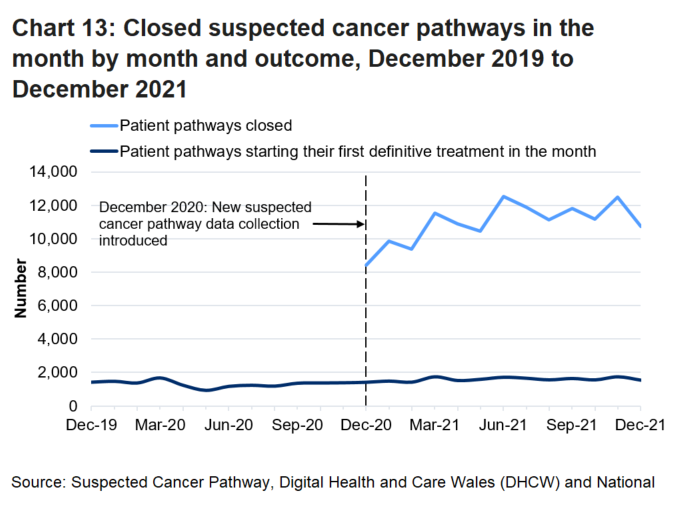
Suspected cancer pathway (closed pathways) on StatsWales
Prior to the COVID-19 pandemic, and from when suspected cancer pathway data was first collected in June 2019, on average there were just under 1,500 patient pathways starting their first definitive treatment per month. This number fell at the start of the pandemic to a low point of 925 in May 2020 but has generally been on an upward trend since and in recent months has been in-line with or exceeded activity levels for the corresponding months in 2019.
In December 2021, 1,554 pathways where patients newly diagnosed with cancer started their first definitive treatment in the month. This is a decrease of 11.8% from November 2021 but an increase of 8.7% from December 2019.
In December 2021, 10,718 pathways closed, following the patient being informed they did not have cancer. This is a decrease of 14.1% compared to November 2021.
In December 2021, 11,837 patient pathways were opened following a new suspicion of cancer.
Performance
Target
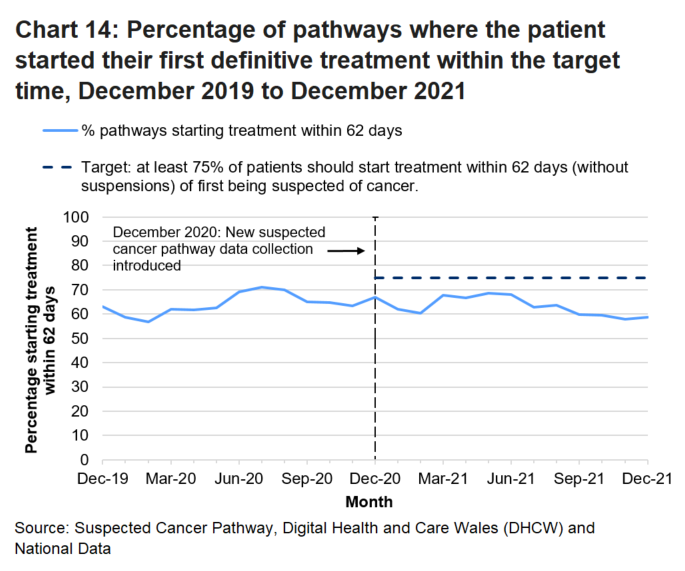
- At least 75% of patients should start treatment within 62 days (without suspensions) of first being suspected of cancer. Data published for time periods before December 2020 are not subject to the target.
Suspected cancer pathway (closed pathways) on StatsWales
The percentage of pathways where the patient started treatment within 62 days of first being suspected of cancer improved slightly during the initial few months of the pandemic, peaking in July 2020, which coincided with fewer patients entering the suspected cancer pathway.
In December 2021, 58.6% (911 out of 1,554) of pathways where patients newly diagnosed with cancer started their first definitive treatment in the month within 62 days of first being suspected of cancer. This was the third lowest on record since comparable data was first collected in June 2019. This was 0.7 percentage points higher than November 2021 but 4.6 percentage points lower than December 2019.
Quality information
Formation of Digital Health and Care Wales
On 1 April 2021 the function of NHS Wales Informatics Service was replaced with a new organisation called Digital Health and Care Wales. It was created to take forward digital transformation and provides the national technology and data services needed by patients and clinicians. They operate as a Special Health Authority with an independent Chair and Board. There has been no impact on the data supplied to the Welsh Government for this statistical release.
Data quality during the COVID-19 pandemic
During the COVID-19 pandemic resources across all NHS organisations have been stretched, including those responsible for recording, processing and validating data. This means that some of the data included in this statistical release may not have been subject to the same rigorous validation checks that would normally have occurred prior to the pandemic. While data submitted during the pandemic is of broadly good quality, there are some data specific data quality issues. These include:
- Betsi Cadwaladr health board did not submit data for the number of pathways waiting for therapy services in April 2020. This affects diagnostic and therapy services activity and performance data in that month only.
- Neath Port Talbot hospital was unable to submit blood pressure monitoring, echo cardiogram and heart rhythm sub-specialty data for August and September 2020.
- Princess of Wales hospital was unable to submit consultant, gastroscopy and MRI sub-specialty data for August and September 2020. This affects diagnostic and therapy services activity and performance data in Cwm Taf Morgannwg, Swansea Bay and at a Wales level in those months.
- While referral to treatment waiting lists remain active, clinicians have had to review all patients on the waiting lists at various stages to identify clinical priorities. The amount of validation performed by local health boards on waiting list data has been reduced as the same resources are also focused on supporting the new ways of working. This affects the referral to treatment activity and performance data.
- While not COVID-19 specific, Cwm Taf Morgannwg has not submitted closed pathways data since September 2018 (Cwm Taf health board between September 2018 and March 2019). Therefore closed pathways data only refers to the six other health boards to allow for trend analysis at a national level.
Ambulance response times
During the COVID-19 pandemic emergency response staff have been required to wear additional personal protective equipment which will impact how quickly they can respond to a call. In addition, after an ambulance has been dispatched to the scene, it must then go through additional cleaning processes to prevent the spread of the virus. This results in the vehicle being taken off the road for a time which may also affect response times during this period.
The clinical response model for ambulance services was introduced in Wales from 1 October 2015. The trial, initially scheduled for 12 months, was extended for a further 6 months, but, following receipt of the independent evaluation report commissioned by the Emergency Ambulance Services Committee (EASC), the clinical response model was implemented (February 2017). See the quality report for more details.
There are three overarching call categories.
- Red: Immediately life-threatening (someone is in imminent danger of death, such as a cardiac arrest).
- Amber: Serious, but not immediately life-threatening (patients who will often need treatment to be delivered on the scene, and may then need to be taken to hospital).
- Green: Non urgent (can often be managed by other health services and clinical telephone assessment).
The categorisation of a call is determined by the information given by the caller in response to a set of scripted questions, which is then triaged by the automated Medical Priority Dispatch system (MPDS). Call handlers are allowed up to two minutes to accurately identify both the severity and nature of a patient’s condition (for those calls that are not immediately life threatening). An ambulance or other appropriate resource is dispatched as soon as the severity and condition are identified. In high acuity calls, this may be whilst the caller is still on the line. There are two occasions where the priority of a call could be changed; when new information from the caller is assessed via the MPDS system, or where a nurse or paramedic has gathered further information about the patient’s condition over the phone.
For the purposes of the 8 minute target, the clock starts when the patient’s location and chief complaint has been established.
As part of the continual review of the clinical response model, the Welsh Ambulance Service Trust (WAST) regularly reviews call handling practices and the categorisation of incidents, this means that caution is advised when analysing call volumes by category over time.
An update to call handling practices in May 2019 has resulted in an increase in red incident volume. This is mainly attributed to moving of calls from amber to red where the nature of call was Convulsions/Fitting (Code 12). This change was actioned through WAST’s Clinical Prioritisation group as a result of two developments. The first was a levelling exercise with the National Academy of Emergency of Medical Dispatch which determined that infective breathing was not being picked up at the stage of case entry. This resulted in a change to the questions asked by the call taker and a change to the dispatch code applied. Secondly, a recommendation from the coroner that a caller with continuous or multiple fits for 20 minutes should be automatically be escalated to red.
Therefore, it is not possible to fairly compare red incident volumes prior to this time. Increases in red incident volumes may also impact on performance due to the additional resources required to attend a red incident.
Revisions: Any revisions to the data are noted in the ‘Notes for this month’s publication’ and in the information accompanying the StatsWales cubes each month.
Ambulance services: StatsWales
Ambulance services: Release and quality report
Emergency departments
The term ‘emergency department’ captures activity at major accident and emergency (A&E) departments, other A&E departments and minor injury units (MIUs).
Note that the number of admissions to hospital are based on attendances at only major emergency departments in Wales. This is because admissions to hospital from attendances at minor injuries units are not recorded consistently across Wales.
On 17 November 2020, the Grange University hospital, with a major emergency department, opened in the Aneurin Bevan health board. The Grange University Hospital contains a host of specialist services in one place, including a 24 hour emergency department and assessment unit for major emergencies and resuscitations which could require onward intensive care.
In data referring to December 2020 onwards, both Royal Gwent and Nevill Hall hospitals have been re-classified to “Other emergency department/Minor Injury Units - Other emergency department/Minor Injury Units” following the opening of the Grange University hospital. This category of hospital is defined as all other emergency department/casualty/minor injury units which have designated accommodation for the reception of accident and emergency patients and can be routinely accessed without appointment, but which do not meet the criteria for a major emergency department. This also means that statistics for admissions from major emergency departments will not include admissions from attendances at Royal Gwent or Nevill Hall hospitals from December 2020s data onwards.
Major emergency departments are defined as a 4consultant led service with resuscitation facilities and accommodation for the reception of emergency department patients. Major emergency departments must provide the resuscitation, assessment and treatment of acute illness and injury in patients of all ages, and services must be available continuously 24 hours a day.
During the COVID-19 pandemic, several minor injury units (MIUs) temporarily closed, but some have since reopened. These are Barry hospital (closed in March 2020; reopened in September 2020); Bryn Beryl Hospital (closed in May 2020; reopened in September 2020); Dolgellau and Barmouth District Hospital (closed in April 2020; remains closed); Tywyn & District War Memorial Hospital (closed in June 2020; remains closed); Llandovery Community Hospital (closed in April 2020; remains closed) and Ysbyty Cwm Cynon (closed 8th September 2021; remains closed).
Since 5 August 2020 the CAV24/7 service has been in operation in Cardiff and Vale University Health Board, which affects how services are delivered in its emergency departments. The ‘Phone First’ model encourages patients who think they have an urgent need to attend an emergency department but do not have an immediately life threatening condition to call ahead to be pre-triaged. Depending on the severity of the condition, they may be encouraged to self-care; signposted to a more appropriate service in their local community; or directly booked in to a timeslot in an emergency department if they need further assessment and treatment.
Other health boards are working towards introducing similar services but none are yet in operation.
In terms of measuring the time a patient spends waiting, the clock start time remains unchanged: the time starts when the patient physically arrives at the emergency department. While the service is in its infancy extra validations will be performed on Cardiff and Vale’s data to assess the impact of the changes. To date, neither the level of activity or performance against the two emergency department targets has changed markedly since the service was introduced.
Alongside these National Statistics three new measures have been developed as part of the Emergency Department Quality Delivery Framework (EDQDF). This framework developed a broader range of measures, to provide more context about delivery of care in emergency departments. These include measures on the time from patient arrival to triage, the time from patient arrival to contact with a clinical decision maker, and analysis of the patient’s discharge destination when they leave the emergency department.
As the datasets and data collection processes for these measures are developed, they are published as management information on the National Collaborative Commissioning Unit (NCCU) website on the same day as this publication. Dependent on data being robust and meeting the requirements of the Code of Practice for Statistics, Welsh Government intend to publish these alongside our official statistics, with an experimental statistics status in the first instance.
From March 2021, amendments have been made to the NCCU’s data extraction methodology, meaning their figures for the number of attendances to major emergency departments will match those published in this National Statistics publication. Figures published by NCCU for previous months have also been revised based on their new methodology.
Digital Health and Care Wales provide the data from the Emergency Department Data Set (EDDS). This is a rich source of patient level data on attendances at emergency care facilities in Wales that tends mainly to be used for the performance targets.
Targets: Time spent in emergency departments:
- 95% of new patients should spend less than 4 hours in emergency departments from arrival until admission, transfer or discharge.
- No patient waiting more than 12 hours in emergency departments from arrival until admission, transfer or discharge.
Revisions: Some figures are likely to be revised in future months. Each submission from health boards contains data for up to the last 12 months. This may contain minor revisions to previously published periods. The revised data will be published on StatsWales with the latest month. Any substantial revisions will be footnoted and mentioned in the stats release.
A change to reporting guidance led to the inconsistent implementation of a data standard change notice across health boards in Wales between March 2021 and October 2021. As a result the data published, before the December 2021 statistical release, for both the 4 and 12 hour targets, for these months was not based on a consistent 'clock stop' definition across Wales. As of December 2021, these data have been revised and data for all health boards is now published using the same ‘clock stop’ definition.
The revisions were primarily based on resubmitted data from Aneurin Bevan health board. The changes to the previously published data were at the national level and Aneurin Bevan health board level.
The number of attendances at emergency departments was unaffected.
Comparability and coherence: Figures produced for Wales, Scotland and Northern Ireland are National Statistics. All four UK countries publish information on the time spent in emergency departments/Accident and Emergency (A&E), though this can be labelled under Emergency Department (as in Scotland) or Emergency Care (as in Northern Ireland). The published statistics are not exactly comparable because: they were designed to monitor targets which have developed separately within each country; the provision and classification of unscheduled care services varies across the UK; the systems which collect the data are different.
Time spent in emergency departments: StatsWales
Time spent in emergency departments: Release and quality report
Outpatient referrals
Revisions: From December 2015, the revisions policy is to revise back every 12 months on a monthly basis.
Comparability and coherence: Similar information is available from other parts of the UK but the data is not exactly comparable due to local definitions and standards in each area. Data standards and definitions have been agreed across health boards ensuring that data is collected on a consistent basis across Wales.
Outpatient referrals: StatsWales
Outpatient referrals: Quality report
Diagnostic and Therapy waiting times (DATS)
The increased number of pathways waiting for diagnostics is directly linked to the impact of COVID-19 with all non-urgent outpatient appointments suspended in March 2020 in order to prioritise urgent treatments. In addition, while more services have since restarted, additional infection, prevention and control measures have been implemented that has affected the amount of diagnostic testing activity that can be carried out.
Conversely, the lower level of patient pathways waiting for therapies during the height of the pandemic is in part due to carrying out many of these services virtually. As a result, a higher volume of patients received an appointment than if they were all conducted in-person at a hospital setting.
Note that Betsi Cadwaladr health board did not submit therapies data for April 2020. This affects the number of total patient pathways waiting in the month and data for this month should not be compared with other months, at the Wales level. To give an estimate of the scale of the impact, there were 25,501 pathways waiting in the other six health boards in April 2020, while in the two months either side, there were 7,519 patient pathways waiting in March 2020 and 9,840 in May 2020, in Betsi Cadwaladr.
This will also affect the number and percentage of pathways waiting longer than the target time. Performance data for April 2020 is only representative of the six health boards which provided data for that month. No data has been estimated for the missing data in this release or on StatsWales.
Targets: Waiting times for access to diagnostic and therapy services (operational standards for maximum waiting times):
- The maximum wait for access to specified diagnostic tests is 8 weeks.
- The maximum wait for access to specified therapy services is 14 weeks.
Revisions: Any revisions to the data are noted in the ‘Notes for this month’s publication’ and in the information accompanying the StatsWales cubes each month.
Comparability and coherence: See notes for Referral to Treatment.
Diagnostic and Therapy waiting times: StatsWales
Diagnostic and Therapy waiting times: Release and quality report
Referral to treatment times
A referral to treatment pathway (RTT) covers the time waiting from referral to hospital for treatment and includes time spent waiting for any hospital appointments, tests, scans or other procedures that may be needed before being treated. Definitions of terms used and quality information are in the quality report.
Targets: Referral to treatment times:
- 95% of patients waiting less than 26 weeks from referral to treatment.
- No patients waiting more than 36 weeks for treatment.
Cwm Taf Morgannwg (and Cwm Taf prior to April 2019) have been unable to provide closed pathway data since September 2018 because of IT problems following a software update. Therefore, all numbers and comparisons for closed pathways from the October 2018 release onwards exclude Cwm Taf Morgannwg. The data for Cwm Taf for previous months are available on StatsWales.
At the end of June 2019, Cwm Taf Morgannwg advised the Welsh Government that they thought there was an issue with the reporting of certain RTT waiting lists. They asked the NHS Wales Delivery Unit to carry out a review and this resulted in a total of 1,783 additional patients being added to the RTT waiting list for the publication of July 2019 data in October 2019. In addition, the Delivery Unit also carried out a review of the diagnostic waiting list and found an additional 1,288 patients should have been reported. These patients were also added to the official figures for the end of July 2019 that were reported in October 2019. Whilst the patients were not reported as part of the official statistics they were being reported internally to the health board. Welsh Government has contacted other health boards and has been advised that all waiting lists are being reported as per the Referral to Treatment Guidelines.
Treatments conducted virtually are counted the same as in-person activity, and since the COVID-19 pandemic, a higher volume of treatments have been conducted virtually.
As all non-urgent outpatient appointments were suspended in March 2020 in order to prioritise urgent appointments, the length of waiting times for patients referred for treatment has increased markedly. In addition, while more services have since restarted, additional infection, prevention and control measures have been implemented that has affected the amount of treatment activity that can be carried out.
At present, clinicians are reviewing patients on waiting lists at various stages to identify clinical priorities using the latest Federation of Surgical Specialty Associations – COVID-19 documents clinical prioritisation national clinical guidance. This means that there is greater emphasis on treating patients in order of clinical priority, and can result in patients with lower clinical priority waiting longer. Whilst there has always been an element of clinical priority, the available capacity before the COVID-19 pandemic allowed for patient who had experienced longer waits to be treated sooner. However, since the COVID-19 pandemic, available capacity has reduced substantially.
While referral to treatment waiting lists remain active, the amount of validation performed by local health boards on waiting list data has been reduced as resources are also focused on supporting the new ways of working. Caution should be taken when comparing performance statistics from March 2020 onwards with previous months due to these changes.
Data previously collected via the long-standing PP01W data collection for treatment specialties not included in RTT ceased following an impact assessment.
Revisions: Any revisions to the data are noted in the ‘Notes for this month’s publication’ and in the information accompanying the StatsWales cubes each month.
Comparability and coherence: England, Scotland and Wales publish referral to treatment waiting times that measures the complete patient pathway from initial referral e.g. by a GP, to agreed treatment or discharge, in addition to certain stages of treatment waiting times. Northern Ireland publish waiting times statistics for the inpatient, outpatient and diagnostics stages of treatment that measures waiting times for the different stages of the patient pathway, typically specific waits for outpatient, diagnostic or inpatient treatment, or for specific services such as audiology.
To increase consistency across health board data, all new treatment codes have been amended to their pre-April 2016 equivalents. This has now been actioned for all historic RTT and referrals data. This will be implemented until all health boards are able to report using the new codes consistently. For more information, see this Data Set Change Notice (2014/08).
In relation to referral to treatment waiting times, whilst there are similar concepts in England, Wales and Scotland in terms of measuring waiting times from the receipt of referral by the hospital to the start of treatment, and, the types of patient pathways included, there are distinct differences in the individual rules around measuring waiting times. This is particularly important regarding ‘when the clock stops or pauses’, exemptions, and the specialities covered.
Referral to treatment: StatsWales
Referral to treatment: Release and quality report
Cancer Services
Cancer patients are treated by clinical urgency rather than length of wait. COVID-19 has affected how cancer services are delivered. Health boards have needed to adapt through various means including implementing additional infection, prevention and control measures to ensure they are delivering safe services while reducing the risk of patients contracting COVID-19. This has meant services have been operating at reduced capacity.
The number of patient pathways starting treatment within the target time will also likely to be affected in the months when some patients were shielding and when patient choices were affected by the pandemic.
Suspected cancer pathway
The suspected cancer pathway target is: At least 75% of patients should start their first definitive treatment within 62 days (without suspensions) of first being suspected of cancer. This target was effective from 1 December 2020.
Prior to this date, there were targets for urgent and non-urgent cancer pathways, which are no longer in operation and therefore no new data will be collected or published for these pathways. Between June 2019 and November 2020 a new measure called the single cancer pathway was introduced which was supported by experimental data collected by Welsh Government directly from health boards through an aggregate data collection. Experimental data for closed pathway measures were publish both with and without clinical suspensions. Once the single cancer pathway officially replaced the urgent and non-urgent pathways as the official measure of cancer services in Wales, it was decided that no clinical suspensions should be reported and the pathway was renamed the suspected cancer pathway.
The suspected cancer pathway is supported by a new data collection process. Data is now collected through the National Data Resource (NDR), hosted by Digital Health and Care Wales. Data is published from this source for reference period December 2020 for all closed pathway measures (number of people told they do not have cancer, number of people starting their first definitive treatment, and the number starting their first definitive treatment within the target time). Data is also published for this source for the open pathway measure, number of patient pathways opened for reference period December 2021.
Prior to these dates, cancer data related to the urgent and non-urgent pathways and was collected by Welsh Government through aggregated data collection forms and published in this release. Data collection via this method ceased for closed pathways after the urgent and non-urgent pathways were retired in November 2020. Data for open pathways continued and has been published up until the November 2021 reference period, while open pathway data from the NDR was being developed.
Both open and closed suspected cancer pathway data collected through the NDR process is published as open data on StatsWales. Historic open pathway data collected via aggregate data collection forms is available in spreadsheets on StatsWales, and historic closed pathway data is also published on StatsWales.
While open pathway data collected through the NDR method is broadly similar to the previous aggregate data collection, direct comparisons should not be made between the two sources because the previous method is known to contain many duplicate pathways. This means that the number of pathways opened in months prior to December 2021 should not be directly compared to data from December 2021 onwards.
Closed pathway data collected through the NDR from December 2020 onwards does not include clinical suspensions. For this reason, the data is only comparable with the historical single cancer pathway data collection for the number and percentage of patient pathways starting treatment within 62 days without suspensions.
The closed pathway data presented in this statistical release includes only the patient pathways that start their first definitive treatment or are informed they do not have cancer (downgraded). Data does not include pathways where the patient chooses not to have treatment or pathways where the patient dies before they start their first definitive treatment (regardless of a positive or negative diagnosis of cancer).
Data for the number of patient pathways opened on the suspected cancer pathway are published by local health board, tumour site and month. Work is ongoing to make the data available by source of referral and will be added to the StatsWales table in the coming months.
All new patient pathways are included in open pathway measures regardless of their routes of referral. This includes patient pathways that were referred to secondary care in Wales but may receive treatment outside of NHS Wales (in both a different country and private hospitals) but does not include patient pathways with a recurrence of the original primary cancer.
The suspected cancer pathway provides a more transparent and meaningful method for measuring performance of cancer services, compared to the previous urgent and non-urgent pathways. It does this by measuring the time on the cancer pathway from the point a patient was suspected of having cancer rather than the point at which the decision to treat is made.
For more information on the suspected pathway, see this Data Set Change Notice with these key documents.
Alongside the move to solely reporting on the suspected cancer pathway, a range of wider contextual performance measures have been published by Digital Health and Care Wales. This dashboard is in continuous development and will aim to contain analysis of: the median time to first appointment, the median time for patients to be informed of a positive diagnosis for cancer, and the median number of days to a patient’s first diagnostic test when data are of sufficient quality. Breakdowns by age group and sex are also presented. This data is also published with experimental statistics status.
Revisions: Any revisions to the data are noted in the ‘Notes for this month’s publication’ and in the information accompanying the StatsWales datasets each month.
Comparability and coherence: Other UK countries also measure cancer waiting times. However, the outputs differ in different countries because they are designed to help monitor policies that have been developed separately by each government. Further investigation would be needed to establish whether the definitional differences have a significant impact on the comparability of the data.
A detailed analysis of historical cancer waiting times is also published in an annual statistical release.
Historically, data for Powys for those patients who entered the pathway only showed patients who were later downgraded as not having cancer, and this continues with the suspected cancer pathway collection.
Specialist Child and Adolescent Mental Health Services (sCAMHS)
From 16 June 2021 onwards, data relating to Specialist Child and Adolescent Mental Health Services (sCAMHS) has been published alongside other mental health data as StatsWales open data tables.
Hospital discharge data: discharge pathway delays / Delayed transfers of care (DToC)
At the start of the COVID-19 pandemic, the Welsh Government suspended delayed transfers of care reporting requirements, along with many other datasets. In the interim, Welsh Government introduced the COVID-19 Discharge Requirements, which included an updated discharge process with increased focus on rehabilitation and reablement to improve patient flow and support better outcomes.
The NHS Delivery Unit has been collecting interim weekly delayed discharge data to provide Welsh Government with management information to support the new arrangements. This data does not measure delayed transfers of care in the same way as the previous data collection, and has not been assessed against the standards of the Code of Practice for Statistics and is published as management information.
Data from this interim collection has been published alongside this statistical release for the first time in accompanying spreadsheets, while work to redevelop the formal DToC data collection is ongoing. The first publication of management data covers the period from early July 2020 to end of October 2021, at Wales level, and will include data relating to three types of delays (people awaiting transfer from hospital to recovery pathways, people awaiting transfer out of recovery pathways and on to longer-term care and people awaiting transfer from hospital to longer-term care, bypassing recovery pathways).
Sources
Ambulance response data is provided by the Welsh Ambulance Service NHS Trust (WAST).
All other data summarised here is collected from local health boards by the Digital Health and Care Wales. Full details are provided in the Quality reports for each service area.
Timeliness
Publishing our monthly NHS activity and performance releases on the same day provides users with a more rounded and integrated picture of activity and gives a more coherent view of the NHS in Wales.
Not all datasets have the same processing timelines. To make the data available as soon as we can, we publish the unscheduled care data for, say, October alongside the scheduled care data for September.
Data
Online tool - an interactive online tool has been developed with three sections:
- Demand and activity, for example, emergency departments attendances, ambulance calls, referrals
- Performance, for example, performance against emergency departments targets, RTT etc.
- Context, for example, median time in emergency departments, median ambulance response times, median RTT waits
All charts show the latest five year period, if data has been collected on a comparable basis for that long. Note the exception to this are the ambulance activity and performance charts, where an update to call handling practices in May 2019 appears to have resulted in a change to red incident volume. Therefore, it is not possible to compare red incident volumes prior to this time.
Further detailed datasets can be found, downloaded or accessed through our open data API from StatsWales.
Percentage point changes are calculated using unrounded figures.
Contextual information
Charts presented in the online tool provide additional activity information to complement the NHS performance information shown above.
Some charts include median and mean times. For example, in relation to ambulance response times:
- The median response time is the middle time when all emergency responses are ordered from fastest to slowest, so half of all emergency responses arrive within this time. It is commonly used in preference to the mean, as it is less susceptible to extreme values than the mean.
- The mean response time is the total time taken for all emergency responses divided by the number of emergency responses. The mean is more likely to be affected by those ambulances which take longer to arrive at the scene.
Revisions
Information relating to revisions is presented in the ‘Notes for this month’s publication’ and in the information accompanying the StatsWales datasets each month.
Relevance
What are the potential uses of these statistics?
These statistics will be used in a variety of ways. Some examples of these are:
- advice to Ministers
- to assess, manage and monitor NHS Wales performance against targets
- to inform service improvement projects for areas of focus and opportunities for quality improvement
- by NHS local health boards, to benchmark themselves against other local health boards
- to contribute to news articles on waiting times
- to help determine the service the public may receive from NHS Wales
Who are the key potential users of this data?
These statistics will be useful both within and outside the Welsh Government. Some of the key potential users are:
- Ministers and their advisors
- members of the Welsh Parliament and the Members Research Service in the Welsh Parliament
- local health boards
- local authorities
- The department for Health and Social Services in the Welsh Government and other areas of the Welsh Government
- National Health Service Wales
- Public Health Wales
- the research community
- students, academics and universities
- individual citizens and private companies
- media
The statistics may also be useful for other UK governments
Northern Ireland Executive’s Department of Health, Social Services and Public Safety
Scottish Government
Department of Health in England
Comparability
All four UK countries publish information on a range of NHS performance and activity statistics. The published statistics are not exactly comparable because: they were designed to monitor targets which have developed separately within each country; the provision and classification of unscheduled care services varies across the UK. Statisticians in all four home nations have collaborated as part of the ‘UK Comparative Waiting Times Group’. The aim of the group was to look across published health statistics, in particular waiting times, and compile a comparison of (i) what is measured in each country, (ii) how the statistics are similar and (iii) where they have key differences. That information is available on the Government Statistical Service website. Information on ambulances can be found at:
Ambulance services in Scotland
Ambulance services in Northern Ireland
National Statistics status
Aside from single cancer pathway statistics, the Office for Statistics Regulation has designated all other statistics presented in this release as National Statistics, in accordance with the Statistics and Registration Service Act 2007 and signifying compliance with the Code of Practice for Statistics.
National Statistics status means that our statistics meet the highest standards of trustworthiness, quality and public value, and it is our responsibility to maintain compliance with these standards.
All official statistics should comply with all aspects of the Code of Practice for Statistics. They are awarded National Statistics status following an assessment by the UK Statistics Authority’s regulatory arm. The Authority considers whether the statistics meet the highest standards of Code compliance, including the value they add to public decisions and debate.
It is Welsh Government’s responsibility to maintain compliance with the standards expected of National Statistics. If we become concerned about whether these statistics are still meeting the appropriate standards, we will discuss any concerns with the Authority promptly. National Statistics status can be removed at any point when the highest standards are not maintained, and reinstated when standards are restored.
“NHS Wales Cancer Waiting Times”, “Ambulance Services in Wales”, “Time Spent in NHS Wales Accident and Emergency Departments”, “NHS Referral to Treatment Times”, “NHS Wales Diagnostic & Therapy Services Waiting Times” and “Delayed Transfers of Care in Wales” are National Statistics.
The continued designation of these statistics as National Statistics was confirmed in 2011 following a compliance check by the Office for Statistics Regulation. These statistics last underwent a full assessment against the Code of Practice in 2011.
Experimental Statistics
Statistics relating to the suspected cancer pathway are Experimental Statistics. This is to inform users of the data and its reported statistics are still in a developmental phase and may have issues pertaining to data quality. However, the statistics are still of value provided that users view them in the context of the data quality information provided. As the dataset matures the coverage and the quality of the data being reported will improve enabling the data to become fit for a wider variety of beneficial uses.
These are official statistics which are published in order to involve users and stakeholders in their development and as a means to build in quality at an early stage.
All official statistics should comply with all aspects of the Code of Practice for Official Statistics. They are awarded National Statistics status following an assessment by the UK Statistics Authority’s regulatory arm. The Authority considers whether the statistics meet the highest standards of Code compliance, including the value they add to public decisions and debate.
More information on the use of experimental statistics (Government Statistical Service).
Well-being of Future Generations Act (WFG)
The Well-being of Future Generations Act 2015 is about improving the social, economic, environmental and cultural wellbeing of Wales. The Act puts in place seven wellbeing goals for Wales. These are for a more equal, prosperous, resilient, healthier and globally responsible Wales, with cohesive communities and a vibrant culture and thriving Welsh language. Under section (10)(1) of the Act, the Welsh Ministers must (a) publish indicators (“national indicators”) that must be applied for the purpose of measuring progress towards the achievement of the wellbeing goals, and (b) lay a copy of the national indicators before Senedd Cymru. Under section 10(8) of the Well-being of Future Generations Act, where the Welsh Ministers revise the national indicators, they must as soon as reasonably practicable (a) publish the indicators as revised and (b) lay a copy of them before the Senedd. These national indicators were laid before the Senedd in 2021. The indicators laid on 14 December 2021 replace the set laid on 16 March 2016.
Information on the indicators, along with narratives for each of the wellbeing goals and associated technical information is available in the Wellbeing of Wales report.
Further information on the Well-being of Future Generations (Wales) Act 2015.
The statistics included in this release could also provide supporting narrative to the national indicators and be used by public services boards in relation to their local wellbeing assessments and local wellbeing plans.
Next update
24 March 2022
We want your feedback
We welcome any feedback on any aspect of these statistics which can be provided by email to stats.healthinfo@gov.wales.
Contact details
Statistician: Rhys Strafford
Telephone: 0300 025 0058
Email: stats.healthinfo@gov.wales
Media: 0300 025 8099
SFR 52/2022