NHS activity and performance summary: August and September 2020
A summary of NHS Wales activity data, including information on A&E attendances, emergency calls to the ambulance service and patients starting cancer treatment for August and September 2020.
In this page
This statistical release provides a summary of NHS Wales activity data, including the latest available monthly information on A&E attendances, emergency calls to the ambulance service, referrals for first outpatient appointments and patients starting cancer treatment.
Note that data included in this statistical release covers a time period during the coronavirus (COVID-19) pandemic, which has affected both how some NHS services are offered and people's choices regarding health services. As a result this will have an effect on the statistics presented within this release.
This months’ release will only include information on NHS Wales activity. Therefore it will not include data relating to performance information or any information relating to referral to treatment times (RTT), diagnostic and therapy waiting times (DATS), delayed transfers of care (DTOC), or closed pathways.
Publishing our monthly NHS activity releases on the same day provides users with a more rounded and integrated picture of activity and gives a more coherent view of the NHS in Wales. Data in each topic area is available in more detail on our StatsWales tables.
New data relating to calls to the ambulance service and accident and emergency (A&E) attendances and admissions are provided for the month of September 2020. New data relating to referrals for first outpatient appointments and patients starting cancer treatment are provided for the month of August 2020.
Future publication plans
Following the announcement on Friday 13 March regarding the cancellation of certain medical procedures and the relaxation of performance targets, several national data collections temporarily ceased and performance statistics have not been included in this release since the March publication . As the majority of data collections have now resumed, publication of performance data will recommence in the next statistical release, pre-announced for 19 November. This will include data for the latest month (October for unscheduled care and September for scheduled) and for all months since publication had stopped, excluding data relating to delayed transfers of care. Additional information on resumption of publishing performance statistics and planned changes to performance statistics are included in this release.
During the COVID-19 pandemic, the assurance and accountability requirements for local health boards have changed to reflect the immediate needs of safety. The data planned for publication in November will continue to be used for management information and to provide assurance against the delivery of local health board quarterly plans.
1. Unscheduled care activity
Emergency calls to the ambulance service
Emergency ambulance calls and responses to red calls, by local health board and month on StatsWales
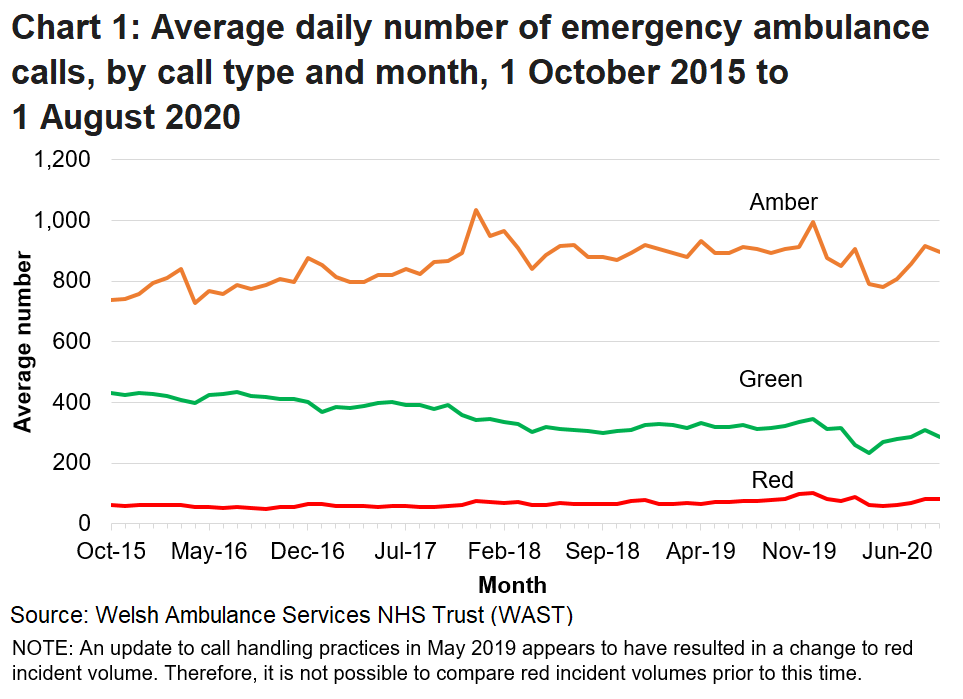
In September 2020, 37,933 emergency calls were made to the ambulance service and on average there were 1,264 calls per day.
The total number of emergency calls received by the Welsh Ambulance Services NHS Trust (WAST) had been rising steadily over the longer term. Since monthly data collections started in April 2006, average daily calls have risen from under 1,000 a day to between 1,200 and 1,450 a day. However, call volumes reduced during the early part of the COVID-19 pandemic, with April 2020 having the fewest daily average number of calls since May 2011.
Following an increase of 8.1% (or 97 calls per day more on average) in August, the number of calls fell in September (3.1% lower, or 40 calls per day fewer on average) compared to the previous month.
When looking at each call category, the longer term trend shows a decreasing number of calls per day in the least urgent (green) category and an increasing number of calls per day in the amber category. Calls for both categories fell during the early part of the COVID-19 pandemic, but both are now similar to pre-COVID 19 levels.
The average number of green calls per day in September 2020 was 286 compared to 317 in September 2019, while the average number of amber calls per day in September 2020 was 897 compared to 894 in September 2019.
The average number of the most urgent (red) calls per day also decreased during the early part of the COVID-19 pandemic but have returned to their pre-COVID 19 level.
The average daily number of red calls in September 2020 was 81. This is down from 83 in August 2020 but up from 78 in September 2019.
The proportion of all calls that were categorised as red calls was 6.4%, up from 6.0% in September 2020.
A&E attendances & admissions to hospital
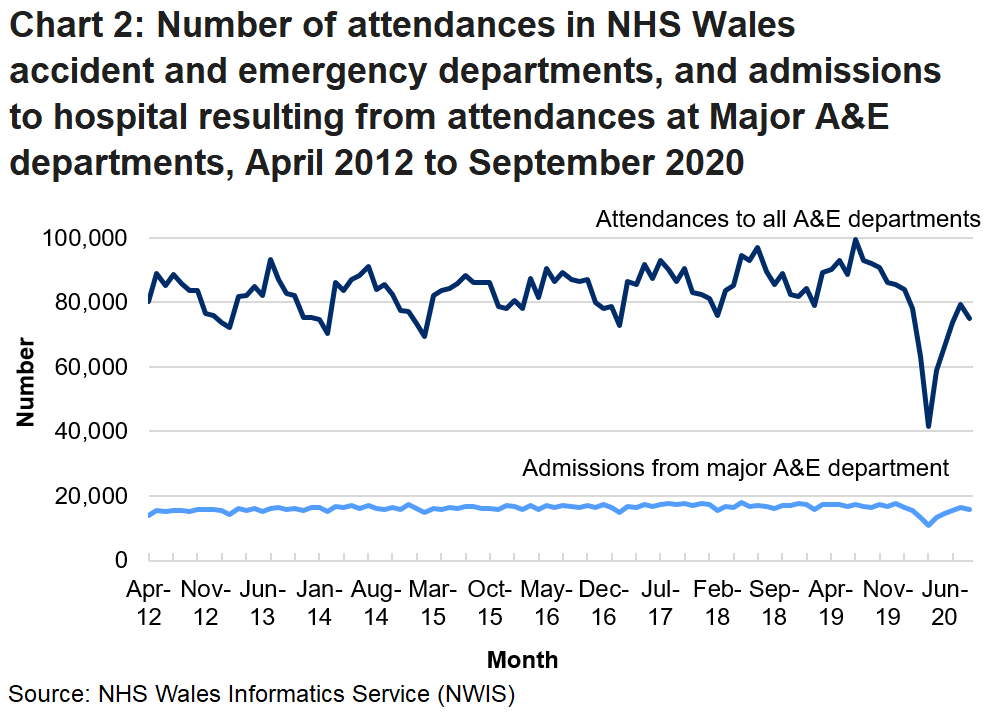
The line for attendances in Chart 2 shows the number of attendances occurring at both major A&E departments and Minor Injuries Units. The line for admissions shows the number of admissions resulting from attending major A&E departments only. Admissions from Minor injuries Units are not recorded on a consistent basis throughout Wales.
A&E attendances are generally higher in the summer months than the winter.
There were 75,090 attendances to all NHS Wales accident and emergency departments in September. Following a significant reduction in attendances in April during the early stages of the COVID-19 pandemic, activity has increased but still remains lower than pre-COVID-19 levels.
Attendances in September 2020 were 5.3% lower than in August 2020 (4,213 fewer attendances) and 18.3% lower than in September 2019 (16,839 fewer attendances).
The average number of A&E attendances per day in September was 2,503. This is 2.2% lower than in August 2020 (55 fewer attendances per day on average) and 18.3% lower than in September 2019 (561 fewer attendances per day on average).
The total number of A&E attendances in the year to September 2020 was 882,108. This is 16.9% lower than the previous year (year ending September 2019) and 9.6% lower than the corresponding 12 month period 5 years ago (year ending September 2015). Annual comparisons are also affected by the impact of the COVID-19 pandemic.
In September, 15,867 patients were admitted to the same or a different hospital following attendance at a major A&E department. This is 2.7% lower (447 fewer admissions) than the previous month (August 2020) and is 2.8% lower (459 fewer admissions) than the corresponding month a year ago (September 2019).
Prior to the COVID-19 pandemic, around 24% of all attendances to major A&E sites resulted in the patient being admitted to hospital. During the early stages of the pandemic, this percentage increased to a peak of 30.8% in April 2020, but there has been a downward trend since then and was 25.9% in September 2020.
Future plans for emergency department data are outlined in the publication of performance data section.
2. Scheduled care activity
Outpatient referrals
Outpatient referrals on StatsWales
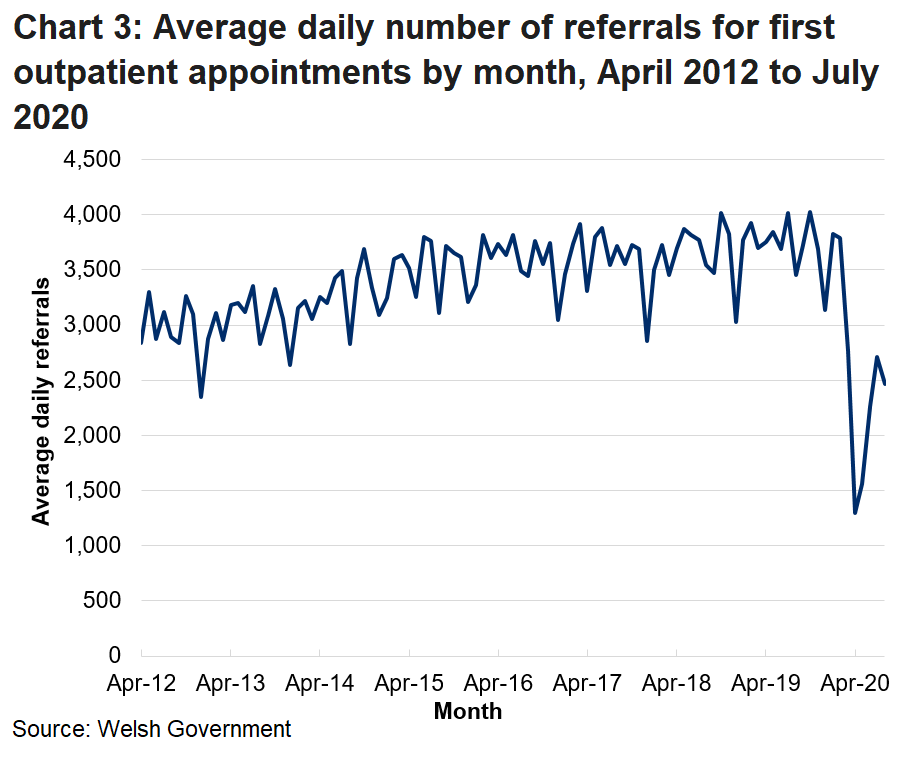
There was a large reduction in the number of referrals for first outpatient appointments in March 2020, during the early weeks of the COVID-19 pandemic. Activity has increased in the months since, but as of August 2020, referrals for first appointments remain lower than pre-COVID-19 pandemic level.
There was an average of 2,470 outpatient referrals per day in August 2020. This is a decrease of 8.9% (242 fewer referrals per day on average) compared to July 2020 and a decrease of 28.5% (985 fewer referrals per day on average) compared with August 2019.
Hywel Dda did not submit any data for mental health treatment codes in August 2020.
Patients starting cancer treatment referred via both the urgent and not via the urgent suspected cancer routes
Cancer patients in Wales are counted by both the urgent and not via the urgent pathways, as well as the single cancer pathway.
Cancer waiting times monthly on StatsWales
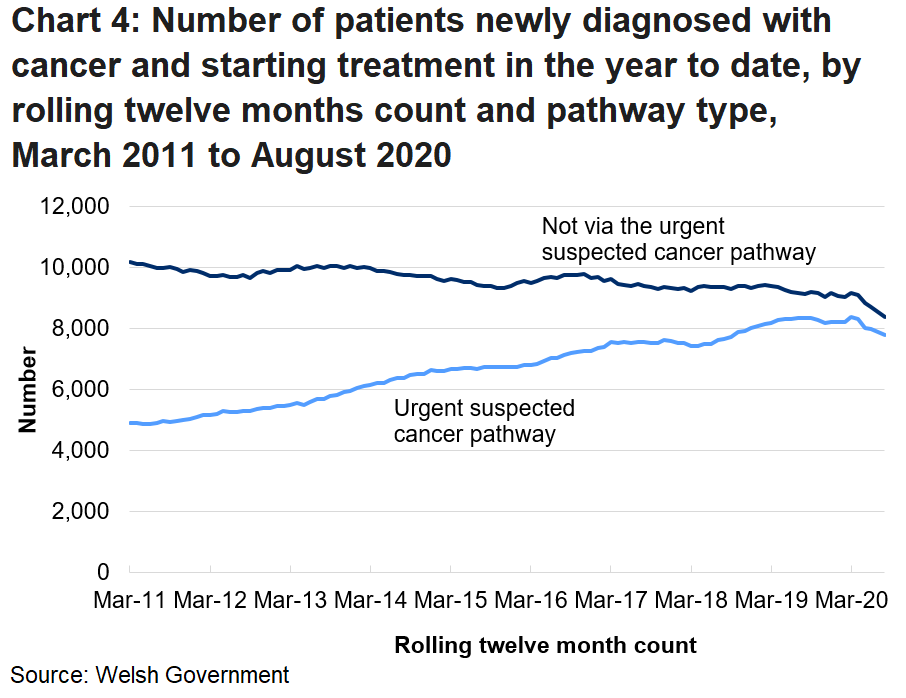
During the 12 months to August 2020, 7,784 patients newly diagnosed with cancer via the urgent suspected cancer route started treatment. This is a decrease of 6.9% (577 patients) since the previous 12 months (year ending August 2019) but an increase of 15.6% (1,048 patients) from the corresponding period 5 years ago (year ending August 2015).
During the 12 months to August 2020, 8,380 patients newly diagnosed with cancer not via the urgent suspected cancer route started treatment. This is a decrease of 8.3% (761 patients) since the previous 12 months (year ending August 2019) and a decrease of 11.0% (1,032 patients) from the corresponding period 5 years ago (year ending August 2015).
As these figures are based on a 12 month rolling average the full impact of the COVID-19 pandemic may not be noticeable until later in the year.
Single cancer pathway (experimental statistics)
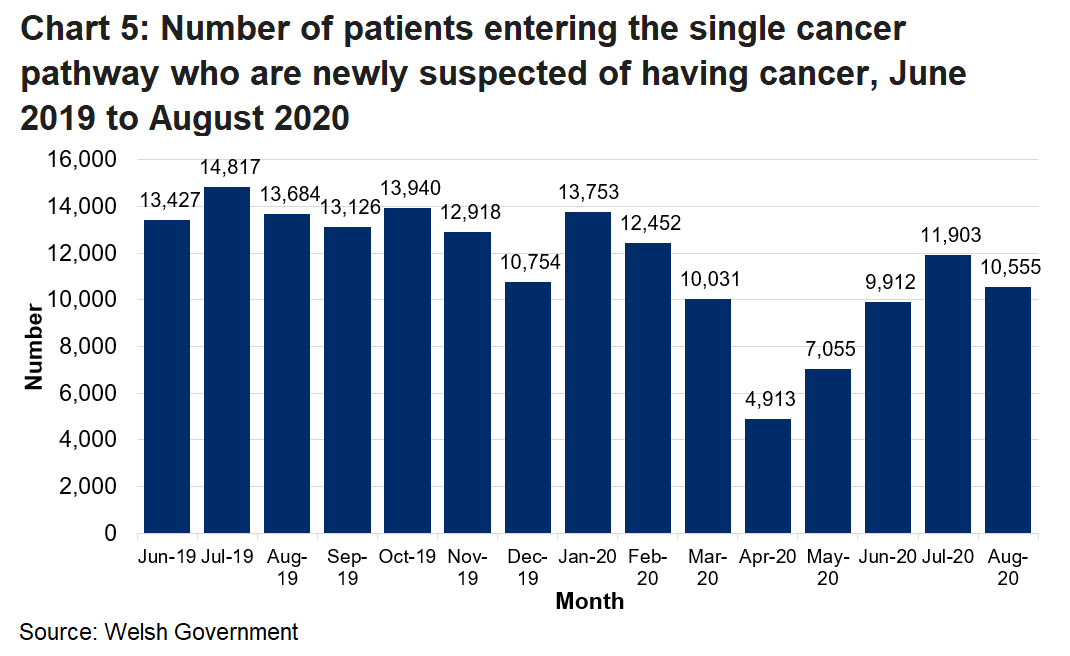
Patients entering the single cancer pathway are counted from the moment there is a suspicion of cancer, rather than from when their referral is received in hospital and a diagnosis has been made.
Experimental statistics for the single cancer pathway show that in the month of August 2020, 10,555 patients entered the pathway. This is a decrease of 11.3% (1,348 fewer patients) from July 2020 and a decrease of 22.9% (3,129 fewer patients) than in August 2019.
For the single cancer pathway, data relating to the number of patients treated is published on StatsWales and includes those patients treated via the urgent and not via the urgent suspected cancer pathways.
In August 2020, 1,186 patients newly diagnosed with cancer were treated through the single cancer pathway. This is a decrease of 4.3% (53 fewer patients) from July 2020 and a decrease of 18.0% (260 fewer patients) than in August 2019.
Future plans for cancer data are outlined in the publication of performance data section.
3. Publication of performance data
For data collections that have now resumed, publication of NHS performance data will recommence in the next statistical release, pre-announced for 19 November 2020. From that point, performance data will be published routinely every month, subject to any changes to future performance measures.
Specifically this means that we will be publishing new data for:
Ambulance services (March 2020 to October 2020)
- Minute-by-minute response times for red calls, including the 8 minute target.
- Minute-by-minute response times for amber calls.
- Mean and median response times to red calls.
- Ambulance quality indicators (January 2020 – September 2020).
Emergency Departments (A&E) (March 2020 to October 2020)
- Number and percentage of patients seen within the 4 hour target time.
- Number and percentage of patients seen within 8 hours.
- Number and percentage of patients seen within the 12 hour target time.
- Mean and median length of waits at emergency departments.
Cancer services (February 2020 to September 2020)
- Number and percentage of patients newly diagnosed with cancer via the urgent suspected route starting treatment within the 62 day target time.
- Number and percentage of patients newly diagnosed with cancer not via the urgent suspected route starting treatment within the 31 day target time.
- Number and percentage of patients entering the single cancer pathway, newly diagnosed with cancer and starting treatment within 62 days (including suspensions).
Referral to treatment time (February 2020 to September 2020)
- Patient pathways waiting to start treatment.
- Patient pathways waiting to start treatment within the target time.
- Closed patient pathways by the number of weeks waited.
- Percentage of patient pathways closed.
- Median waiting times for referral to treatment
Diagnostic and therapy services (February 2020 to September 2020)
- Patient pathways waiting to start treatment.
- Patient pathways waiting to start treatment within the target time.
- Median waiting times for diagnostic and therapy services.
Specialty treatments not covered by referral to treatment times data (also referred to as non-RTT data) (February 2020 – September 2020)
- Patient pathways waiting to start treatment by specialty type.
The data collection has not been restarted in its pre-COVID-19 format, therefore no new data will be published.
Changes to NHS performance data in future months
In the coming months there are several changes planned for how performance is measured in NHS services. This will have a direct effect on the statistics published in this release. As plans become more developed, additional details will be included in the monthly NHS activity and performance statistical release. We welcome feedback on these plans. Currently, the planned changes are as follows.
Cancer services
As noted in previous statistical releases, there has been a long-time aim to replace the current cancer performance measures – the urgent and non-urgent cancer pathways – with a single cancer pathway measurement. The single cancer pathway provides a more transparent and meaningful method for measuring performance of cancer services. It does this by measuring the time on the cancer pathway from the point they were suspected of having cancer rather than the point at which the decision to treat is made. At present over half of cancer patients are on the non-urgent pathway and their cancer wait only commences part the way through the pathway rather than at the start.
Experimental data for the single cancer pathway (with suspensions) has been collected and published since June 2019.
Providing that data is robust enough to meet the standards laid out in the Code of Practice for Statistics, from the January 2021 reporting period (statistical release published in March 2021) all cancer performance data published in this release will refer to only the single cancer pathway. Publication of data on the urgent and non-urgent pathways will cease at this point.
Note that the current data published on the single cancer pathway includes suspensions. This means that the waiting time can be adjusted for various reasons, such as the patient declines an appointment, or is not well enough to attend an appointment. It is likely that the data to be published from the January 2021 reporting period will not include most of these suspensions, and is therefore not likely to be directly comparable. The first publication of these statistics will be classed as experimental and more details on the specific definition will be published prior to its first publication.
Alongside the move to solely reporting on the single cancer pathway, a range of wider contextual performance measures are in development. These are being brought together by using the National Data Resource at NWIS and are planned to be published as experimental statistics, on a quarterly basis, around the same time as the move to the single cancer pathway.
Emergency departments (A&E)
Alongside the official statistics three new measures have been developed as part of the Emergency Department Quality Delivery Framework programme. This programme has developed a broader range of measures, to provide more context about delivery of care in emergency departments. These will include measures on the time from patient arrival to triage, the time from patient arrival to contact with a clinical decision maker, and analysis of the patient’s discharge destination when they leave the emergency department.
As the datasets and data collection processes for these new measures are developed, they will be published as management information on the National Collaborative Commissioning Unit website. Dependent on data being robust and meeting the requirements of the Code of Practice for Statistics, Welsh Government intend to publish these alongside our official statistics in early 2021, with an experimental statistics badge in the first instance.
Delayed transfers of care
At the start of the pandemic, the Welsh Government suspended delayed transfers of care reporting requirements, along with many other datasets. In the interim, Welsh Government introduced the COVID-19 Discharge Requirements, which included a new discharge process with increased focus on rehabilitation and reablement.
Policy colleagues and the NHS Delivery Unit have been collecting interim weekly delayed discharge data to manage the new arrangements. This data does not measure delayed transfers of care in the same way as the previous data collection, and has not been assessed against the standards of the Code of Practice for Statistics. Options for future collection and publication of data and performance measures will be developed over the coming months.
Specialty treatments not covered by referral to treatment times data (also referred to as non-RTT data)
These data are collected from the long-standing PP01W data collection form and includes specialist treatments relating to mental health, dentistry and palliative medicine.
It has been identified that the definitions and methods for data collection used in PP01W are outdated and no longer fit for purpose. It is therefore planned that no data will be published from this data collection following the September reporting period, in the November statistical release. The data collection itself may cease subject to an impact assessment.
Specialist children’s and adolescent mental health services (sCAMHS) data has been collected using management information since April 2018 following issues identified with the PP01W data collection. Data for sCAMHS will continue to be collected and published on this basis over the short term, before a new data collection is developed. It is planned sCAMHS data will then be published alongside other mental health data once the new process is established, with a target time of spring 2021.
4. Quality information
Ambulance response times
As part of the continual review of the clinical response model, the Welsh Ambulance Service regularly reviews call handling practices and the categorisation of incidents. An update to call handling practices in May 2019 appears to have resulted in a change to red incident volume. Therefore, it is not possible to compare red incident volumes prior to this time. Increases in red incident volumes may also impact on performance due to the additional resources required to attend a red incident.
As announced in a statement by the Deputy Minister for Health, a new clinical response model was implemented in Wales from 1 October 2015. The trial, initially scheduled for 12 months, was extended for a further 6 months, but, following receipt of the independent evaluation report commissioned by the Emergency Ambulance Services Committee (EASC), the clinical response model was implemented (February 2017). See the Quality report for more details.
Call categories
Red: immediately life-threatening (someone is in imminent danger of death, such as a cardiac arrest).
Amber: serious, but not immediately life-threatening (patients who will often need treatment to be delivered on the scene, and may then need to be taken to hospital).
Green: non urgent (can often be managed by other health services and clinical telephone assessment).
The categorisation of a call is determined by the information given by the caller in response to a set of scripted questions, which is then triaged by the automated Medical Priority Dispatch system (MPDS). Call handlers are allowed up to two minutes to accurately identify both the severity and nature of a patient’s condition (for those calls that are not immediately life threatening). An ambulance or other appropriate resource is dispatched as soon as the severity and condition are identified. In high acuity calls, this may be whilst the caller is still on the line. There are two occasions where the priority of a call could be changed; when new information from the caller is assessed via the MPDS system, or where a nurse or paramedic has gathered further information about the patient’s condition over the phone.
Revisions: Any revisions to the data are noted in the ‘Notes for this month’s publication’ and in the information accompanying the StatsWales cubes each month.
Ambulance services: StatsWales
Ambulance services: quality report
Ambulance services: Annual release
Accident and Emergency (A&E)
The Accident and Emergency statistics show monthly data on the number of attendances and admissions to hospital resulting from attendances at Major A&E departments in Wales. There are two categories of emergency care facility, Major A&E Departments and Other A&E/Minor Injury Units. Major A&E Departments are defined as a consultant led service with resuscitation facilities and accommodation for the reception of A&E patients. Major A&E Departments must provide the resuscitation, assessment and treatment of acute illness and injury in patients of all ages, and services must be available continuously 24 hours a day. Other A&E/Minor Injury Units are defined as all other A&E/casualty/minor injury units, which have accommodation to receive A&E patients and can be accessed without appointment.
During the COVID-19 pandemic, several Minor Injury Units temporarily closed, but some have since reopened. These are Barry hospital (closed in March 2020; reopened in August 2020); Bryn Beryl (closed in May 2020; reopened in August 2020); Dolgellau and Barmouth District Hospital (closed in April 2020; remains closed); Tywyn & District War Memorial Hospital (closed in June 2020; remains closed); and Llandovery (closed in April 2020; remains closed).
Outpatient referrals
Revisions: From December 2015 our revisions policy is to revise back every 12 months on a monthly basis, and perform a full revision of referral figures back to April 2012 at the end of every financial year (when data for March in any given year is the latest available data to us).
Comparability and coherence: Similar information is available from other parts of the UK but the data is not exactly comparable due to local definitions and standards in each area. Data standards and definitions have been agreed across health boards ensuring that data is collected on a consistent basis across Wales.
Outpatient referrals: StatsWales
Outpatient referrals: quality report
Cancer pathways
Currently, patients with cancer are split into two distinct groups (in line with cancer standards).
Those referred via the urgent suspected cancer route
- This group includes patients referred from primary care (e.g. by a GP) to a hospital as urgent with suspected cancer, which is then confirmed as urgent by the consultant or a designated member of the Multi Disciplinary Team.
Those not referred via the urgent suspected cancer route
- This group includes patients with cancer (regardless of their referral route), not already included as an urgent suspected cancer referral.
These statistics include all patients with cancer, regardless of area of residence, who have started treatment in the reporting period. They do not include Welsh patients with cancer receiving treatment at private hospitals or NHS hospitals outside Wales.
Patients with a recurrence of the original primary cancer are not included.
Powys currently do not submit data on patients with cancer referred via the urgent or non-urgent suspected cancer route since Powys does not provide acute services. Residents from Powys are included in the data submitted from other local health boards.
Data relating to the number of newly diagnosed patients starting treatment and the number of referrals made by cancer treatment route, cancer site and local health board are now available on a monthly basis on StatsWales.
Single Cancer Pathway
The Single Cancer pathway is a new waiting times collection announced in 2018 by Vaughan Gething AM, Cabinet Secretary for Health and Social Services. The statistics include all patients who have suspected cancer. The pathway measures the time from the point of suspicion to the start of treatment, rather than the point of referral.
For more information on the single cancer pathway, please refer to the single cancer pathway key documents.
Sources
- Ambulance response data is provided by the Welsh Ambulance Service NHS Trust (WAST).
- Cancer waiting times data is provided from local health boards directly to the Welsh Government.
- All other data summarised here is collected from local health boards by the NHS Wales informatics Service (NWIS). Full details are provided in the Quality reports for each service area (see links below).
Timeliness
Not all datasets have the same processing timelines. To make the data available as soon as we can, we publish the unscheduled care data for, say, February alongside the planned care data for January.
Data
All charts in this release start at the month at which comparable data was first collected, with the exception of red ambulance calls where an update to call handling practices in May 2019 appears to have resulted in a change to red incident volume. Therefore, it is not possible to compare red incident volumes prior to this time.
Further detailed datasets can be found, downloaded or accessed through our open data API from StatsWales.
Percentage point changes are calculated using unrounded figures.
Revisions
Information relating to revisions is presented in the ‘Notes for this month’s publication’ and in the information accompanying the StatsWales datasets each month.
Relevance
What are the potential uses of these statistics?
These statistics will be used in a variety of ways. Some examples of these are:
- advice to ministers
- to assess, manage and monitor NHS Wales performance against targets
- to inform service improvement projects for areas of focus and opportunities for quality improvement
- by NHS Local Health Boards, to benchmark themselves against other local health boards
- to contribute to news articles on waiting times
- to help determine the service the public may receive from NHS Wales
Who are the key potential users of this data?
These statistics will be useful both within and outside the Welsh Government. Some of the key potential users are:
- ministers and their advisors
- members of the Welsh Parliament and the Members Research Service in the Welsh Parliament
- local health boards
- local authorities
- The department for Health and Social Services in the Welsh Government and other areas of the Welsh Government
- National Health Service Wales
- Public Health Wales
- the research community
- students, academics and universities
- individual citizens and private companies
- media
The statistics may also be useful for other UK governments
Northern Ireland Executive’s Department of Health, Social Services and Public Safety
Scottish Government
Department of Health in England
National Statistics status
The United Kingdom Statistics Authority has designated all statistics presented here as National Statistics, in accordance with the Statistics and Registration Service Act 2007 and signifying compliance with the Code of Practice for Statistics.
National Statistics status means that our statistics meet the highest standards of trustworthiness, quality and public value, and it is our responsibility to maintain compliance with these standards.
All official statistics should comply with all aspects of the Code of Practice for Statistics. They are awarded National Statistics status following an assessment by the UK Statistics Authority’s regulatory arm. The Authority considers whether the statistics meet the highest standards of Code compliance, including the value they add to public decisions and debate.
It is Welsh Government’s responsibility to maintain compliance with the standards expected of National Statistics. If we become concerned about whether these statistics are still meeting the appropriate standards, we will discuss any concerns with the Authority promptly. National Statistics status can be removed at any point when the highest standards are not maintained, and reinstated when standards are restored.
The continued designation of these statistics as National Statistics was confirmed in 2011 following a compliance check by the Office for Statistics Regulation. These statistics last underwent a full assessment against the Code of Practice in 2011.
Experimental statistics
Statistics relating to the Single Cancer Pathway are Experimental Statistics. This is to inform users of the data and its reported statistics are still in a developmental phase and may have issues pertaining to data quality. However, the statistics are still of value provided that users view them in the context of the data quality information provided. As the dataset matures the coverage and the quality of the data being reported will improve enabling the data to become fit for a wider variety of beneficial uses.
These are official statistics which are published in order to involve users and stakeholders in their development and as a means to build in quality at an early stage.
All official statistics should comply with all aspects of the Code of Practice for Official Statistics. They are awarded National Statistics status following an assessment by the UK Statistics Authority’s regulatory arm. The Authority considers whether the statistics meet the highest standards of Code compliance, including the value they add to public decisions and debate.
More information on the use of experimental statistics.
Well-being of Future Generations Act (WFG)
The Well-being of Future Generations Act 2015 is about improving the social, economic, environmental and cultural wellbeing of Wales. The Act puts in place seven wellbeing goals for Wales. These are for a more equal, prosperous, resilient, healthier and globally responsible Wales, with cohesive communities and a vibrant culture and thriving Welsh language. Under section (10)(1) of the Act, the Welsh Ministers must (a) publish indicators ('national indicators') that must be applied for the purpose of measuring progress towards the achievement of the wellbeing goals, and (b) lay a copy of the national indicators before the Welsh Parliament. The 46 national indicators were laid in March 2016.
Information on the indicators, along with narratives for each of the wellbeing goals and associated technical information is available in the Wellbeing of Wales report.
Further information on the Well-being of Future Generations (Wales) Act 2015.
The statistics included in this release could also provide supporting narrative to the national indicators and be used by public services boards in relation to their local wellbeing assessments and local wellbeing plans.
Next update
19 November 2020
We want your feedback
We welcome any feedback on any aspect of these statistics which can be provided by email to stats.healthinfo@gov.wales.
5. Contact details
Statistician: Rhys Strafford
Telephone: 0300 025 0058
Email: stats.healthinfo@gov.wales
Media: 0300 025 8099
![]()
SFR 178/2020