Maternity and birth statistics: 2021
Statistics from antenatal, birth, and child health records including smoking during pregnancy, breastfeeding and birthweights for children born in Wales in 2021.
This file may not be fully accessible.
In this page
Introduction
The purpose of this release is to provide a statistical overview of maternity and births in Wales with analyses of mothers’ characteristics. The data and analyses are used to inform Welsh Government’s maternity policy development.
The official source for the number of births in Wales is published by the Office for National Statistics (ONS), which counts birth registrations. However, this release focusses on statistics for births using data sourced from Maternity Indicators dataset (MI ds) and the National Community Child Health Database (NCCHD), which allow for more detailed analysis than the ONS data.
The Maternity Indicators dataset combines a child’s birth record with their mother’s initial assessment record (where possible). There are some data quality issues with certain data items in this dataset which are highlighted throughout the release.
The National Community Child Health Database consists of anonymised records for all children born, resident or treated in Wales and born after 1987. The database combines data from local Community Child Health System databases which are held by local health boards.
Data on breastfeeding which was published in previous editions of this release will be published in a new statistical release, preannounced for publication on 12 July 2022.
Summary
In 2021 the highest percentage of pregnant women had their initial assessment by their 10th week of pregnancy on record.
The data shows mixed results for healthy lifestyle behaviors at initial assessment with a lower percentage of women self-reporting as smokers, but a higher percentage recorded as obese than in the previous year.
The percentage of women giving up smoking during pregnancy increased sharply, but there are data quality issues with this measure in 2021. There was a greater proportion of missing data than in any other year and nearly all data was self-reported rather than CO monitored, which may impact on the reliability of the data in 2021.
The downward trend in labour starting spontaneously continued, while the upward trend in babies delivered through caesarean section increased to nearly a third of all births.
The number of live births increased marginally; the first year that the number has not fallen since 2010. The percentage of newborns from each ethnic background has remained broadly unchanged since 2018.
The percentage of young mothers continues to fall. Most mothers giving birth in the year were aged between 25 and 34, while there were more mothers aged 40 or older than 19 or younger for the first time on record.
The proportion of births at home was unchanged from the previous year with most births happening at hospital settings.
The percentage of singleton births with low birthweights fell marginally from the previous year. The average birthweight for a singleton birth was a little more than one kilogram heavier than a multiple birth.
A higher percentage of female babies had low birthweights than males, and a higher percentage of babies with Asian ethnic background had low birthweights compared to other ethnicities.
Main points
- 81% of pregnant women received their initial antennal assessment before the end of their 10th week of pregnancy.
- 29% of pregnant women reported that they had a mental health condition at their initial assessment.
- 30% of pregnant women were obese (recorded as having a BMI of 30 or more) at their initial assessment.
- 15% of pregnant women were recorded as being a smoker at their initial assessment.
- 12% of pregnant women were recorded as being smokers at the time they gave birth.
- 26% of women stopped smoking during pregnancy (those who were recorded as being a smoker at initial assessment and then recorded as being a non-smoker at birth).
- 50% of all labours began spontaneously, while a further 33% were induced.
- 59% of babies arrived spontaneously, with 31% arriving via caesarean section.
- There were 28,879 live births, an increase of 0.3% from 2020.
- 89% of births were to mothers of white ethnic background; 4% to mothers of Asian background; 4% to mothers of mixed background; 2% to mothers of black background; and 2% to mothers of other ethnic background.
- 3% of live births were from younger mothers (under 20), the lowest on record.
- 3% of births occurred at home.
- 52% of births occurred within one week either side of the typical expected due date.
- 5.8% of singleton births had low birthweight (less than 2.5kg).
- 59.1% of multiple births (twins and triplets) had low birthweight (less than 2.5kg).
- 6.2% of female singleton births had low birthweight compared to 5.3% of males.
- 8.4% of Asian singleton births had low birthweight compared to 7.0% for black ethnic backgrounds, 6.1% for other ethnicities, 5.7% for white and 5.4% for mixed or multiple ethnicities.
- 25% of births met the Welsh Government clinical definition of a healthy birth.
Antenatal care
Data presented in this section refers to the 26,754 initial assessment records (or pregnancies) included in the Maternity Indicators dataset in 2021.
Initial assessments by gestational age
Early access to maternity services increases the opportunity to promote and improve the health and well-being of pregnant women through early signposting to appropriate services and information. It is an aim that all pregnant women should have their initial assessment by the 10th completed week of gestation.
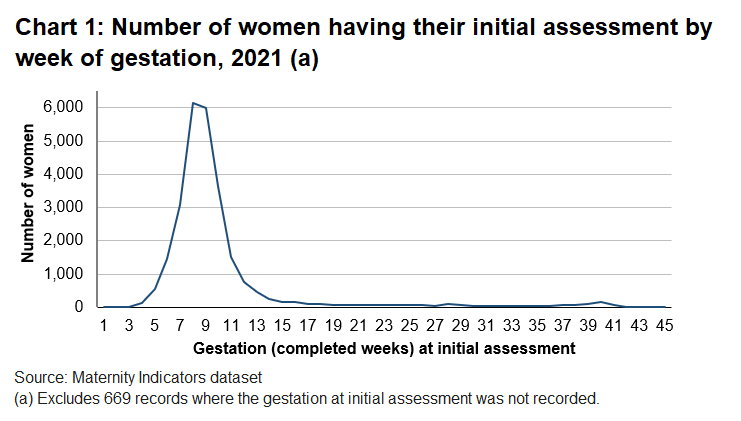
In 2021, at least 81% of pregnant women who had an initial assessment with maternity services had received it by the 10th completed week of pregnancy or earlier. This is five percentage points higher than in 2020.
Additional quality information on this measure is available in the quality and methodology section.
Initial assessment indicators for Wales, by mother's age on StatsWales
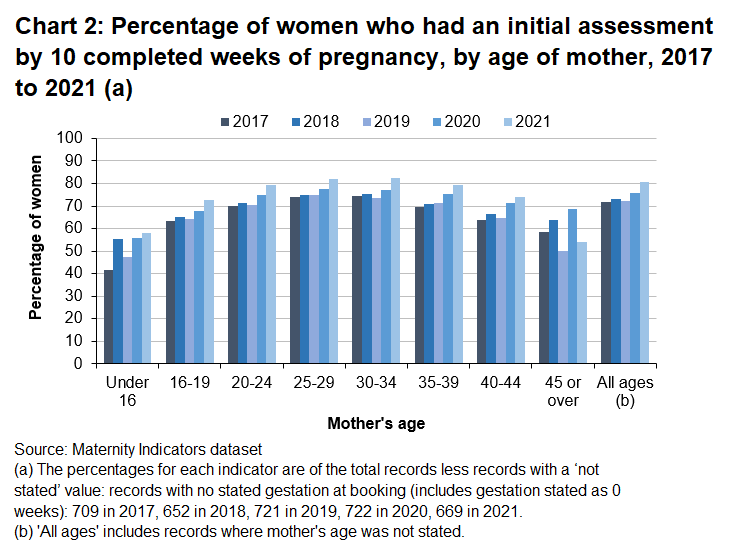
The percentage of pregnant women who had received an initial assessment with maternity services by the end of the 10th completed week of pregnancy was highest for those aged between 20 and 39. Rates were slightly lower for those aged 16 to 19 and 40 to 44 and lower again for the youngest and oldest mothers.
In 2021, a greater percentage of pregnant women had their initial assessments by 10 weeks than in any other year on record, in all age groups apart from those aged 45 and over.
Note that as there are few (less than 100) mothers aged under 16 and 45 or over, there may be large year-to-year changes due to natural volatility.
Mental health
At the initial assessment, pregnant women are asked to complete a questionnaire where they can self-report any mental health conditions they suffer from. The conditions listed on the questionnaire are:
- puerperal psychosis (severe postnatal depression)
- bi-polar effective disorder/manic depression
- psychosis
- psychotic depression
- schizophrenia
- other
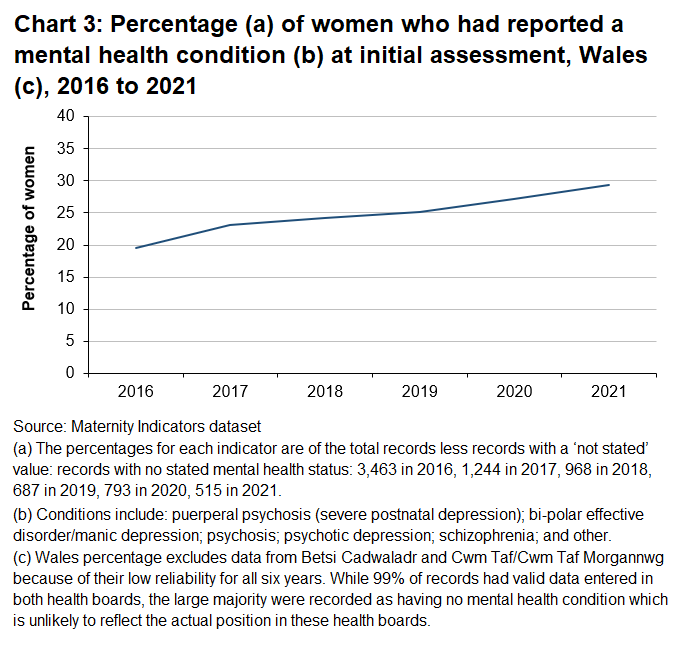
Nearly three out of ten (29%) pregnant women reported a mental health condition at their initial assessment. The longer-term upward trend continued, with the latest data two percentage points higher than in the previous year, and ten percentage points higher than in 2016 (first year of comparable data).
Additional quality information on this measure is available in the quality and methodology section.
Initial assessment indicators for Wales, by mother's age on StatsWales
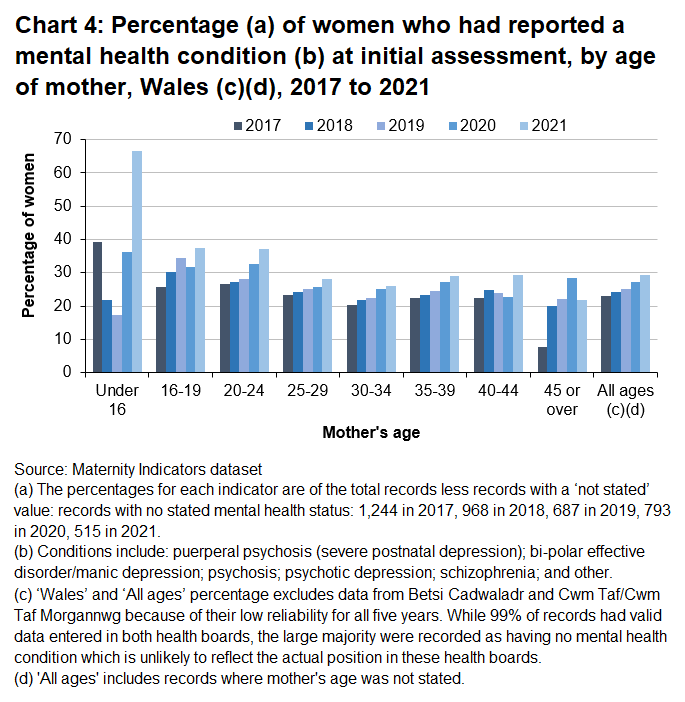
Younger pregnant women (aged 24 or younger) reported a higher percentage of mental health conditions than other age groups. Those aged 30 to 34 reported the lowest percentage of mental health conditions of all age groups where there were more than 100 women.
In 2021, the percentage increased to the highest on record for all age groups other than those aged 45 or over. There were particularly large annual increases for those aged under 24 and between 40 and 44.
Note as there are few (less than 100) mothers aged under 16 and 45 or over, there may be large year-to-year changes due to natural volatility.
Obesity
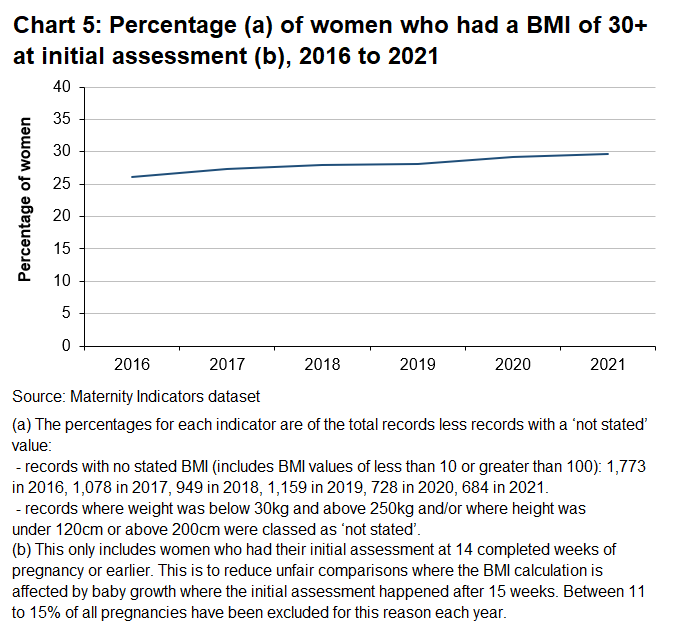
At the initial assessment, mothers have their height and weight measured and their Body Mass Index (BMI) is calculated. A person with a BMI of 30 or greater is considered obese, and obesity increases the risk of many health complications.
BMI at initial assessment, by health board providing the service on StatsWales
Three out of ten (30%) pregnant women had a BMI of 30 or greater at their initial assessment. The longer-term upward trend continued as the percentage in 2021 was one percentage point higher than in the previous year and three percentage points higher than in 2016 (first year of comparable data).
Additional quality information on this measure is available in the quality and methodology section.
Initial assessment indicators for Wales, by mother's age on StatsWales
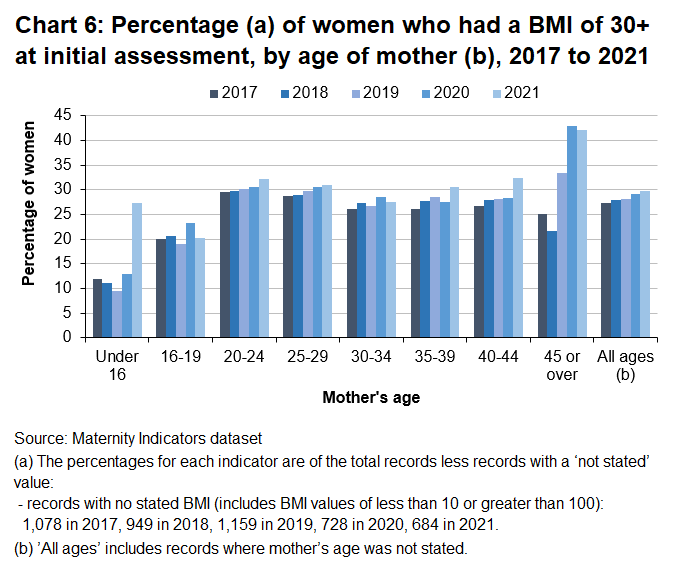
In 2021, there was some variation in the percentage of pregnant women with a BMI of 30 or more between different age groups. Younger pregnant women (aged 19 or younger) had the lowest percentage of BMI 30 or more, while older pregnant women (aged 40 or older) but had the highest.
There was an increase in the percentage of obese pregnant women in most age groups, but there were decreases in the age groups 16 to 19, 30 to 34 and 45 or older. Note as there are few (less than 100) mothers aged under 16 and 45 or over, there may be large year-to-year changes due to natural volatility.
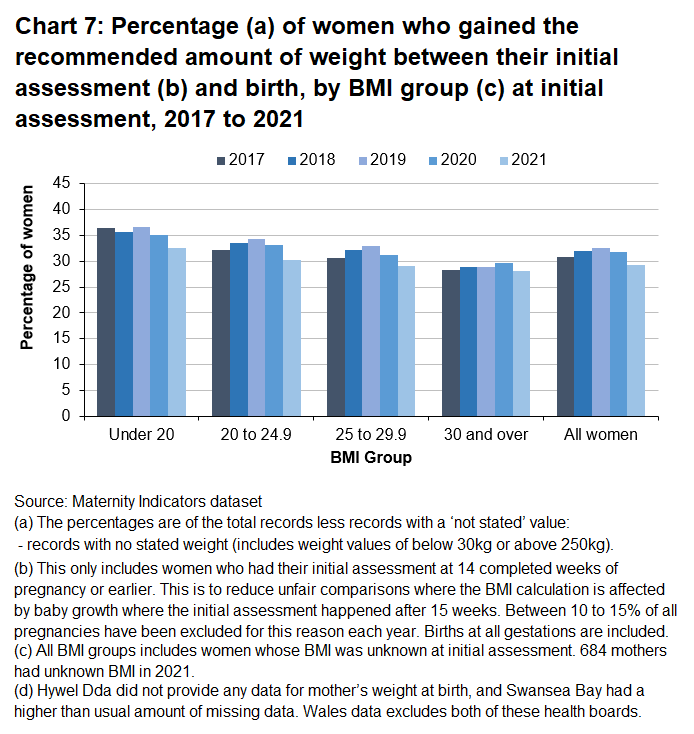
The Institute of Medicine (IOM) guidelines recommends a total weight gain of between 6.8 to 11.3 kg for overweight women (those with a BMI of 25 to 29.9).
29% of women gained the recommended amount of weight between initial assessment and birth in 2021. This was three percentage points lower than the previous year.
The percentage of women who gained no more than the recommended amount of weight during pregnancy was lower for women who had high BMIs at the start of their pregnancy, than women in healthier BMI groups.
Only 61% of records had valid data for all data items needed to calculate the weight gained during pregnancy. As a result of the level of incomplete data, caution is advised when using this statistic. Additional quality information on this measure is available in the quality and methodology section.
Smoking at initial assessment and birth
During the initial assessment and at birth, women are either asked to self-report if they are a smoker or they are tested with a carbon monoxide (CO) monitor.
CO monitoring is considered more accurate than self-reporting, but has been largely suspended since the COVID-19 pandemic started to reduce the risks of spreading the virus.
Smoking at initial assessment and birth, by health board providing the service on StatsWales
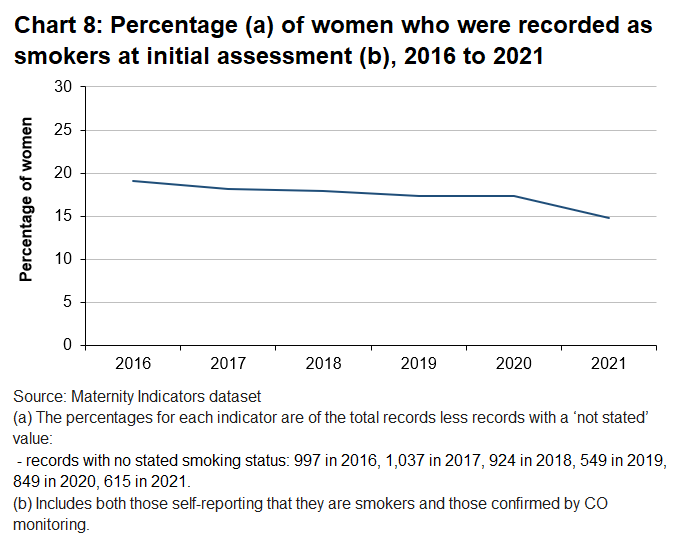
In 2021, 15% of women were recorded as smokers at their initial assessment. This accelerates the downward trend since data was first collected in 2016 and is two percentage points lower than in the previous year. The large decrease in 2021 may be affected by nearly all data being self-reported, rather than being CO monitored.
Additional quality information on this measure is available in the quality and methodology section.
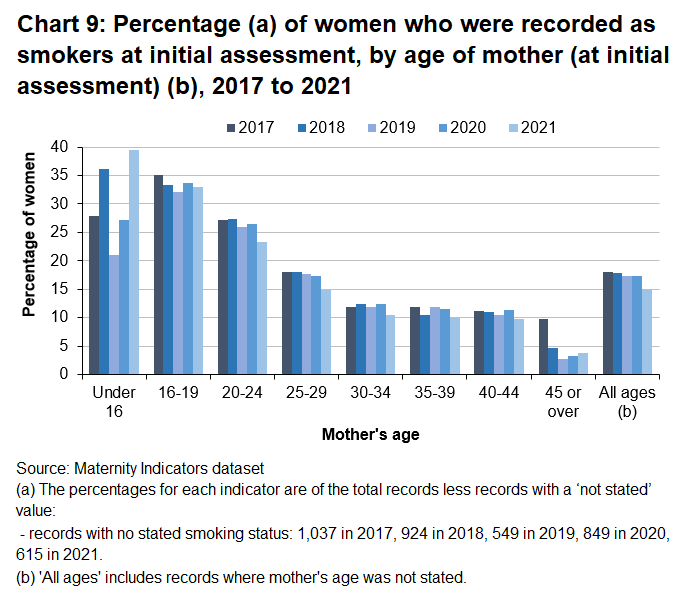
A greater proportion of younger women were smokers at initial assessment than older women. A third (33%) of women aged 16 to 19 were recorded as smokers at initial assessment compared to one in ten (10%) women aged 30 or over.
Smoking rates at initial assessment have fallen over the last five years for all age groups, other than those aged under 16, which is subject to year-to-year volatility due to the low number of women in this group.

Smoking at initial assessment and birth, by health board providing the service on StatsWales
12% of mothers were recorded as being smokers at the time they gave birth 2021. This is five percentage points lower than in the previous year and in contrast to the marginal upward trend between 2018 and 2020. The large decrease in 2021 may be affected by nearly all data being self-reported, rather than being CO monitored.
In addition, the proportion of missing data in 2021 is higher than in previous years; therefore, caution is advised when interpreting this statistic. Additional quality information on this measure is available in the quality and methodology section.
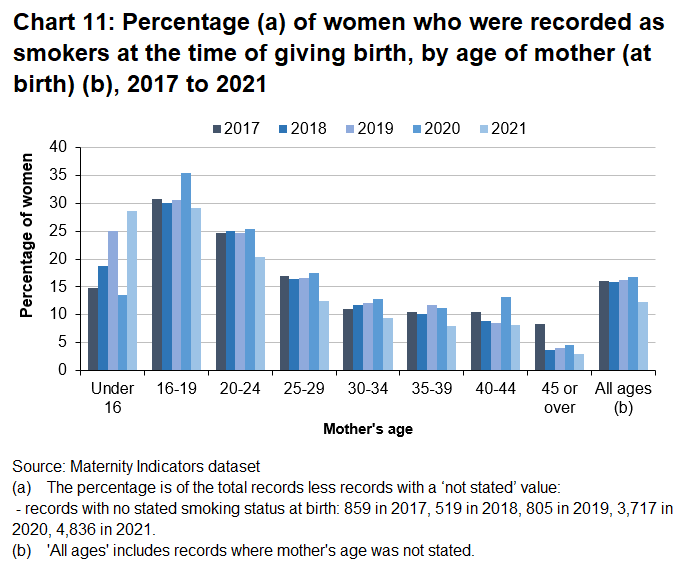
The proportion of women who were recorded as smokers at the time of birth was much higher for younger mothers than older mothers. 29% of mothers aged 19 or younger were smokers compared to less than 10% in each age group from 30 to 34 or older.
Of the age groups where there were more than 100 births, the proportion of women who smoked at birth decreased in every age group compared to the previous year. This is in contrast to the slight upward trend for most age groups in the five years prior to 2021.
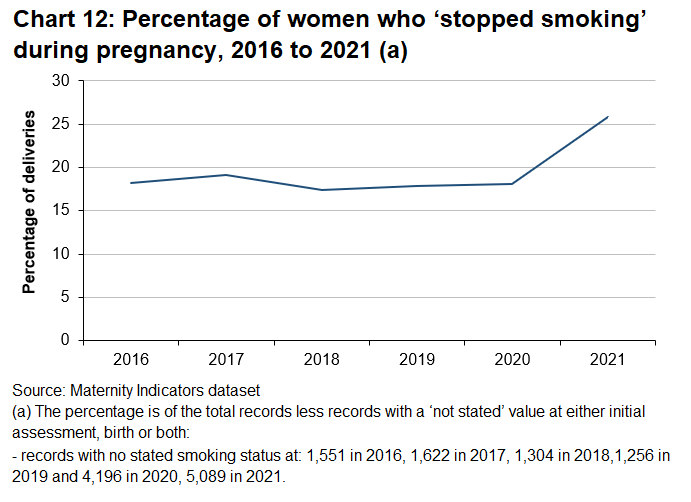
In 2021, 26% of women who were smokers at the initial assessment were not smokers at birth. This is an increase of eight percentage points since the previous year, in contrast to the broadly stable trend of the previous five years. The large increase in 2021 may be affected by nearly all data being self-reported, rather than being CO monitored.
In addition, there was a greater level of incomplete records in 2021 than in previous years; therefore, caution is advised when interpreting the 2021 data. Additional quality information on this measure is available in the quality and methodology section.
Delivery characteristics
Data in this section refers to the 27,657 deliveries recorded in the Maternity Indicators dataset which took place in 2021.
Onset of labour
Onset of labour is the method by which the process of labour began and includes methods that are used to induce labour, such as surgical or medical induction or a combination of the two. Methods that are used to accelerate labour are not included.
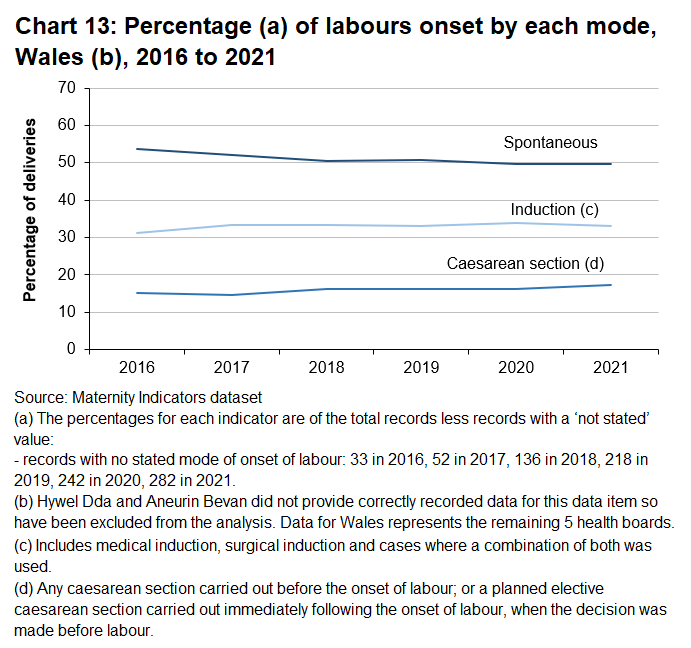
Data was recorded in the Maternity Indicators dataset for every health board; however, in Hywel Dda and Aneurin Bevan health boards, labour onset has not been recorded as ‘caesarean’ when an elective caesarean section birth occurred in all years of data. As a result of this data quality issue, these health boards have been excluded from the analysis for each year. For 2021, the statistics presented at Wales-level are based on the 19,450 deliveries which took place at the remaining five health boards.
Mode of onset of labour by health board providing the service on StatsWales
In 2021, half (50%) of labours began spontaneously. This is the same as the previous year but four percentage points lower than in 2016. Just over a third (34%) of labours were onset by induction and one in six (16%) were onset through caesarean section.
Table 11: Mode of onset of labour by mother's age group, Wales, 2021 (MS Excel)
Pain relief
An epidural is a method of pain relief used for mothers in labour. It involves an injection of a local anaesthetic into the space outside the dura mater of the spinal cord in the lower back region to produce a loss of sensation especially in the abdomen or pelvic region.
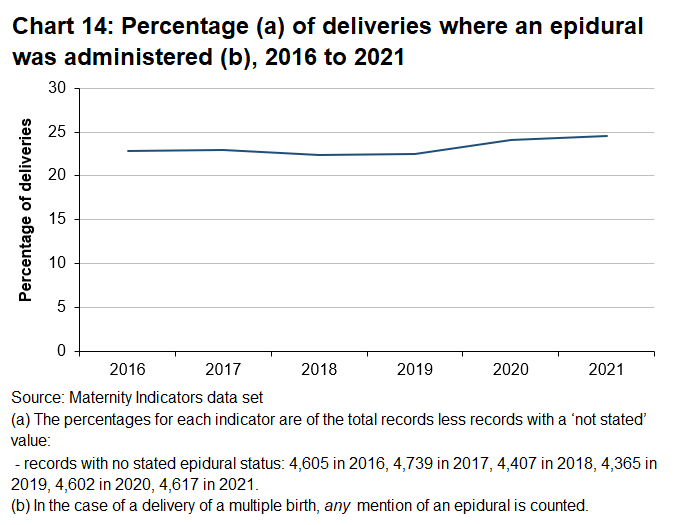
Epidurals by health board providing the service on StatsWales
In 2021, an epidural was administered in a quarter (25%) of deliveries. This is marginally higher than the previous year and two percentage points higher than in 2016.
Additional quality information on this measure is available in the quality and methodology section.
Mode of birth
There are three modes of birth recorded in the Maternity Indicators dataset and they are defined as:
- caesarean section: elective and emergency caesarean section deliveries
- instrumental: forceps cephalic deliveries and ventouse (vacuum) deliveries
- spontaneous vaginal: baby born by maternal effort
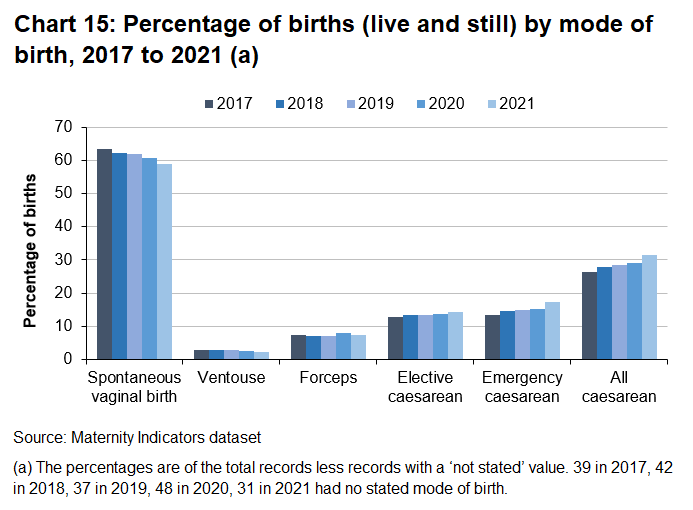
Mode of birth by health board providing the service on StatsWales
In 2021, the majority (59%) of births were spontaneous (unassisted) vaginal births, while nearly a third (31%) were delivered by caesarean section.
The percentage of spontaneous vaginal births has fallen every year since 2017 and dropped below 60% for the first time. The percentage of instrumental births (ventouse or forceps) decreased marginally in 2021, but both emergency and elective caesarean rates increased, continuing their upward trend over the last five years.
Birth outcomes and characteristics
Data presented in this section focusses on the 28,879 live births recorded in the National Community Child Health Database. Births are analysed rather than deliveries, since twins or triplets could be delivered by different means.
Data on the number of antenatal records, deliveries, live births, stillbirths and total births by local health board are provided in Antenatal records, live births and still births by health board providing the service on StatsWales and Table 1: Antenatal records, live births and still births by health board providing the service, 2021 (MS Excel).
Data on births by Welsh and non-Welsh resident mothers are in Table 2: Live births to Welsh and non-Welsh residents by place of birth, 2021 (MS Excel).
Data on deliveries and births by maternity unit are in Table 3: Live births, still births and number of babies by health board providing the service, 2021 (MS Excel).
Number of births
Births can be recorded as singletons (one baby born); multiples (twins, triplets or more babies born) or stillbirths.
| Year | Number of live births: Singletons | Number of live births: Multiples | Number of live births: Total | Number of still births | Total number of births |
|---|---|---|---|---|---|
| 2012 | 34,276 | 1,074 | 35,350 | 168 | 35,518 |
| 2013 | 32,823 | 999 | 33,822 | 151 | 33,973 |
| 2014 | 32,646 | 1,002 | 33,648 | 173 | 33,821 |
| 2015 | 32,318 | 1,043 | 33,361 | 155 | 33,516 |
| 2016 | 32,001 | 1,003 | 33,004 | 163 | 33,167 |
| 2017 | 31,422 | 814 | 32,236 | 151 | 32,387 |
| 2018 | 30,453 | 876 | 31,329 | 141 | 31,470 |
| 2019 | 29,004 | 724 | 29,728 | 126 | 29,854 |
| 2020 | 28,163 | 618 | 28,781 | 103 | 28,884 |
| 2021 | 28,322 | 556 | 28,879 | 128 | 29,007 |
Source: National Community Child Health Database (NCCHD)
Note that valid data has been recorded for outcome of birth in nearly all of births across all health boards and years.
Of the 29,007 births recorded in the National Community Child Health Database in Wales in 2021, over 99% (28,879) were live births. The percentage of multiple births has been on a downward trend since 2015 and was 2% of all live births in 2021.
The number of births increased by less than half a per cent from 2020, but this is the first time the number of births has increased since 2010.
Antenatal records, live births and still births by health board providing the service on StatsWales
Home births
Health boards in Wales provide access to a range of services for women to give birth including home births.
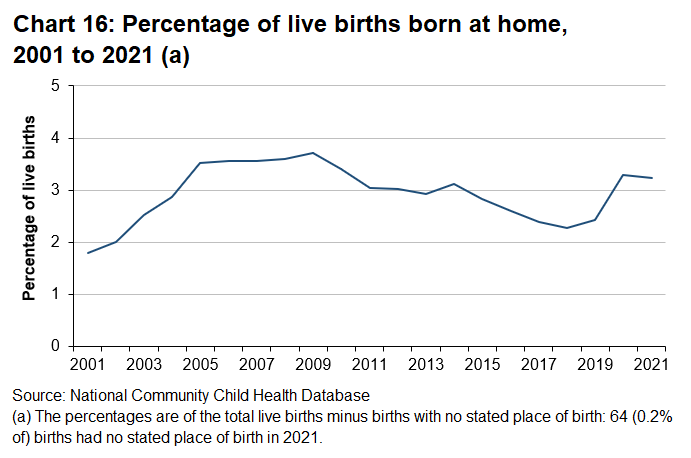
Over the past 20 years, the large majority of births have occurred in hospital settings in Wales. The highest rate of home births on record was in 2009 (3.7%), since then the trend had been downward, until there were increases more recent years.
In 2021, 3.2% of live births happened at home, while 0.2% of births happened in other locations than hospitals or homes.
Live births to Welsh residents by Local Health Board and place of birth on StatsWales
Gestational age
Babies born prematurely or ‘pre-term’ (before 37 weeks of pregnancy) may have a higher risk of immediate or longer-term health problems.
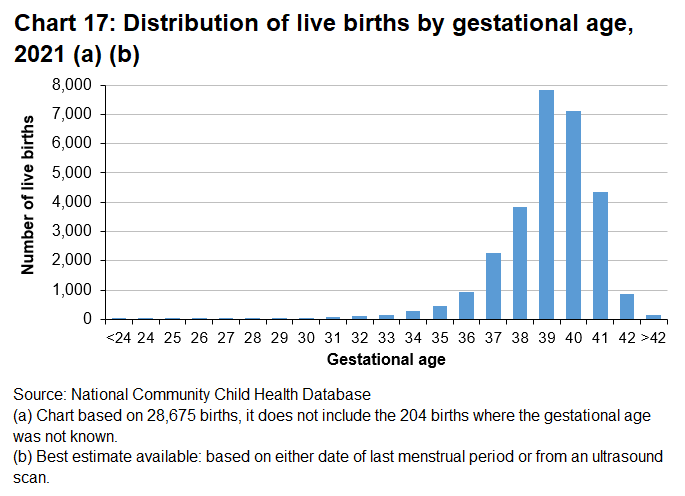
Just over half (52%) of births occurred when the gestational age was 39 or 40 completed weeks (one week either side of the typical expected due date).
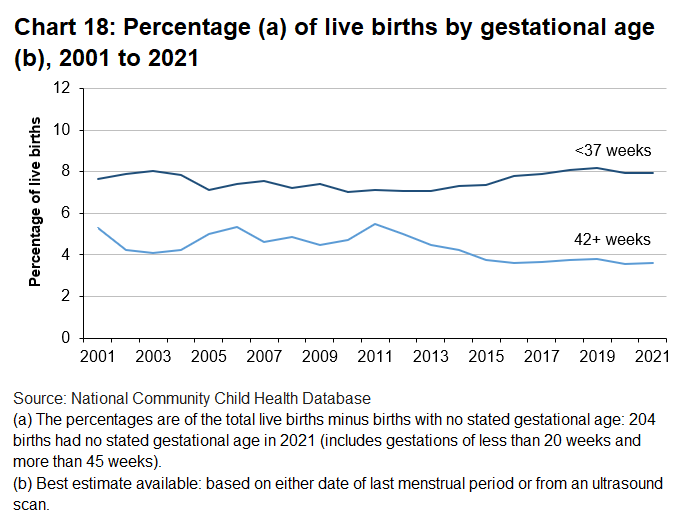
8% of live births occurred at gestation of 36 full weeks or less in 2021. This percentage has been largely unchanged for the past five years.
The longer-term downward trend in the percentage of live births at gestations of 42 weeks or more has stabilised in recent years and was just under 4% in 2021.
Live births to Welsh residents by Local Health Board and gestational age on Statswales
Birthweight
Low birthweight (less than 2.5kg) is associated with health risks in an infant's first year of life.
The percentage of live single births with a birthweight of less than 2.5kg is one of national indicators used to measure progress against the wellbeing goals in the Well-being of Future Generations Act.
Low birthweights are often linked to low gestational age (where the baby is born before 37 weeks of gestation).
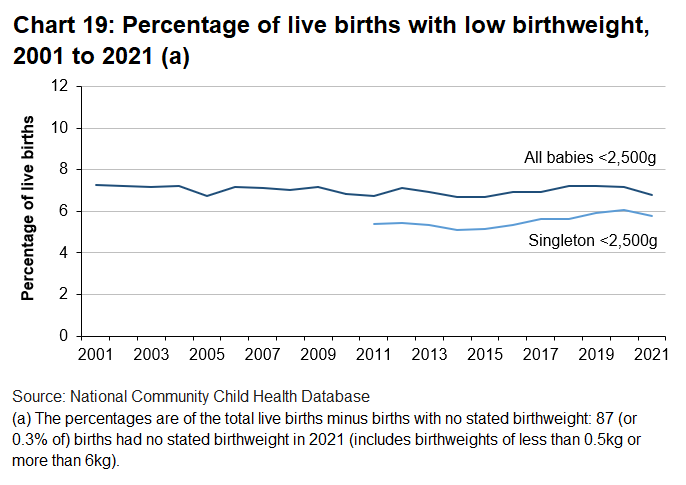
The percentage of all live births with low birthweight has remained fairly steady over the long term, with the rate fluctuating at around 7%. For singleton live births, the rate has typically fluctuated between 5% and 6% over the course of the time series, with a slight upward trend since 2014.
In 2021, 6.8% of all births had low birthweight, 0.4 percentage points lower than in the previous year.
In 2021, 5.8% of singleton births had low birthweight, 0.3 percentage points higher than in the previous year.
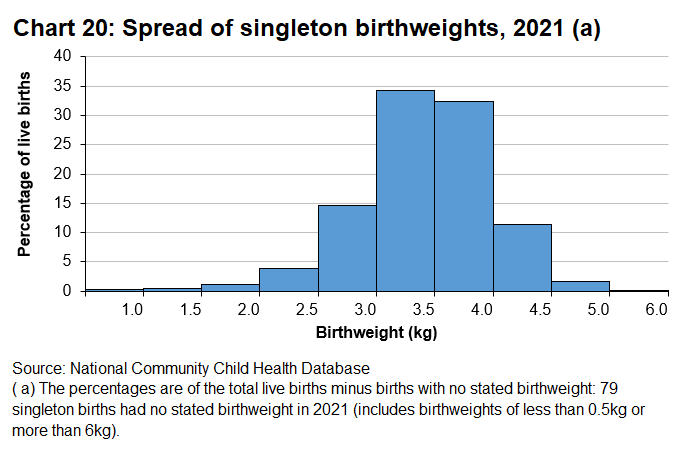
Two thirds (67%) of singleton births had a birthweight of between 3kg and 4kg, with a median birthweight of 3.44kg and mean birthweight of 3.40kg.
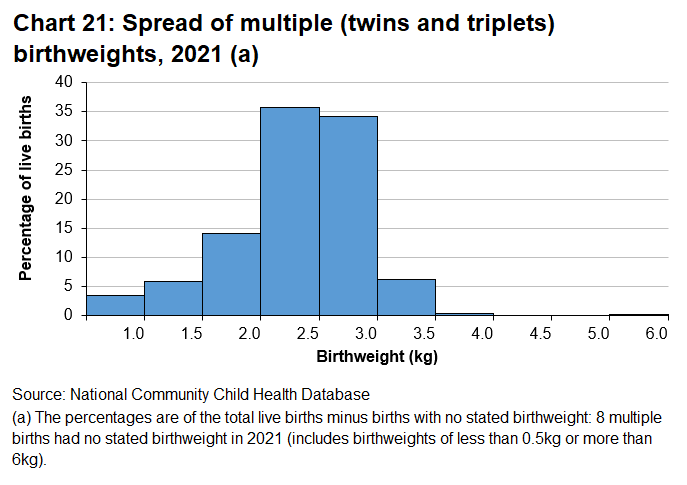
Seven out of ten (70%) multiple births had a birthweight of between 2kg and 3kg, with a median birthweight of 2.39kg and mean birthweight of 2.31kg.
Gestational age and birthweight
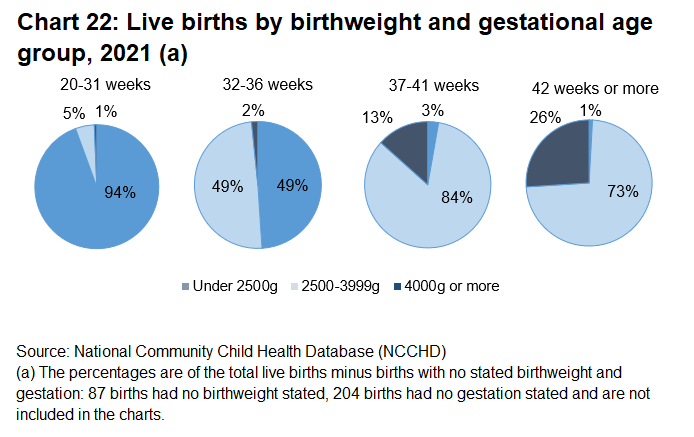
In 2021, 94% of births at gestations less than 32 weeks and 49% of births at 32-36 weeks gestation had low birthweights (less than 2.5kg).
The large majority (84%) of babies born within two weeks either side of the expected due date (37 to 41 weeks) were of healthy weight (2.5kg to 4kg).
Less than 1% born at gestations 42 weeks or more had low birthweights, but over a quarter (26%) weighed more than 4kg.
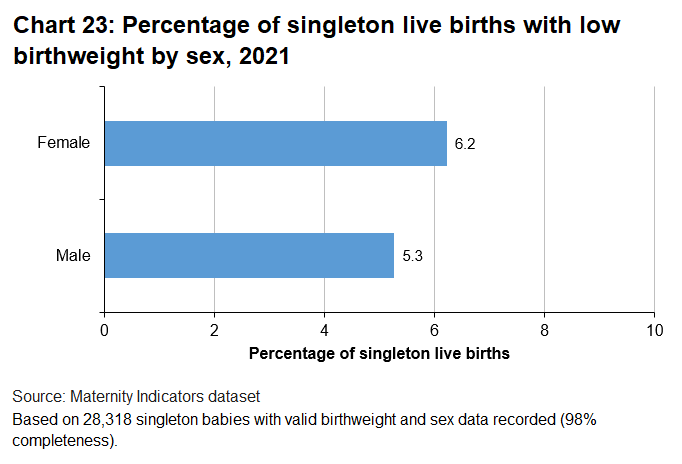
A slightly higher percentage of female babies had low birthweight (6.2%) compared to male babies (5.3%). This is broadly consistent with the longer-term trend.
Table 6: Live births by birthweight and gestational age, Wales, 2021 (MS Excel)
Births and ethnicity
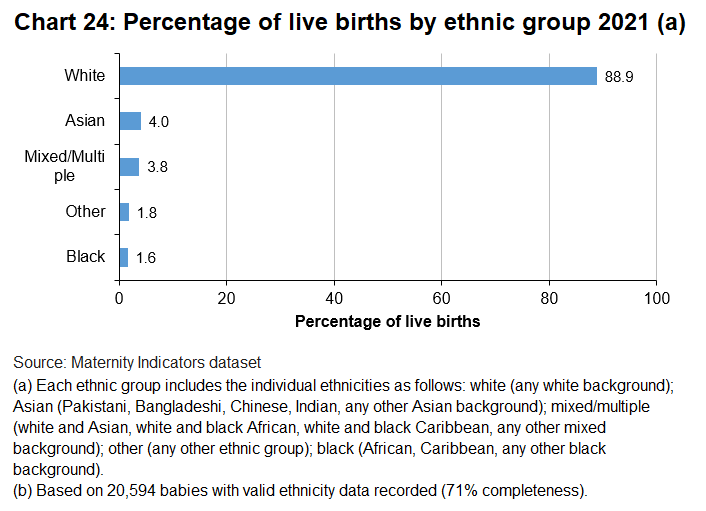
Almost nine out of ten (89%) babies born in 2021 were of white ethnic background. Asian was the ethnic group with the second highest percentage (4%), with the percentage of births from all ethnic groups remaining broadly stable since 2018 (the first year data is available from).
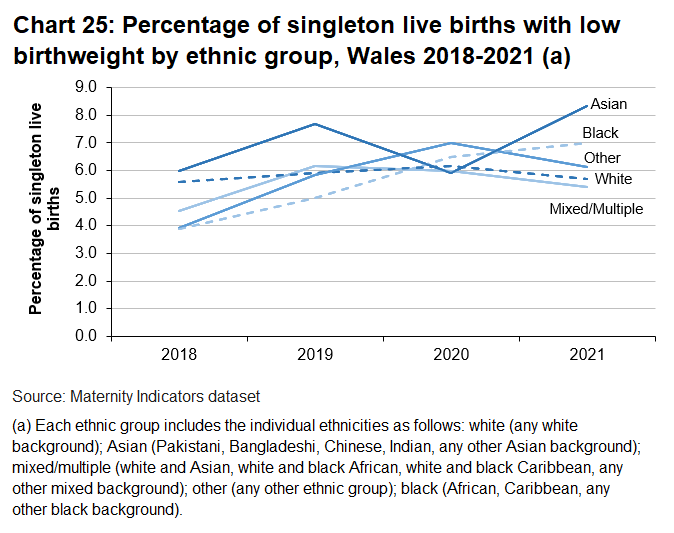
A higher percentage of Asian babies had low birthweight (8.4%) compared to other ethnic groups. Three percentage points fewer babies of mixed or multiple ethnic backgrounds had low birthweights than Asian babies, the largest difference between all ethnic groups.
The number of low birthweight babies per year in Wales is small when categorised by ethnic group so there can be relatively large changes from year-to-year through natural volatility. However, a larger proportion of Asian babies had low birthweights than any other ethnic group in three out of the four years for which there is data available.

The mean and median birthweights were broadly similar across most ethnic groups. Babies of white ethnic background had the heaviest mean and median birthweight, just over 0.2kgs heavier than babies of Asian ethnic background, which had the lightest average birthweight.
Table 10: Live births by ethnicity and birthweight, Wales 2018 to 2021 (MS Excel)
Births and birthweights by mother’s age
Data for teenage conceptions is published by ONS.
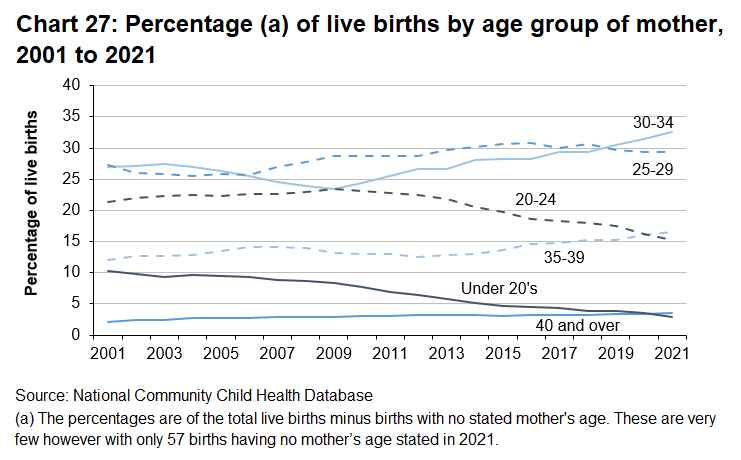
The percentage of live births to mothers aged under 20 has fallen every year since 2004. In 2021 this age group had the fewest live births, with less than 3% of the total live births.
The percentage of live births to mothers aged 20 to 24 has fallen every year since 2009.
Three in ten (29%) mothers birthing in 2021 were aged 25 to 29. This has remained broadly consistent since 2013.
The upward trend in live births to mothers aged 30 to 34 continued with a third (33%) of births occurring to mothers in this age group; the most common age group for mothers birthing in 2021.
The more gradual upward trend of mothers aged 35 to 39 also continued, with more births occurring in this group than in the 20 to 24 year old group for the first time on record.
Just under 4% of live births were to mothers aged 40 or older, continuing the marginal upward trend since the start of the time series.

The proportion of live births with low birthweight or low gestational age was highest in the youngest and oldest mothers in 2021, though there are only a small number of births to mothers in these age groups.
Of the age groups with more than 100 births occurring in 2021, the proportion of babies with low gestational age was highest in older age groups (35 to 39 and 40 to 44), while it was also just over 8% in the 20 to 24 age group.
The percentage of low birthweight babies in each age group was just lower than the percentage with low gestational age and followed a similar trend. Just over 8% of babies born to mothers aged 20 to 24 or 40 to 44 were of low birthweight, compared to just over 6% of babies born to mothers aged 16 to 19, 25 to 29 or 30 to 34.
The percentage of babies with low gestational age and the percentage of babies with low birthweight has remained broadly stable across age groups over the last 10 years.
Table 12: Number and percentage of live births by mothers’ age group, Wales, 2011 to 2021 (MS Excel)
APGAR scores
APGAR (Appearance, Pulse, Grimace, Activity, and Respiration) is a quick test performed on a baby at 1 and 5 minutes after birth. The 1-minute score determines how well the baby tolerated the birthing process. The 5-minute score tells the doctor how well the baby is doing outside the mother's womb. A score of 7 or above is a sign that the new-born is in good health.
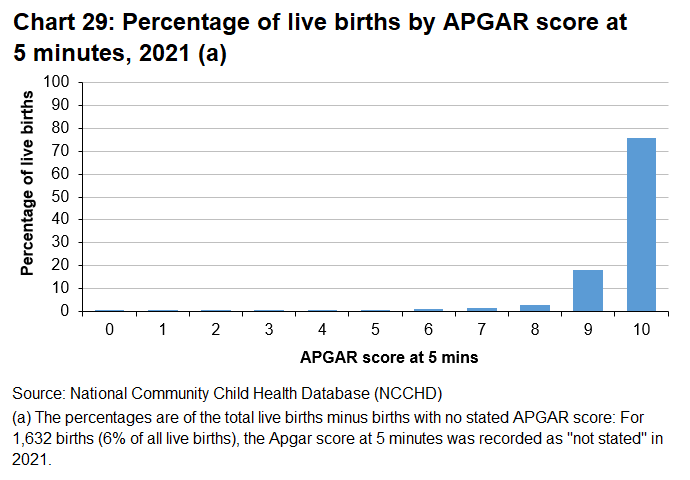
In 2021, the large majority of babies (98%) had an APGAR score of 7 or over at 5 minutes.
Healthy births
The ‘percentage of births considered to be healthy births’ is a Welsh Government Maternity Indicator. Only complete records are included in the healthy births analysis. This means each record must have valid entries for all the fields related to the criteria below to be included in the denominator.
Any of the following criteria exclude the birth from being considered as ‘healthy’:
- an onset of labour other than spontaneous
- augmentation in labour
- caesarean section, use of forceps or ventouse
- gestational age of less than 37 weeks
- stillbirth
- epidural in labour
- 3rd or 4th degree perineal trauma or episiotomy
- birthweight of less than 2.5kg or greater than 4.0kg
- blood loss of greater than 500ml
- APGAR score at 5 minutes less than 7
Data presented is sourced from the 28,004 total births which were recorded in the Maternity Indicators dataset in 2021. Of these, 18,721 births had valid data for all component data items in the healthy births calculation.
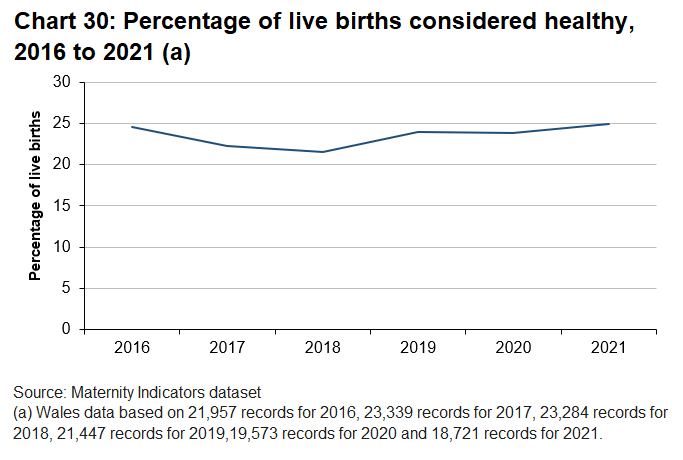
In 2021, a quarter (25%) of births were classed as ‘healthy births’ using the Welsh Government definition.
This is one percentage point higher than in the previous year and the equal highest since comparable data was first collected in 2016.
Data completeness was lower in 2021 than in any other year; therefore, caution is advised when using the healthy births data. Additional quality information on this measure is available in the quality and methodology section.
Quality and methodology information
All data used in this release is published on StatsWales or as an Excel table. All Excel tables are in the process of being moved onto StatsWales.
More detailed information on the sources of data and analyses in this statistical release are provided in the quality report. This includes a table showing the percentage of valid data recorded for selected data items in both source datasets.
Coherence of data sources for births in Wales
Chart 31 shows how the number of births in Wales compares across the main data sources. Data from the National Community Child Health Database (NCCHD) has very good coverage and completeness, with the number of births closely aligning to birth registration statistics by ONS. Maternity Indicators dataset (MI ds) was established in 2016 and the number of births differs from the other two sources primarily because it does not include births to Welsh residents in English hospitals.
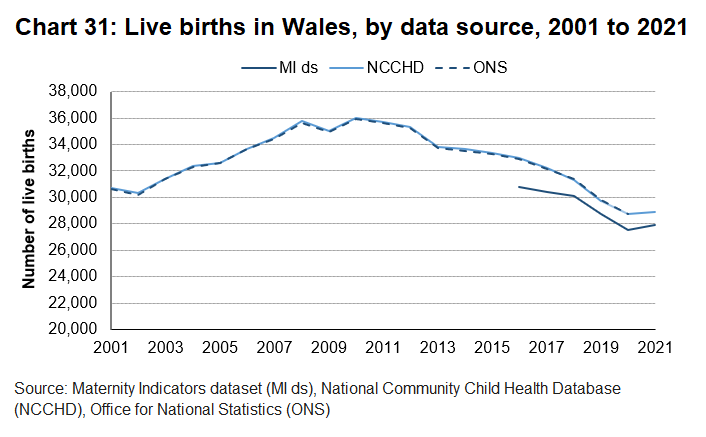
Note that at the time of publication, the latest available ONS births data is from 2020, but data is available for 2021 in both the Maternity Indicators dataset and National Community Child Health Database.
Quality of specific data items
Gestational age at initial assessment
Some women may have had their first initial assessment before the date that has been recorded in the Maternity Indicators dataset. This is because the merging methodology for the initial assessment and birth record is based on when these occur in the same health board. It is possible that a mother could have an initial assessment in one health board, early in the pregnancy, but then if she gives birth in another health board for any reason (for example, unexpected complications, or present in a different health board area at the time) she will have another initial assessment recorded at the second health board where she gives birth. This may explain the small peak around 39 and 40 weeks in Chart 1.
Mental health conditions reported at initial assessment
While more than 90% of records had valid data for this data item, across most health boards, in most years, there are some data quality issues. Only 56% of records for Cardiff and Vale had valid data in 2016 and 88% in Hywel Dda between 2016 and 2018 and in 2020. Data recorded in Betsi Cadwaladr and Cwm Taf Morgannwg appears to have been recorded on a different basis to other health boards, across all years and therefore data for these health boards are excluded from the Wales total figures.
BMI at initial assessment
More than 90% of records had valid data for both height and weight data items, across all health boards, in most years. The exceptions are: Cwm Taf in 2016 (77%) and in 2019 (88%); and Betsi Cadwaladr in 2019 (89%).
Data for BMI is calculated based on heights and weights of the mother; however, records where the weight was below 30kg or above 250kg and/or where height was under 120cm or above 200cm have been excluded from the analysis, as measurements outside of these thresholds are unlikely to be reliable. Also, this analysis only includes mothers whose initial assessment was completed at 14 completed weeks of pregnancy or earlier. This filter is applied as weight measurements for mothers who have initial assessments in the later stages of pregnancy will be affected by the growth of the baby.
Weight gained during pregnancy
To calculate the amount of weighed gained, each mother needs a valid weight recorded at initial assessment or between 36-38 week or at birth. There is a relatively high proportion of missing data for mothers’ weight at birth which limits the reliability of the weight gain data.
In 2021, Hywel Dda health board did not provide any data for mother’s weight at birth, and Swansea Bay had a higher than usual amount of missing data. As a result, the Wales data excludes both of these health boards. The percentage of records with valid data for this calculation for each year are: 2021 (61%); 2020 (73%); 2019 (80%); 2018 (75%); 2017 (70%); 2016 (55%). As a result of the level of missing data, caution is advised when using this statistic.
Smoking at initial assessment
More than 90% of records had valid data for the smoking status at initial assessment data item, across all health boards, in all years. However, statistics on smoking at initial assessment and birth are limited by the way in which the data is collected. If CO monitoring is not available, data reliability is dependent on the mother self-reporting accurate information. CO monitoring has largely been suspended since the COVID-19 pandemic began, so data for 2020 and 2021 is mainly self-reported.
E-Cigarette use should not be recorded in this data item and would not be detected by a CO monitor; however, in practice some mothers may self-report as a smoker if they use e-cigarettes and be incorrectly recorded as a smoker. Likewise, some mothers who do smoke may self-report as a non-smoker and be incorrectly recorded as a non-smoker.
Smoking at birth
In 2021, 82% of records had valid data recorded at the Wales level. This was largely due to Hywel Dda health board not supplying any smoking at birth data, while there was only 68% complete data for Cwm Taf Morgannwg. There were also low levels of completeness in 2020 for Hywel Dda (30%), Cwm Taf Morgannwg (70%) and Powys (76%). However, in all years prior to 2020, more than 90% of records had valid data for smoking status at birth, across nearly all health boards.
Stopped smoking during pregnancy
This analysis is based on women who had valid smoking data at both initial assessment and birth. As smoking status is recorded at two points in time only, the data will not show if mothers were smoking throughout the duration of their pregnancy, or how frequently they smoked. For the purpose of this release analysis, those mothers who were recorded as smoking at initial assessment but not smoking at birth are classed as mothers who ‘stopped smoking’ during pregnancy.
In 2021, 81% of records had valid data, the lowest since data collection began. This is largely due to Hywel Dda not supplying any data for smoking at birth and Cwm Taf Morgannwg having relatively low data completeness.
84% of records had valid data in 2020, largely as a result of missing data for smoking at birth in Hywel Dda, Cwm Taf Morgannwg and Powys. Between 2016 and 2019, there was good data completeness with more than 94% of records with valid data.
Pain relief
The percentage of records with valid data for epidurals is mixed across health boards and years, and in 2020, 83% of records had valid data at all Wales level. 4 out of 7 health boards had valid data for 99% or more of their records. Aneurin Bevan health board had the lowest percentage of valid data (35%).
Healthy births
The healthy births calculation involves combining 10 different data items and therefore all 10 data items need valid data recorded to determine if the birth was ‘healthy’. The level of incomplete data across these data items limits the use of this statistic. At the all-Wales level, the percentage of complete data was as follows: 66.9% in 2021; 70.7% in 2020; 74.7% in 2019; 76.9% in 2018; 76.3% in 2017; and 70.9% in 2016.
Data completeness was more variable at health board level.
Well-being of Future Generations Act (WFG)
The Well-being of Future Generations Act 2015 is about improving the social, economic, environmental and cultural wellbeing of Wales. The Act puts in place seven wellbeing goals for Wales. These are for a more equal, prosperous, resilient, healthier and globally responsible Wales, with cohesive communities and a vibrant culture and thriving Welsh language. Under section (10)(1) of the Act, the Welsh Ministers must (a) publish indicators (“national indicators”) that must be applied for the purpose of measuring progress towards the achievement of the wellbeing goals, and (b) lay a copy of the national indicators before Senedd Cymru. Under section 10(8) of the Well-being of Future Generations Act, where the Welsh Ministers revise the national indicators, they must as soon as reasonably practicable (a) publish the indicators as revised and (b) lay a copy of them before the Senedd. These national indicators were laid before the Senedd in 2021. The indicators laid on 14 December 2021 replace the set laid on 16 March 2016.
This release includes 1 of the national indicators namely The percentage of live single births with a birthweight of under 2.5kg.
Information on the indicators, along with narratives for each of the wellbeing goals and associated technical information is available in the Wellbeing of Wales report.
Further information on the Well-being of Future Generations (Wales) Act 2015.
The statistics included in this release could also provide supporting narrative to the national indicators and be used by public services boards in relation to their local wellbeing assessments and local wellbeing plans.
Contact details
Statistician: Craig Thomas
Tel: 0300 025 1646
Email: stats.healthinfo@gov.wales
Media: 0300 025 8099
SFR 150/2022
![]()