Loneliness (National Survey for Wales): April 2019 to March 2020
The report looks at aspects of loneliness in terms of the absence of close personal relationships and a lack of wider social contacts for April 2019 to March 2020.
In this page
The National Survey for Wales measures levels of loneliness in the population. People were given a series of six statements, to which they can answer either 'yes', 'no' or 'more or less'. This is a standard scale used to measure loneliness, the De Jong Gierveld scale. The six statements are:
- ‘I experience a general sense of emptiness’
- ‘I miss having people around’
- ‘I often feel rejected’
- ‘There are plenty of people I can rely on when I have problems’
- ‘There are many people I can trust completely’
- ‘There are enough people I feel close to’
Responses were combined to produce a scale from 0 to 6, where 0 is least lonely and 6 is most lonely. For reporting purposes, we count people who have a score of 4 to 6 as being lonely.
This report focuses on findings from the face-to-face National Survey during 2019-20 and also from the telephone National Survey carried out in May to September 2020, during the coronavirus pandemic. The 2019-20 results are the most comparable with previous years; the May to September 2020 results are more recent but less straightforward to compare with previous years due to the switch to telephone interviewing. Further results from the monthly and annual surveys are available in the results viewers.
Main findings
- In 2019-20, 15% of people were lonely, a decrease from 2016-17.
- Younger people were more likely to be lonely than older people.
- Individuals with a mental health condition or in poorer general health were also more likely to be lonely.
- Loneliness also showed a strong relationship with well-being. Lonely people reported much lower satisfaction with life than those who were not lonely.
- During May to September 2020, reported loneliness was lower than in 2016-17 and 2019-20.
Loneliness
In 2019-20, 15% of people were lonely. This is lower than in 2016-17, when 17% were lonely. In 2017-18, it was 16%.
In 2019-20, 51% were sometimes lonely (score 1 to 3) and 33% were not lonely (score 0).
In-depth analysis was carried out to investigate the links between loneliness and a variety of demographic, social and health factors. Whilst controlling for the influence of other factors, the following were independently associated with being lonely:
Age
Being younger shows a strong link with being lonely. 9% of those over 65 are lonely, compared with 19% of those aged 16 to 44 and 15% of those aged 45 to 64.

Ethnicity
People who identified as 'White - British' were less likely to be lonely than those who identified as white and not British.
General health
People who consider themselves to be bad health were more likely to be lonely than those in good health. 24% in fair health and 35% in bad or very bad health were lonely, compared with 11% of those in good or very good health.
Having a mental illness
44% of those with a mental illness (including anxiety and depression) were lonely, while just 12% of those without such an illness were lonely.
Sexual orientation
15% those who reported being heterosexual or straight were lonely, compared with 30% of those who gave another response.
Material deprivation
Material deprivation was a significant factor in reported loneliness. 41% of people in material deprivation were lonely, compared with 12% of those not in material deprivation.
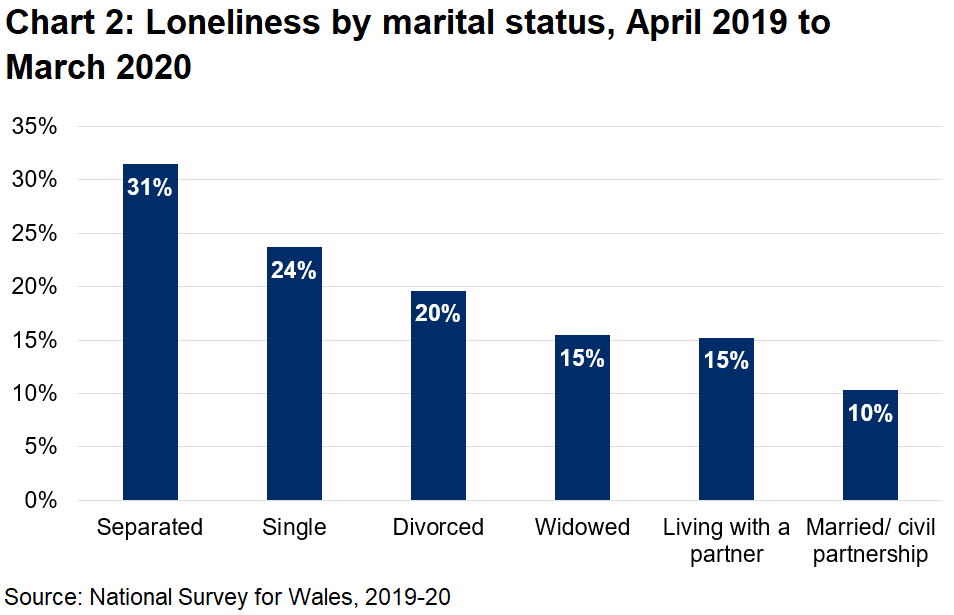
Marital status
Individuals who were married or in a civil partnership were less likely to be lonely than those who were single (as in, not married or living with a partner), separated, divorced or widowed. Additionally, those unmarried but living with a partner were less likely to be lonely than those single or separated.
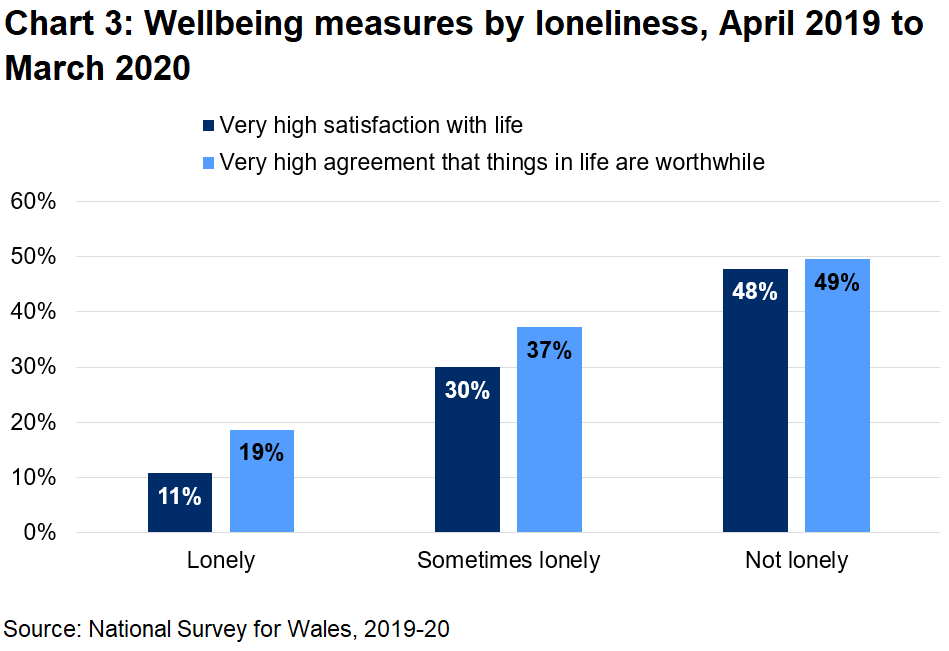
Loneliness was also shown to have a relationship with an individual’s wider wellbeing. 48% of those who were not lonely reported very high satisfaction with life, compared with 30% of those who were sometimes lonely and just 11% of those who were lonely. Similarly, almost half of those who were not lonely felt strongly that the things they do in their life are worthwhile, compared with 19% of those who were lonely.
Emotional and social loneliness
There are two dimensions to loneliness: emotional and social loneliness. Of the six statements listed above, the first three statements are indicators of emotional loneliness and the following three are indicators of social loneliness. Using a 0 to 3 scale, classifying a score of 2 to 3 as lonely and 3 as highly lonely, it was found that social loneliness was more prevalent than emotional loneliness. 30% of people are socially lonely, half of these being highly socially lonely, compared with 20% being emotionally lonely.
We used the same analysis method as above to look at links between different factors and emotional and social loneliness. Similar factors were found to be important for both these types of loneliness as for overall loneliness. There were some notable differences however, with sexual orientation showing a stronger link to emotional loneliness than social; and tenure showed a link with emotional loneliness but not social or overall. Those in social housing or private rented accommodation were more likely to have been emotionally lonely than those in an owner-occupied home.
Loneliness and COVID-19
Due to the COVID-19 pandemic, the planned face to face 2020-21 National Survey for Wales was replaced with a shorter telephone survey with monthly results available covering May to September 2020. Due to changes in methodology, comparisons between the full year results and the monthly results should be treated with caution, but there are still some points of interest.
Perhaps surprisingly, when the May to September 2020 results are combined, 11% of people said they were lonely, which is lower than in 2019-20 (15%). In the full year survey, the loneliness questions were self-completed on a computer. This is not an option on the telephone, where respondents must tell the interviewer their response. It is possible that respondents felt less willing to admit to being lonely when interviewed over the phone than when answering by themselves on a computer.
Policy context
Loneliness is one of the 46 national indicators used to measure progress against the Well-being of Future Generations (Wales) Act 2015. The Act was designed to improve the social, economic, environmental and cultural well-being of Wales. It also features in the Public Health Outcomes Framework for Wales, which considers the various economic, environmental and social factors that impact the health of the individual, the community and society. Loneliness is an indicator for “living conditions”, supporting the development of cohesive communities. The Social Services National Outcomes Framework, which focuses on care givers and care receivers, also uses loneliness as a measure of well-being for these individuals.
Quality and methodology information
The 2019-20 National Survey was a face-to-face survey of over 12,000 randomly selected adults across Wales running from April 2019 to March 2020.
Due to the coronavirus pandemic we changed to a shorter, monthly telephone survey. From May 2020 onwards telephone interviews were carried out with a random sample of people who had previously taken part in a full-year, face-to-face National Survey.
Detailed charts and tables of results are available in our interactive results viewer. For information on data collection and methodology please see our Quality report and Regression technical report.
National Statistics status
The United Kingdom Statistics Authority has designated these statistics as National Statistics, in accordance with the Statistics and Registration Service Act 2007 and signifying compliance with the Code of Practice for Statistics.
National Statistics status means that official statistics meet the highest standards of trustworthiness, quality and public value.
All official statistics should comply with all aspects of the Code of Practice for Statistics. They are awarded National Statistics status following an assessment by the UK Statistics Authority’s regulatory arm. The Authority considers whether the statistics meet the highest standards of Code compliance, including the value they add to public decisions and debate.
It is Welsh Government’s responsibility to maintain compliance with the standards expected of National Statistics. If we become concerned about whether these statistics are still meeting the appropriate standards, we will discuss any concerns with the Authority promptly. National Statistics status can be removed at any point when the highest standards are not maintained, and reinstated when standards are restored.
The continued designation of these statistics as National Statistics was confirmed in June 2020 following a compliance check by the Office for
Statistics Regulation (letter of confirmation). These statistics last underwent a full assessment (full report) against the Code of Practice in 2013.
Since the latest review by the Office for Statistics Regulation, we have continued to comply with the Code of Practice for Statistics, and have made the following improvements:
Since the latest review by the Office for Statistics Regulation, we have continued to comply with the Code of Practice for Statistics, and have made the following improvements:
- provided more detailed breakdowns in the results viewer and made it easier for users to compare results across years
- updated the survey topics annually to ensure we continue to meet changing policy need
- made regression analysis a standard part of our outputs to help users understand the contribution of particular factors to outcomes of interest
Well-being of Future Generations Act (WFG)
The Well-being of Future Generations Act 2015 is about improving the social, economic, environmental and cultural wellbeing of Wales. The Act puts in place seven wellbeing goals for Wales. These are for a more equal, prosperous, resilient, healthier and globally responsible Wales, with cohesive communities and a vibrant culture and thriving Welsh language. Under section (10)(1) of the Act, the Welsh Ministers must (a) publish indicators (“national indicators”) that must be applied for the purpose of measuring progress towards the achievement of the Well-being goals, and (b) lay a copy of the national indicators before the National Assembly. The 46 national indicators were laid in March 2016. The National Survey collects information for 15 of the 46 indicators.
Further information on the Well-being of Future Generations (Wales) Act 2015.
The statistics included in this release could also provide supporting narrative to the national indicators and be used by public services boards in relation to their local wellbeing assessments and local wellbeing plans.
Contact details
Statistician: Alice Roebuck
Telephone: 0300 025 0061
Email: surveys@gov.wales
Media: 0300 025 8099
![]()
SB 44/2020