Land Transaction Tax statistics: July to September 2020
Our quarterly Welsh Revenue Authority (WRA) statistics for Land Transaction Tax (LTT). Data includes the number of land and property transactions, tax due and value of property taxed.
In this page
Main points
We present these statistics on LTT transactions that we (the WRA) have received by 19 October 2020.
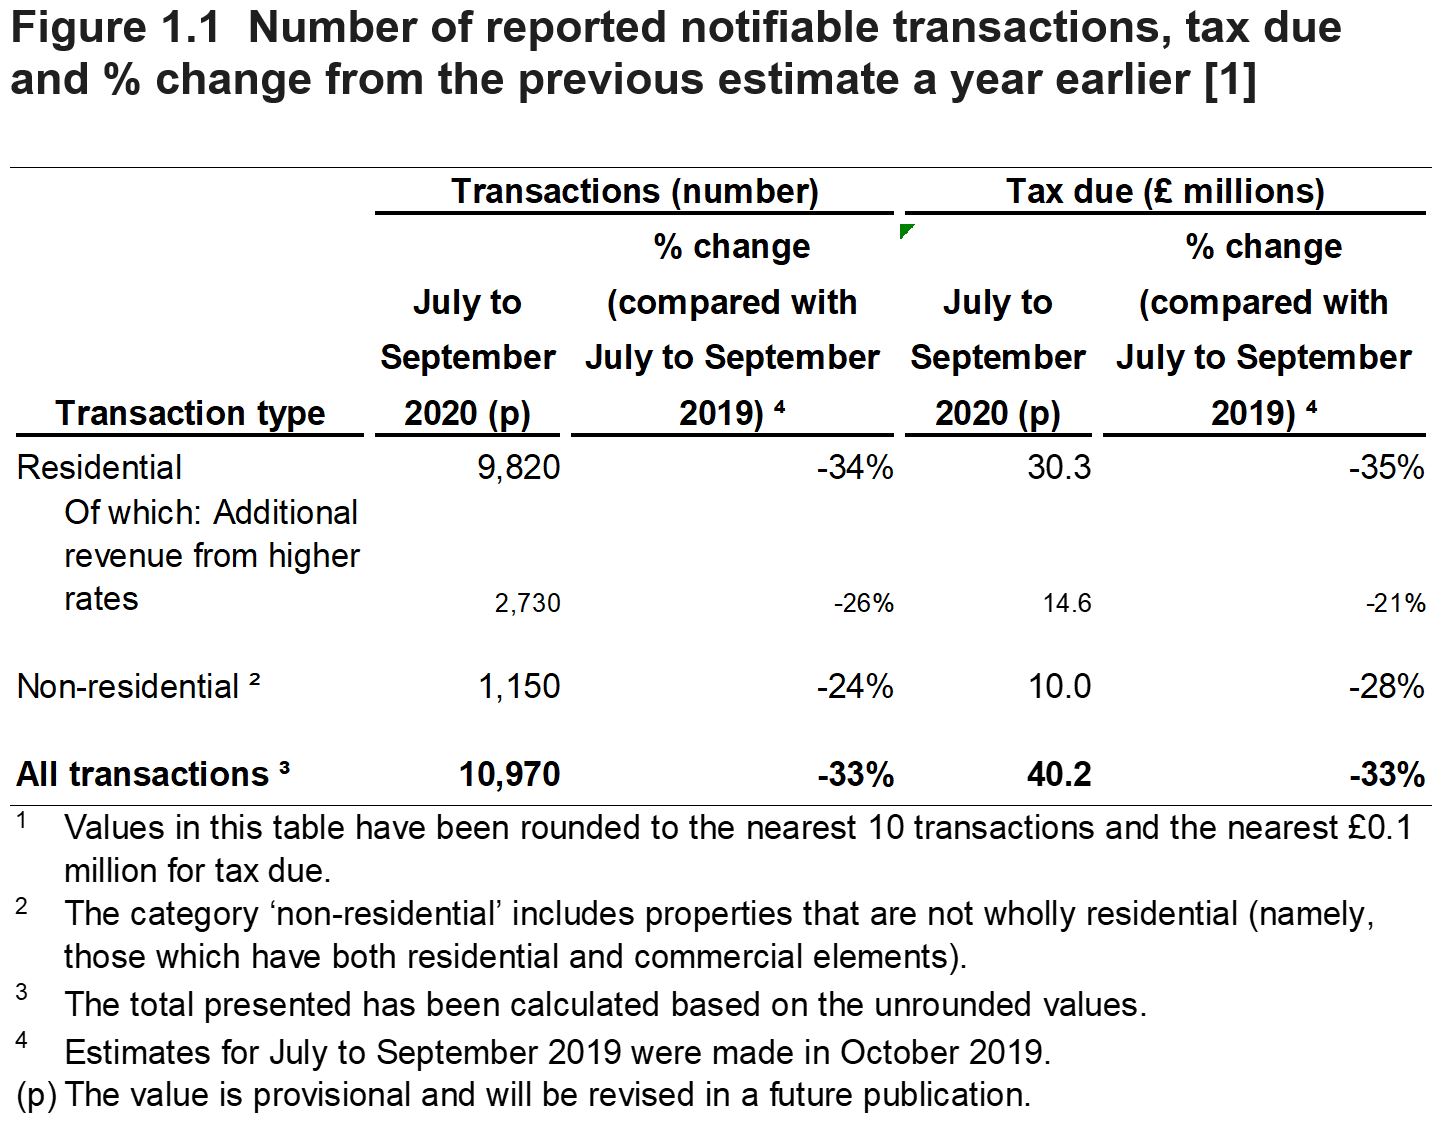
Figure 1.1 below shows:
- quarterly estimates for July to September 2020
- the percentage change against previous estimates for July to September 2019 (made in October 2019)
We explain why these comparisons are made in Section 1 of this release (‘Comparisons with the same period a year earlier’).
LTT statistics by time period and transaction type on StatsWales
Since April 2020, coronavirus (COVID-19) had a major impact on the number of property transactions and tax due. This is the case for both residential and non-residential transactions.
Comparing July to September 2020 on a like-for like basis with the same three-month period in 2019:
- Residential transactions and tax due on those transactions fell by just over a third
- Higher rates transactions fell by just over a quarter. The additional revenue from higher rates transactions fell by just over a fifth
- Non-residential transactions fell by nearly a quarter. Tax due from non-residential transactions fell by 28%
The above data represents a partial recovery on the April to June 2020 data presented in our previous quarterly release. The following section describes the effect of coronavirus (COVID-19) and the LTT rate change on 27 July 2020. A greater recovery is evident in higher rates residential transactions (and the additional revenue from these) than for all residential transactions. As the data develops, we will attempt to understand the reasons for this.
Effects of coronavirus (COVID-19) and the LTT rate change on 27 July 2020
The data in this release should be considered in the context of the coronavirus (COVID-19) outbreak. This had a significant impact on the number of property transactions and tax due during the first half of 2020-21. It therefore affects comparisons made between this period and the same period in 2019-20.
The national lockdown imposed on 23 March 2020 resulted in the housing market being mainly closed until it was partially re-opened on 22 June. At that point, house viewings could take place in vacant properties along with house moves where a sale has been agreed but not yet completed. The market was then more fully opened on 27 July to coincide with a change in LTT rates effective until 31 March 2021. Although there were some further local lockdowns imposed towards the end of the period reported in this release (end September 2020), these do not appear to have had any significant impact on transaction counts.
It is not possible to isolate the impact of the LTT rate change from the general recovery that is likely to have occurred due to easing of coronavirus (COVID-19) restrictions. However, on a transaction-by-transaction basis, we can quantify the impact. The rate change only applies to residential transactions at the main rate. The rates for all residential transactions at the higher rate and non-residential transactions were unchanged. For these main rate transactions, the threshold at which LTT rates was charged was raised from £180,000 to £250,000, so that the tax on all those with a value of £250,000 or less is reduced to zero. Although the LTT rates on property values above £250,000 were unchanged, those transactions also benefit from the increased threshold on the first £250,000 of their value. In these cases, LTT is reduced by £2,450 compared with that which would have been charged previously.
The combined impact of the outbreak and the rate change can be seen in Figure 2.1. Following an initial sharp drop in April and May 2020, there has been a steady recovery in numbers of transactions since. In total, there were 2,130 residential and non-residential transactions effective in April 2020, which was just under half of the number seen in April 2019. But the number of transactions has since recovered to 86% of the level for the previous year when considering those submitted in the last week of September 2020.
1. About these statistics
Introduction of LTT
From 1 April 2018, LTT replaced Stamp Duty Land Tax (SDLT) on residential and non-residential property and land interests purchased in Wales. The tax rates and tax bands for LTT vary depending on the type of transaction.
LTT statistics are not fully comparable to previous SDLT statistics. This is because different rates and bands are used in LTT. The reliefs may also be different for the two taxes. For example, first time buyers’ relief applies to SDLT but not to LTT.
Value of LTT statistics
Timely information on activity in the property market is important for policy makers. When filing an LTT return about a property transaction, the organisation paying the return has 30 days after the effective date to submit and pay any tax due. Therefore, LTT statistics are relatively timely.
Forecasting LTT revenues for Wales in future is an important use of LTT statistics. The Welsh Government and the Office for Budget Responsibility mainly do this.
Data available for LTT
All of the data used in this statistical release is available in a spreadsheet on the headline statistics page.
Annually, we also publish geographic datasets for LTT on the StatsWales website. This includes annual data by:
- Local authority
- Senedd constituency (residential transactions only)
- Level of deprivation, using the Welsh Index of Multiple Deprivation (residential transactions only)
- Built up areas (residential transactions only)
For data at the Wales level, we provide links to the relevant StatsWales datasets throughout this release.
Timing of and revisions to LTT statistics
The diagram on the key quality information page explains the timing of LTT statistics. We present provisional estimates for September 2020, the quarter July to September 2020 and revised estimates for periods before this. We will revise the provisional data in future. Not all tax returns for these periods may yet have been received.
In future, we may continue to revise statistics for earlier periods to account for any amendments to transactions and new tax returns received. Reasons for this include:
- higher rate refunds being made for several years after the date of the original transaction
- taxpayers mistakenly sending tax returns to HMRC which relate to Welsh property transactions. Once the error is realised, it can take some time for the taxpayer to send the return correctly to the WRA.
Comparisons with the same period a year earlier
There can be seasonal patterns in the property market, with higher levels of activity generally seen in the summer and autumn, and lower levels in winter and spring. These effects are also seen in the levels of transactions and tax due. Therefore, it can be helpful to compare the current period with data for the same period a year earlier.
However, in our monthly and quarterly statistics, we are gradually revising downwards the tax due for earlier periods. This is because of higher rate refunds being paid out in each month (for higher rates residential transactions which were effective in earlier periods, back to April 2018).
The value for July to September 2019 will have already been subject to some of this downward revision, whereas the equivalent figure for July to September 2020 will not yet. In future, there will also be some upward revisions to the values for July to September 2020 due to late transactions.
Therefore in this release, we compare:
- July to September 2020 data; and
- our previous estimates for July to September 2019 (which we published in October 2019)
This provides for the fairest comparisons over time. However, all comparisons of 2020-21 data against 2019-20 data should be considered in light of the effects of coronavirus (COVID-19) and the LTT rate change on 27 July 2020.
Key quality information and glossary pages
Please see the separate glossary and key quality information while reading this statistical release:
- We define relevant terms in the glossary as they are used in this release.
- On the key quality information page, we describe how Land Transaction Tax statistics meet the Code of Practice for Statistics and the dimensions of value, trustworthiness and quality.
Properties or land sold more than once
These statistics relate to transactions which were effective in particular month, quarter or year. A property or piece of land may have been sold more than once in that time. If so, it would feature multiple times in the statistics.
For example, in April 2019 to March 2020, our best estimate is that between 4% and 5% of transactions involved a piece of land or property which has been sold more than once in the year.
2. Transactions, tax due and property value taxed
In March 2020, we released an update on publishing WRA statistics due to coronavirus (COVID-19). We stated then that in our releases for LTT, we would look at any potential impacts of coronavirus (COVID-19) on our statistics.
To understand the impacts on number of transactions, tax due and value of property taxed, users should refer to the section of this release ‘Effects of coronavirus (COVID-19) and the LTT rate change on 27 July 2020’.
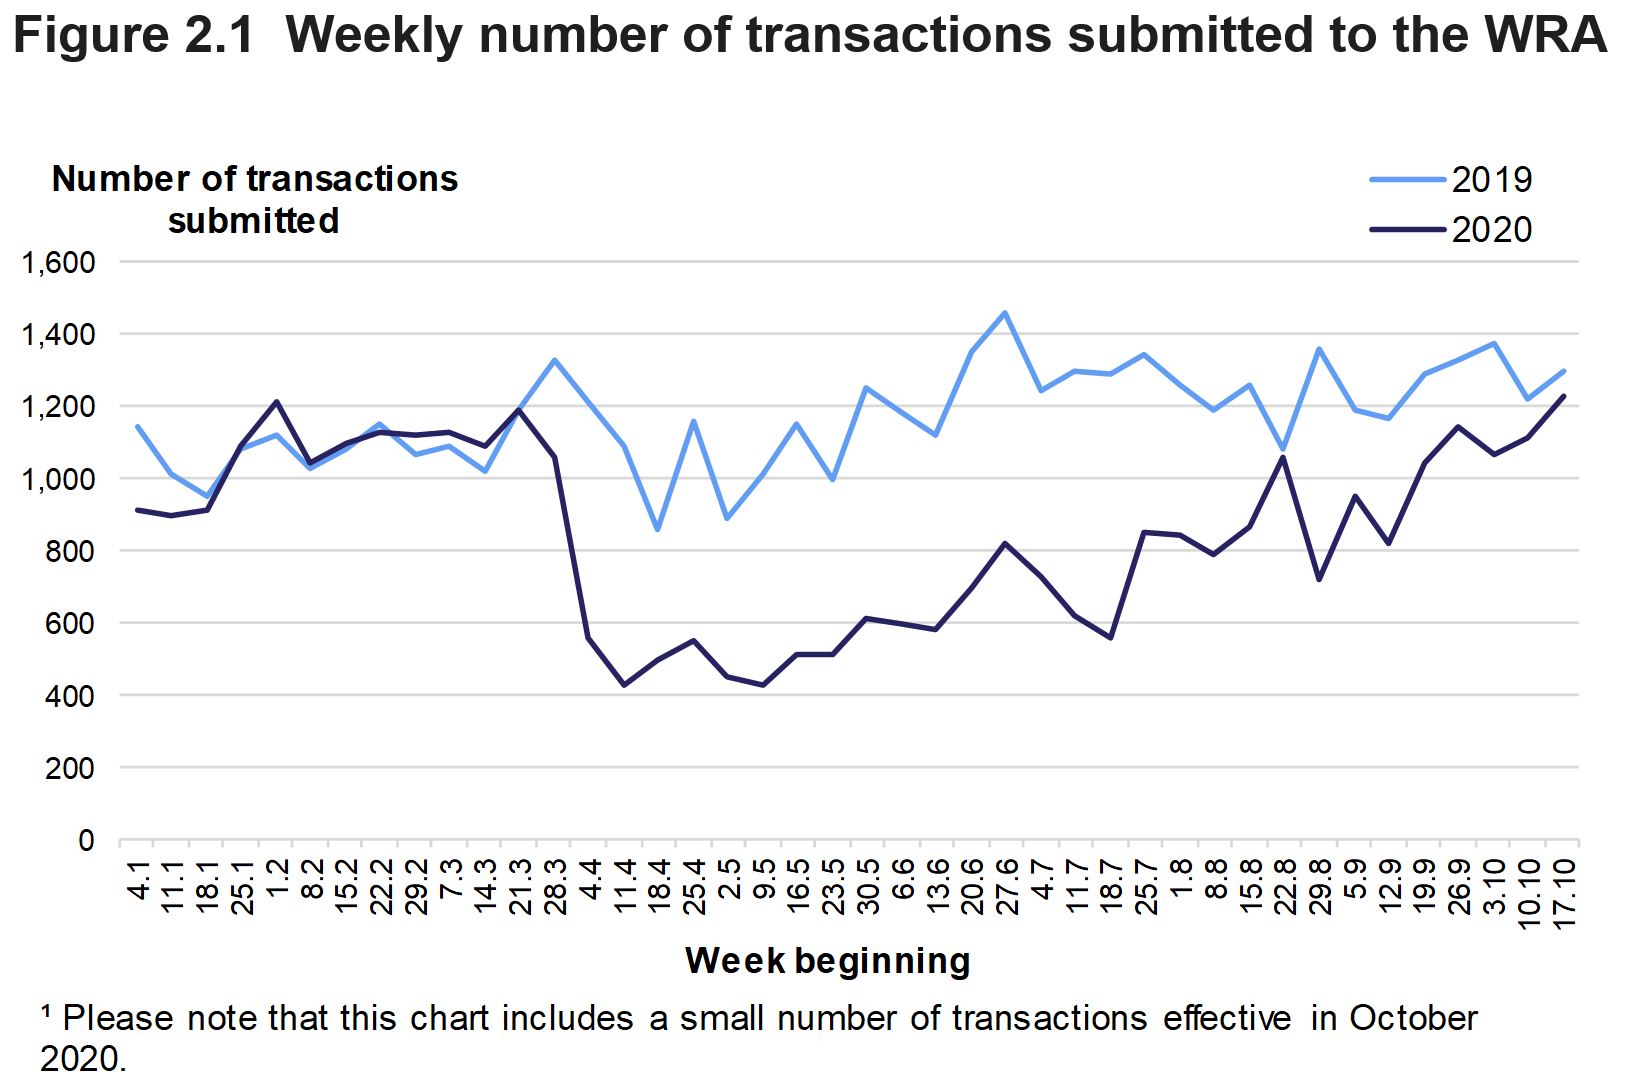
Weekly number of transactions submitted to the WRA (MS Excel)
Figure 2.1 above shows the total number of transactions submitted to the WRA in each 7-day period. These periods begin on a Saturday and end on the following Friday. For example, the point ’17.10’ in 2020 shows the number of residential and non-residential transactions submitted to the WRA from 17 to 23 October 2020 (inclusive). The actual dates differ slightly in the previous year. For example, the same week in 2019 ran from 19 to 25 October 2019 (inclusive).
Please note that Figure 2.1 shows data by submitted date. This differs from effective date, which is the date we use for most analysis in this release.
Weekly transactions submitted in January to March 2020 were similar to the previous year. However, the weekly number of transactions submitted dropped sharply in April following the coronavirus outbreak, particularly in the residential sector.
The weekly number of transactions submitted from April to July 2020 ranged between 40% to 60% of the number seen in the same week of 2019 and averaged at around 50% over the whole period. Since then, there has been a recovery in transactions with levels getting closer to those seen in the previous year in August and September.
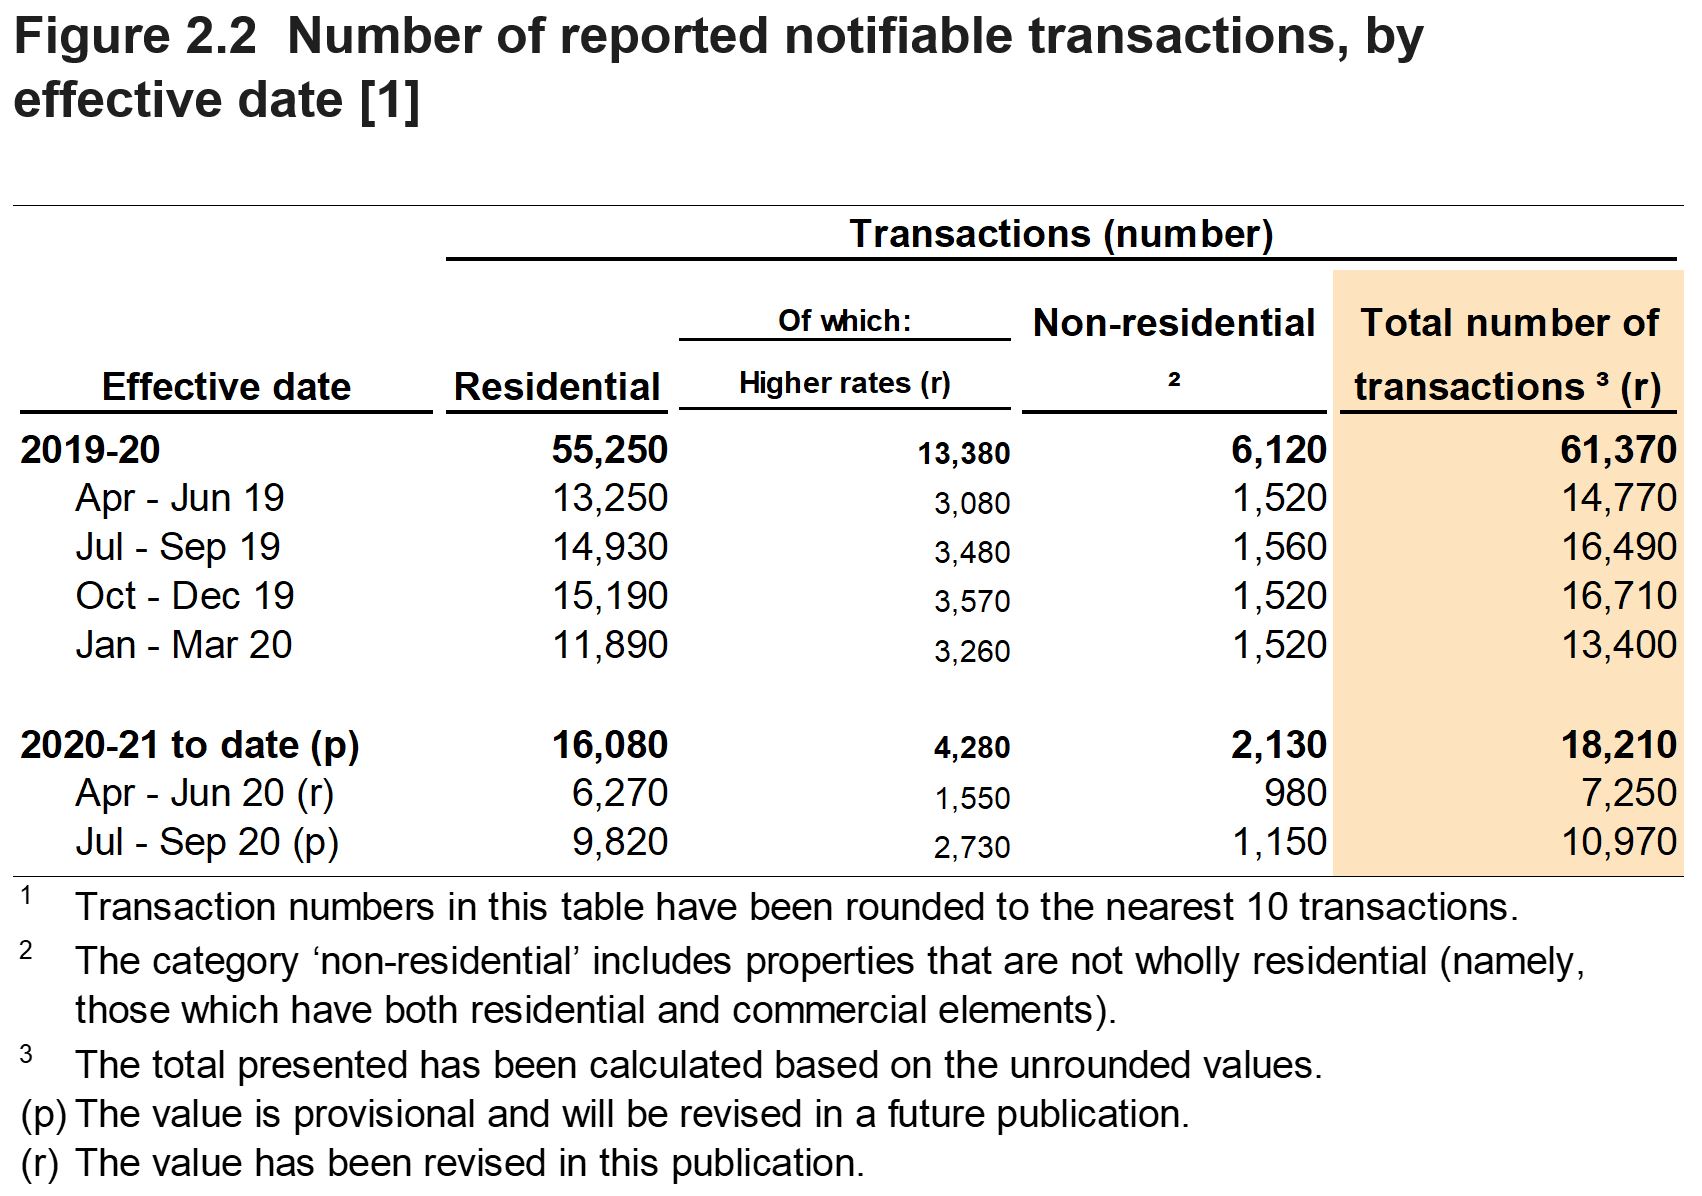
LTT statistics by time period and transaction type on StatsWales (includes data for 2018-19, not presented above)
By the close of 19 October 2020, we received details of 10,970 notifiable transactions with an effective date in July to September 2020. This is around a third lower than our estimate for July to September 2019 (made in October 2019).
The corresponding changes for residential, higher rates residential and non-residential transactions were falls of 34%, 26% and 24%, respectively. So far, coronavirus (COVID-19) has had a greater impact on residential transactions than on non-residential. There has been a greater recovery to date for higher rates residential transactions than for all residential transactions.
In July to September 2020, 90% of transactions were residential and 10% were non-residential. In the previous three-month period, residential transactions made up a slightly lesser share of all transactions (86%).
LTT statistics by time period and transaction type on StatsWales (includes data for 2018-19, not presented above)
LTT statistics on total tax due including transactions with restricted detail on StatsWales (includes data for 2018-19, not presented above)
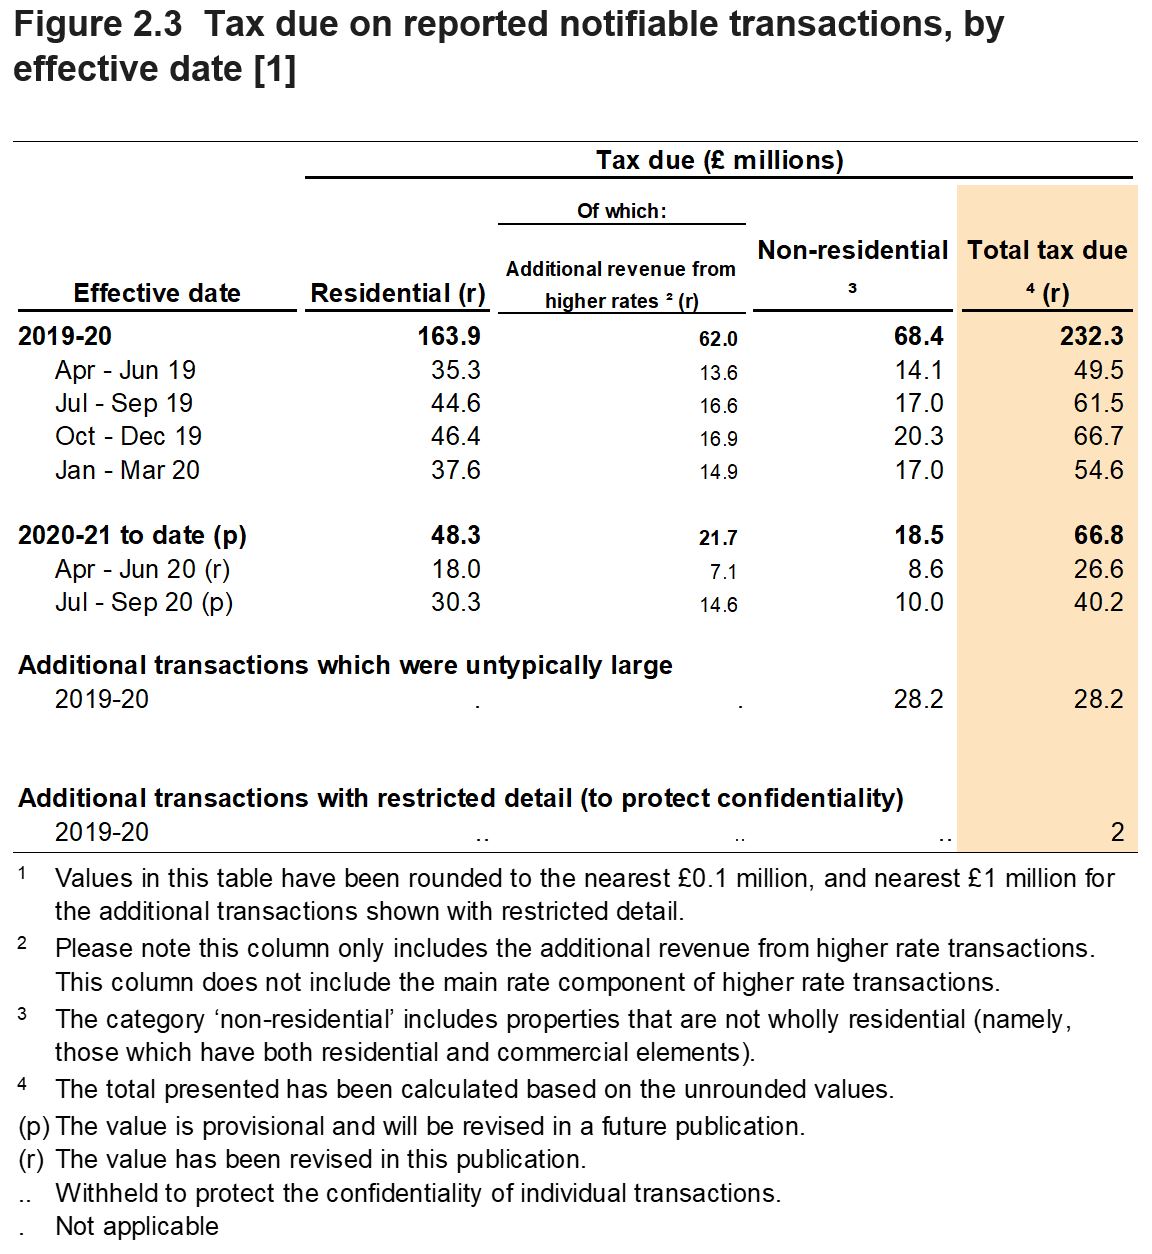
Additional transactions which were untypically large
‘Untypically large transactions’ in April 2019 to March 2020 entirely consists of a small number of public sector transactions. These transactions relate to Transport for Wales’ purchase from Network Rail of the Core Valley Line rail asset in Wales. Details of these transactions are presented here to aid transparency of this large public sector transaction, with agreement of the buyer (Transport for Wales) and seller (Network Rail). Further information on these transactions is available from the Transport for Wales website.
Additional transactions with restricted detail (to protect confidentiality)
For some transactions, we are unable to provide any information other than the total tax due figure in the year, as there is a risk of revealing details of the individual transactions. These are rounded to the nearest million pounds for additional protection. They should only be included if seeking a value for total LTT revenue in the year April 2019 to March 2020.
Quarterly comparisons on a like-for-like basis
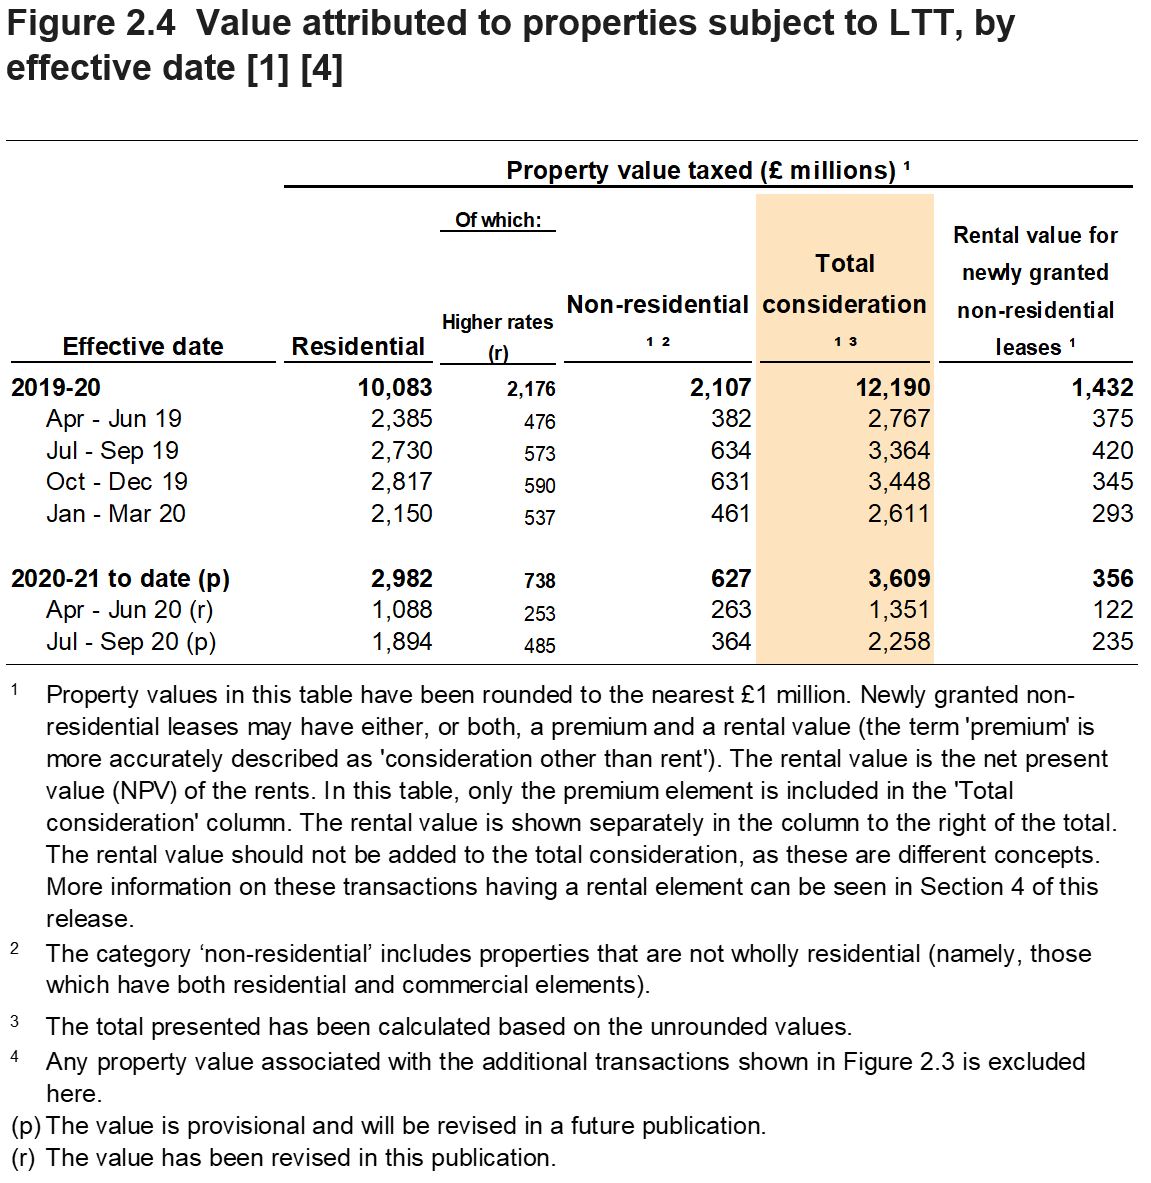
Excluding the transactions described above, the total tax due for transactions with an effective date in July to September 2020 was £40.2 million. This value is a third lower than our estimate for July to September 2019 (published in October 2019).
The corresponding changes for residential tax due and non-residential tax due were falls of 35% and 28%, respectively.
LTT statistics by time period and transaction type on StatsWales (includes data for 2018-19, not presented above)
The value of property taxed in July to September 2020 was £2.2 billion, lower than the £3.4 billion seen in July to September 2019.
Separately, in July to September 2020, the rental value for newly granted non-residential leases was £235 million. The equivalent figure in July to September 2019 was £420 million.
LTT statistics by time period and transaction type on StatsWales (includes data for 2018-19, not presented above)
2019-20 residential data
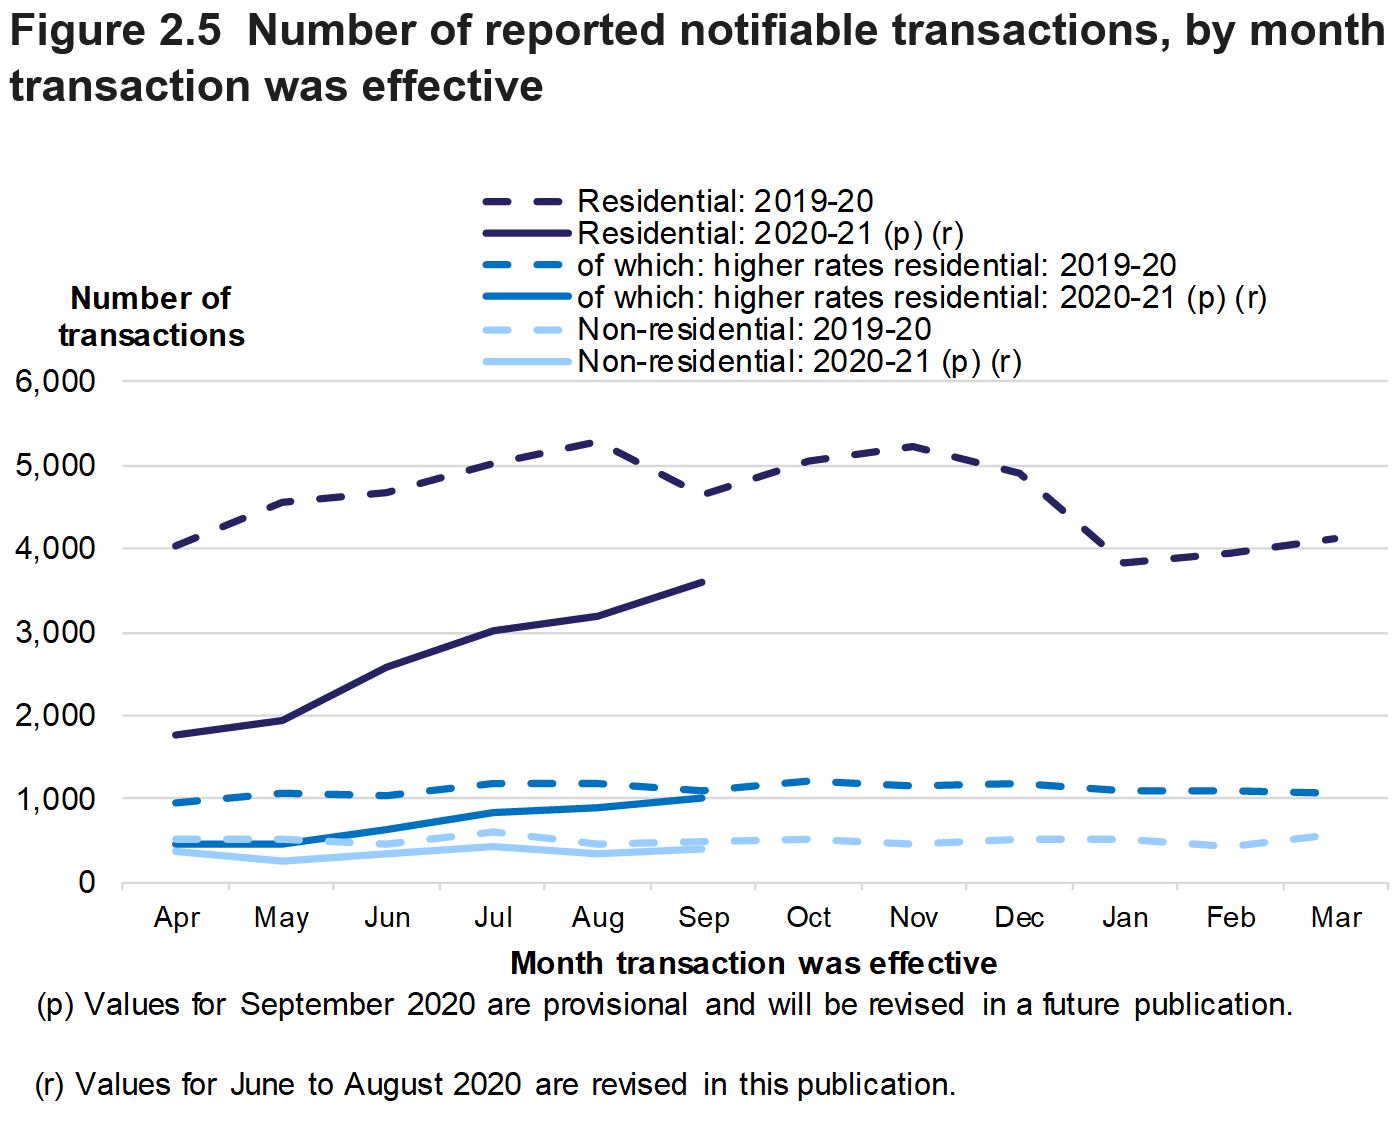
The numbers of residential transactions by effective month varied somewhat since April 2019. There is general seasonality with more transactions in the summer and autumn months, although some fluctuation due to there being five Fridays in certain months, rather than four. Figure 2.9 in our annual statistical release shows that nearly half of transactions have an effective date that is a Friday.
2020-21 residential data
Following the coronavirus (COVID-19) outbreak in March 2020, the monthly number of residential transactions dropped significantly in April and May. Since then it has gradually recovered, although it remains below the numbers seen in the previous year.
Within this number though , higher rate residential transactions have recovered to a greater extent. The number of higher rate residential transactions in September 2020 was only slightly below that seen in September 2019.
Non residential
In March 2020, we see an increase from the previous month (February) in non-residential transactions. This may be expected, as it is common for non-residential leases to be renewed at the end of the financial year.
Since then, the impact of coronavirus is less easily seen in non residential transactions. This is in part due to the lower number of transactions generally, and in part due to the fact that the numbers of transactions have generally held up better than those for residential.
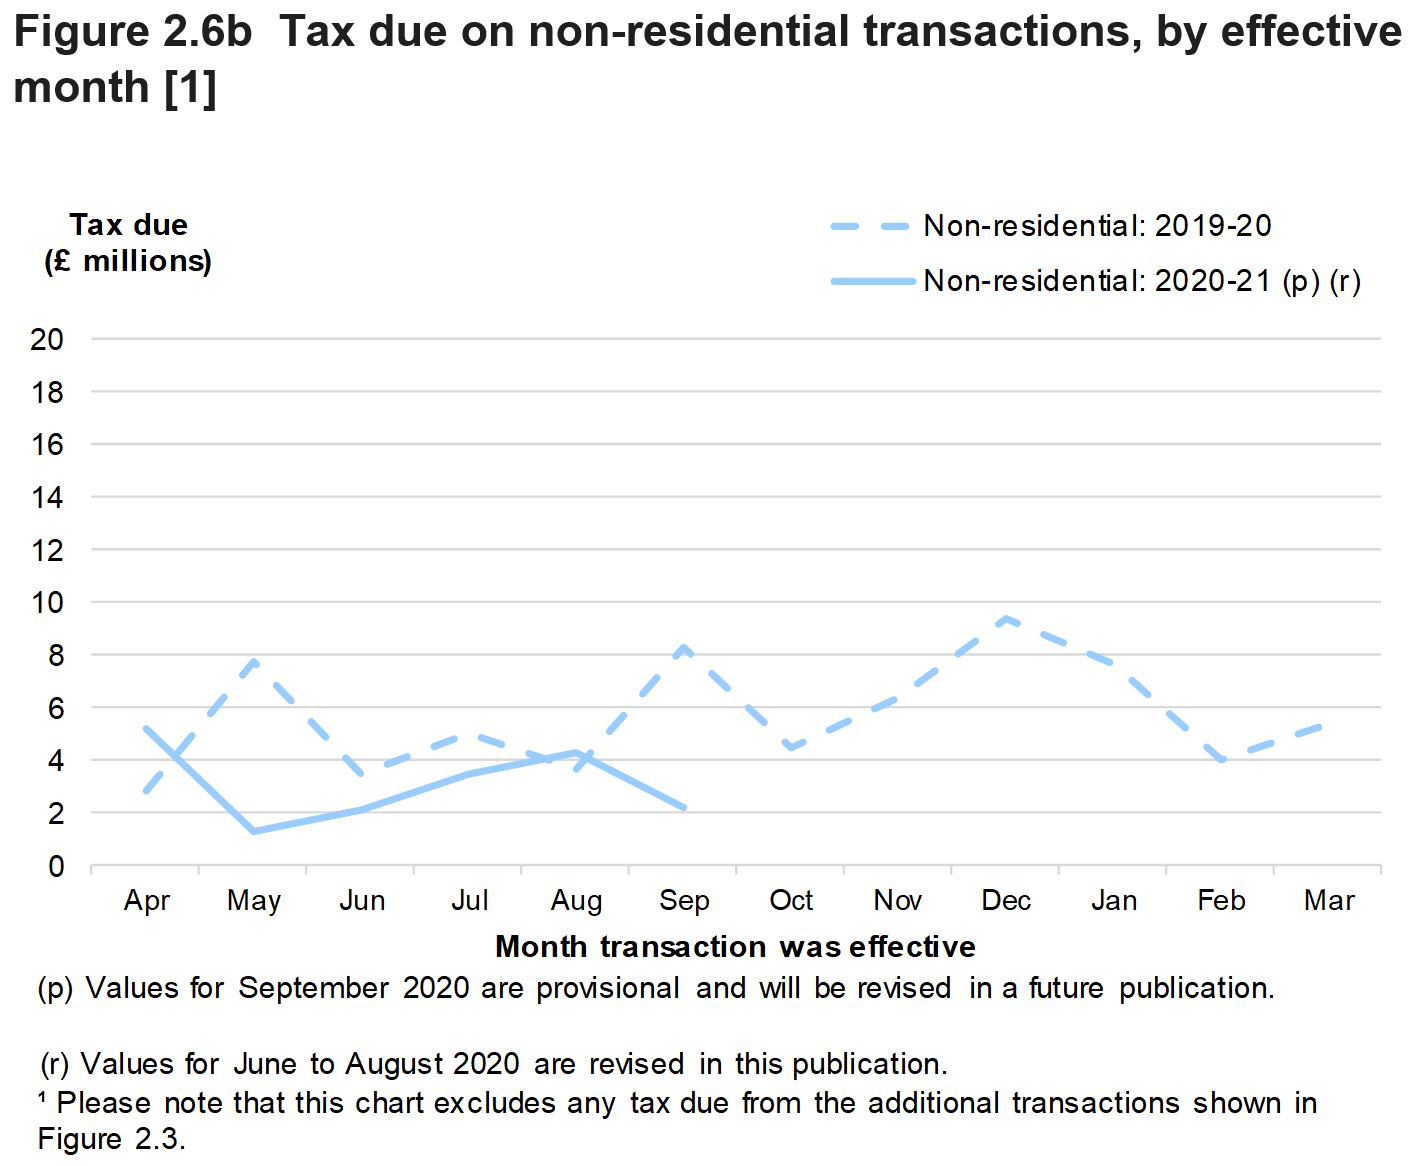
However, as figure 2.6b shows there is a more noticeable difference in revenues between the two years (albeit with some volatility) which may suggest that some larger transactions have been delayed. We will monitor this and report further as the data develops into next year.
LTT statistics by time period and transaction type on StatsWales (includes data for 2018-19, not presented above)
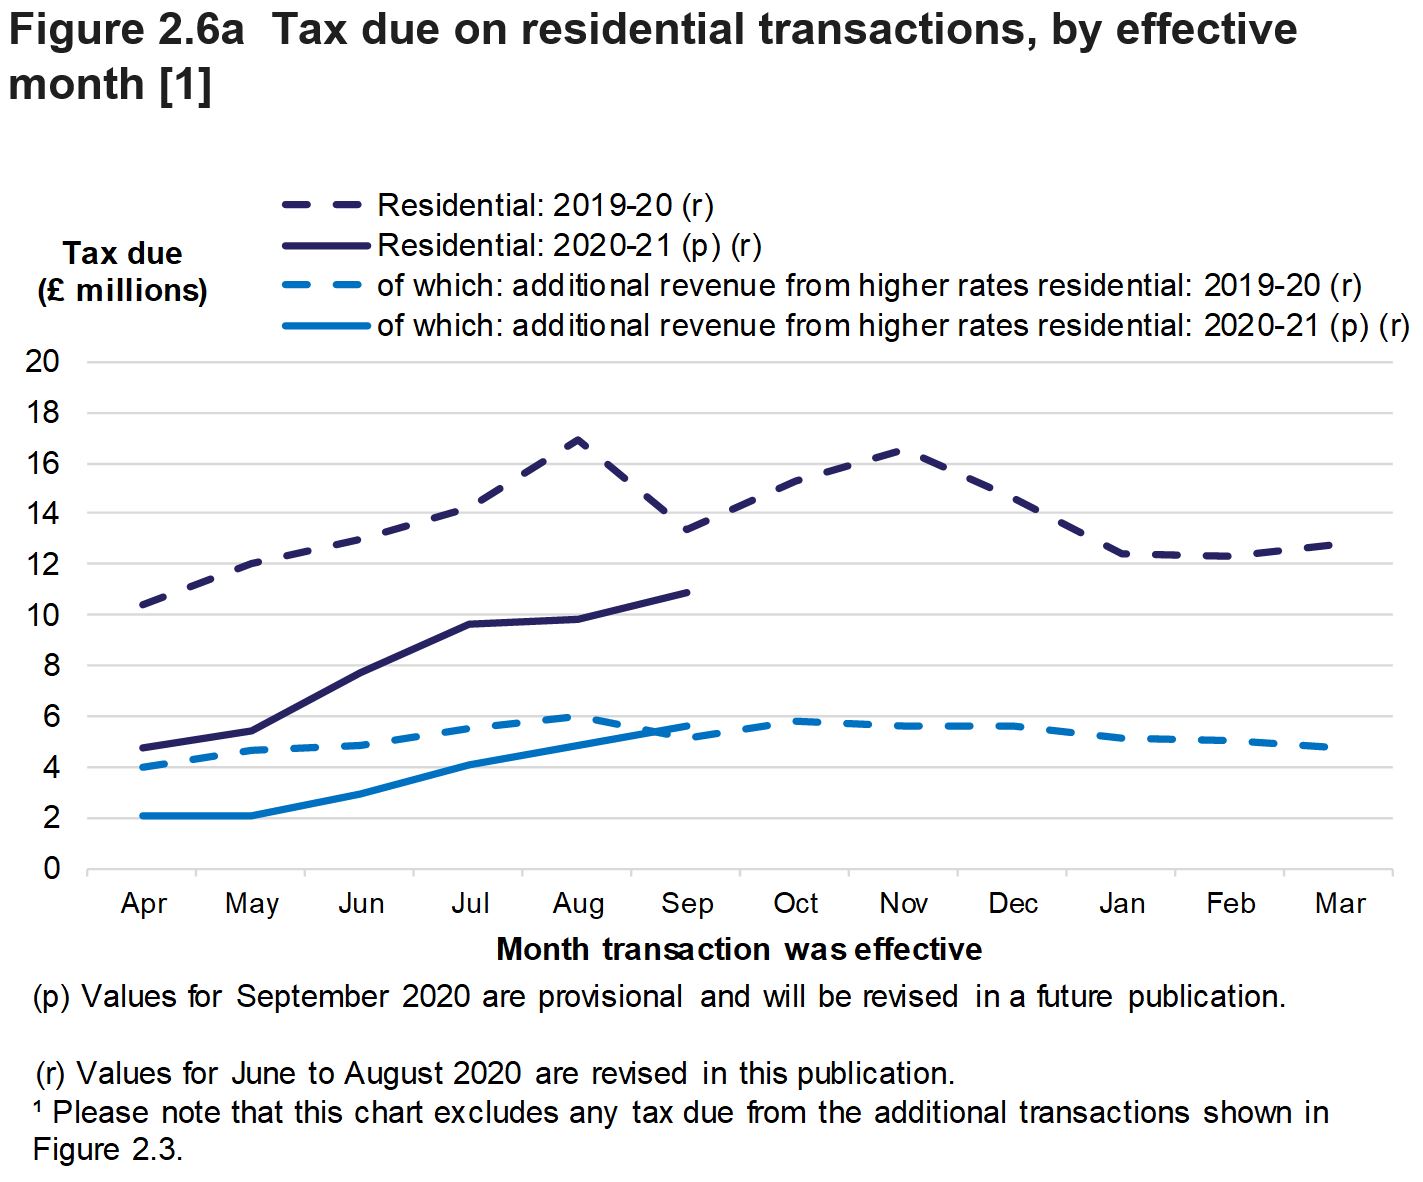
As may be expected, similar trends are seen in the monthly residential tax due as are seen in the monthly counts of transactions, although there has been a greater recovery in revenues for higher rates transactions than for all residential transactions. In September 2020, the additional revenue from higher residential transactions had recovered to the level seen in September 2019, although the former will reduce slightly as refunds yet to be claimed are processed.
There is greater volatility in the monthly series for non-residential transactions. They also make up a larger share of total tax due than the share of the number of transactions.
LTT statistics by time period and transaction type on StatsWales (includes data for 2018-19, not presented above)
Non-residential revenues were steady in April 2020, due to a small number of large transactions in April. Non-residential revenues then fell to the lowest level seen to date in May 2020 (£1.3 million). The third lowest value seen to date was in September 2020 (£2.2 million).
LTT statistics by transaction type and transaction description on StatsWales
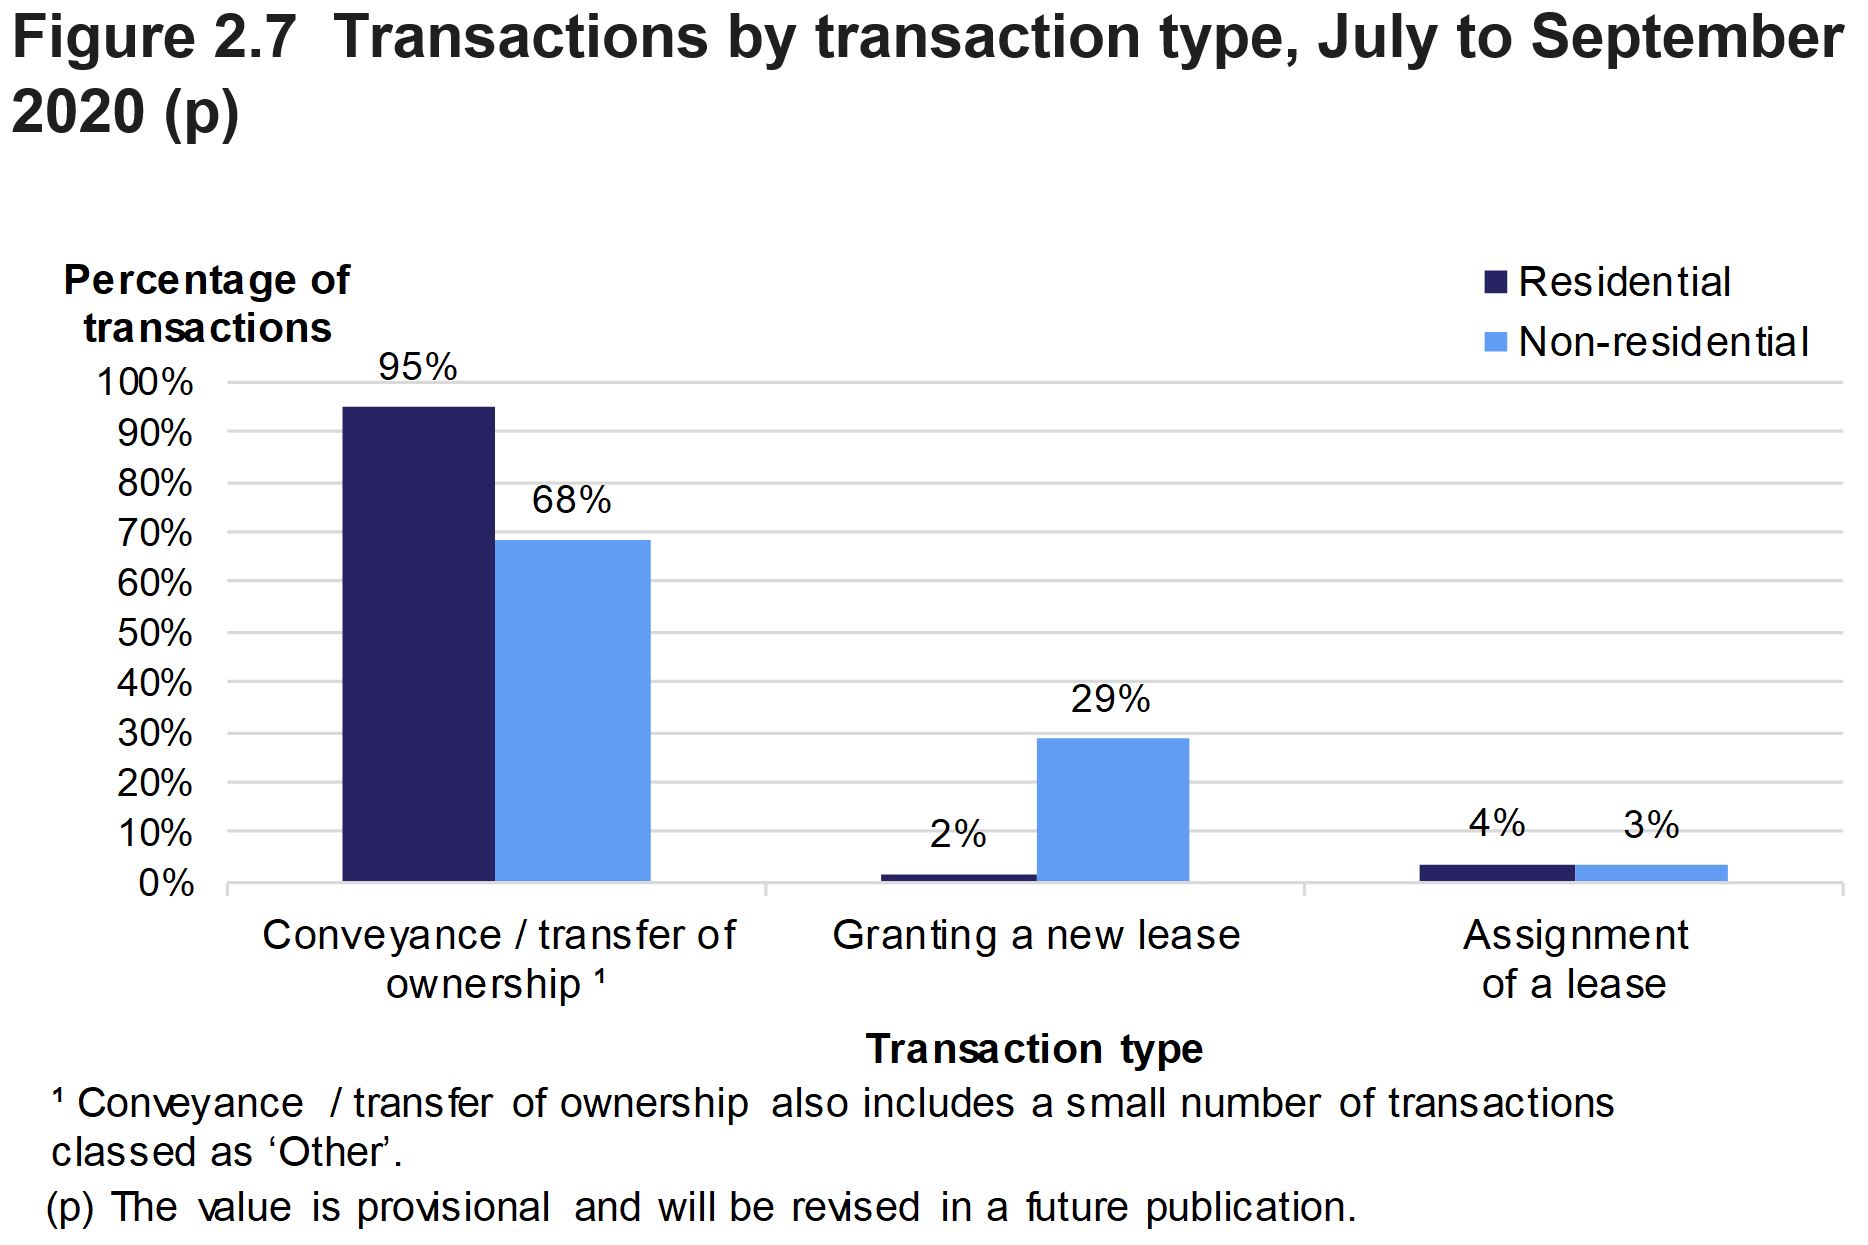
The value of the properties associated with conveyances and transfer of ownership during July to September 2020 was £2.2 billion (not shown in Figure 2.7).
Most transactions in July to September 2020 were associated with a conveyance or a transfer of ownership. This figure was 95% for residential transactions and 68% for non-residential transactions.
A new lease was granted in 29% of non-residential transactions (compared with 2% of residential transactions).
Similar percentages are seen in previous three-month periods and years.
3. Residential transactions by value
LTT statistics by time period and residential transaction value on StatsWales
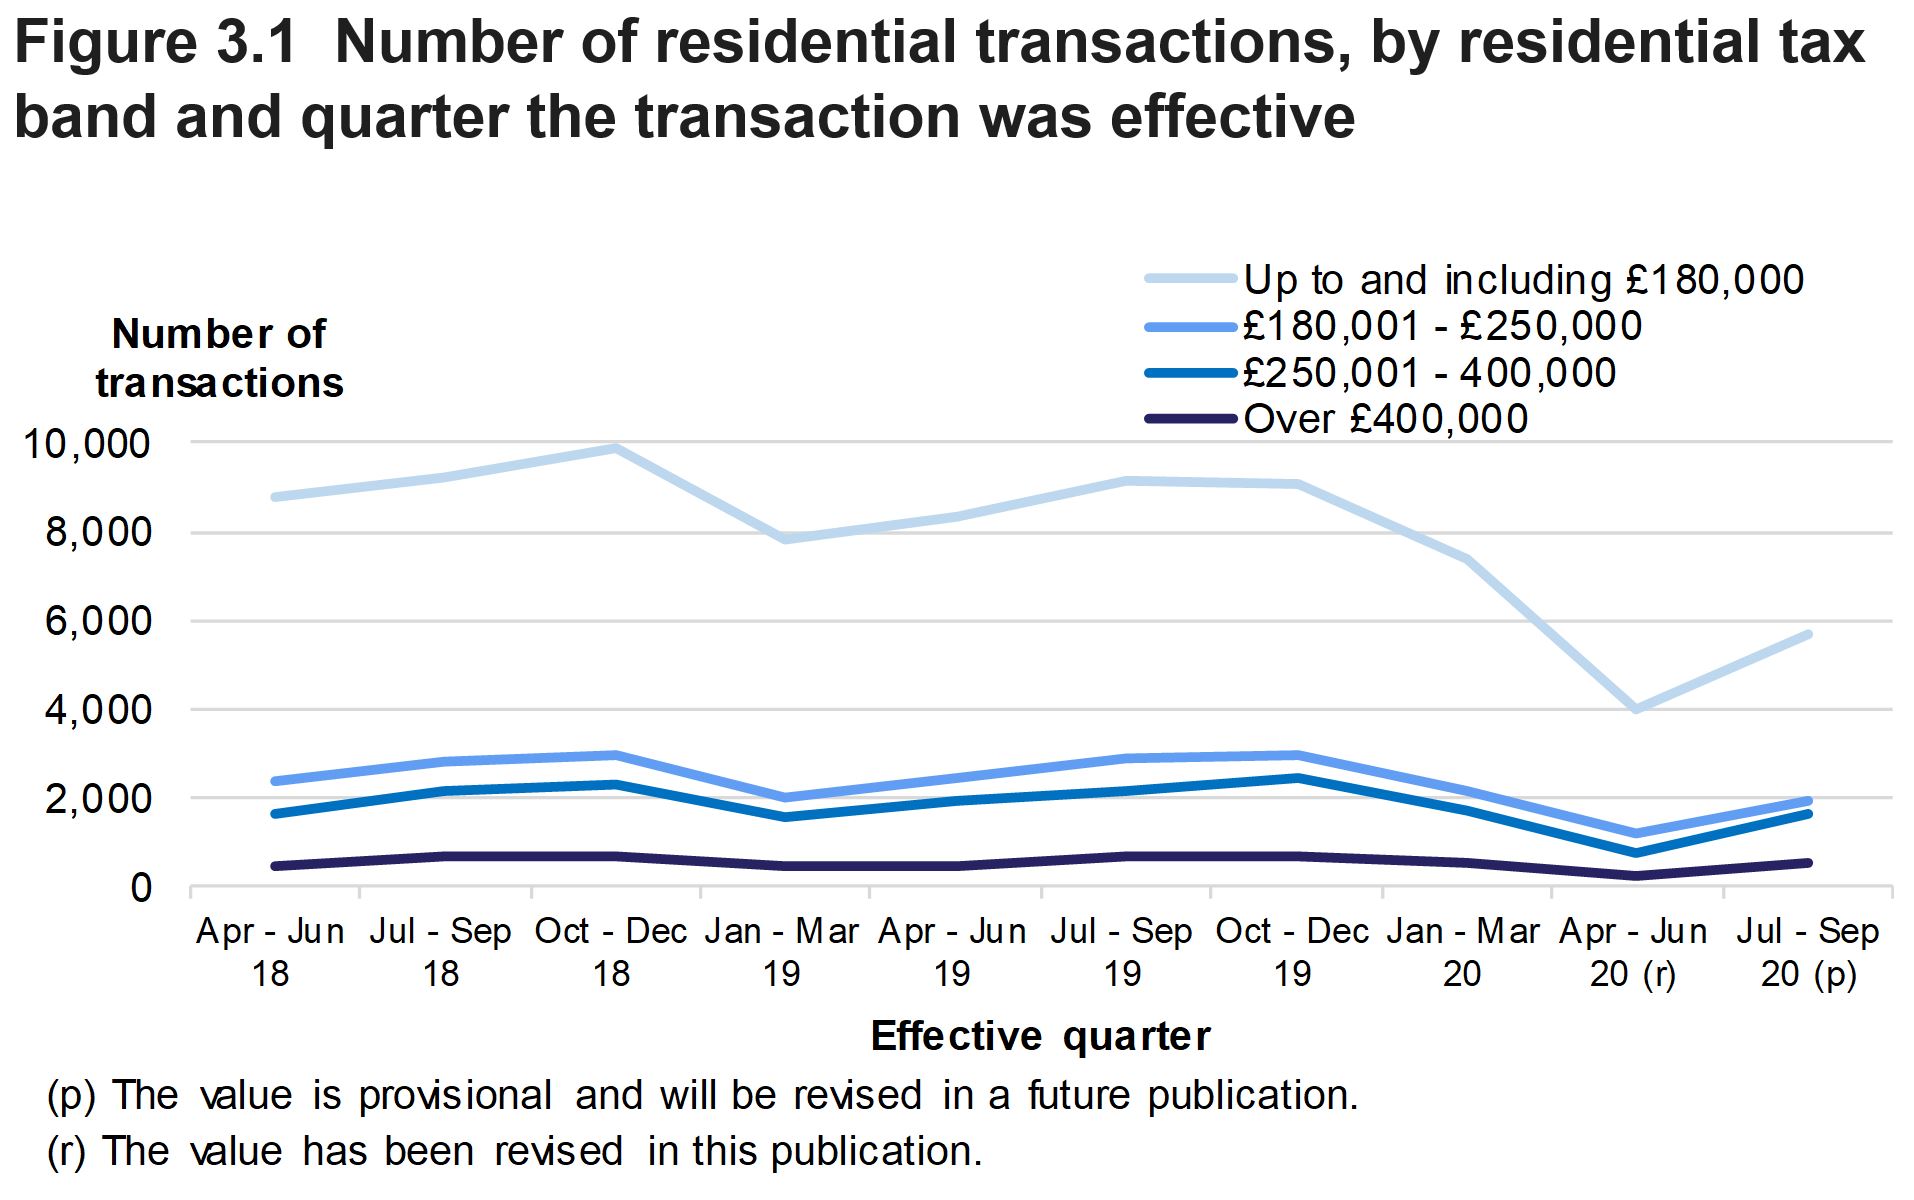
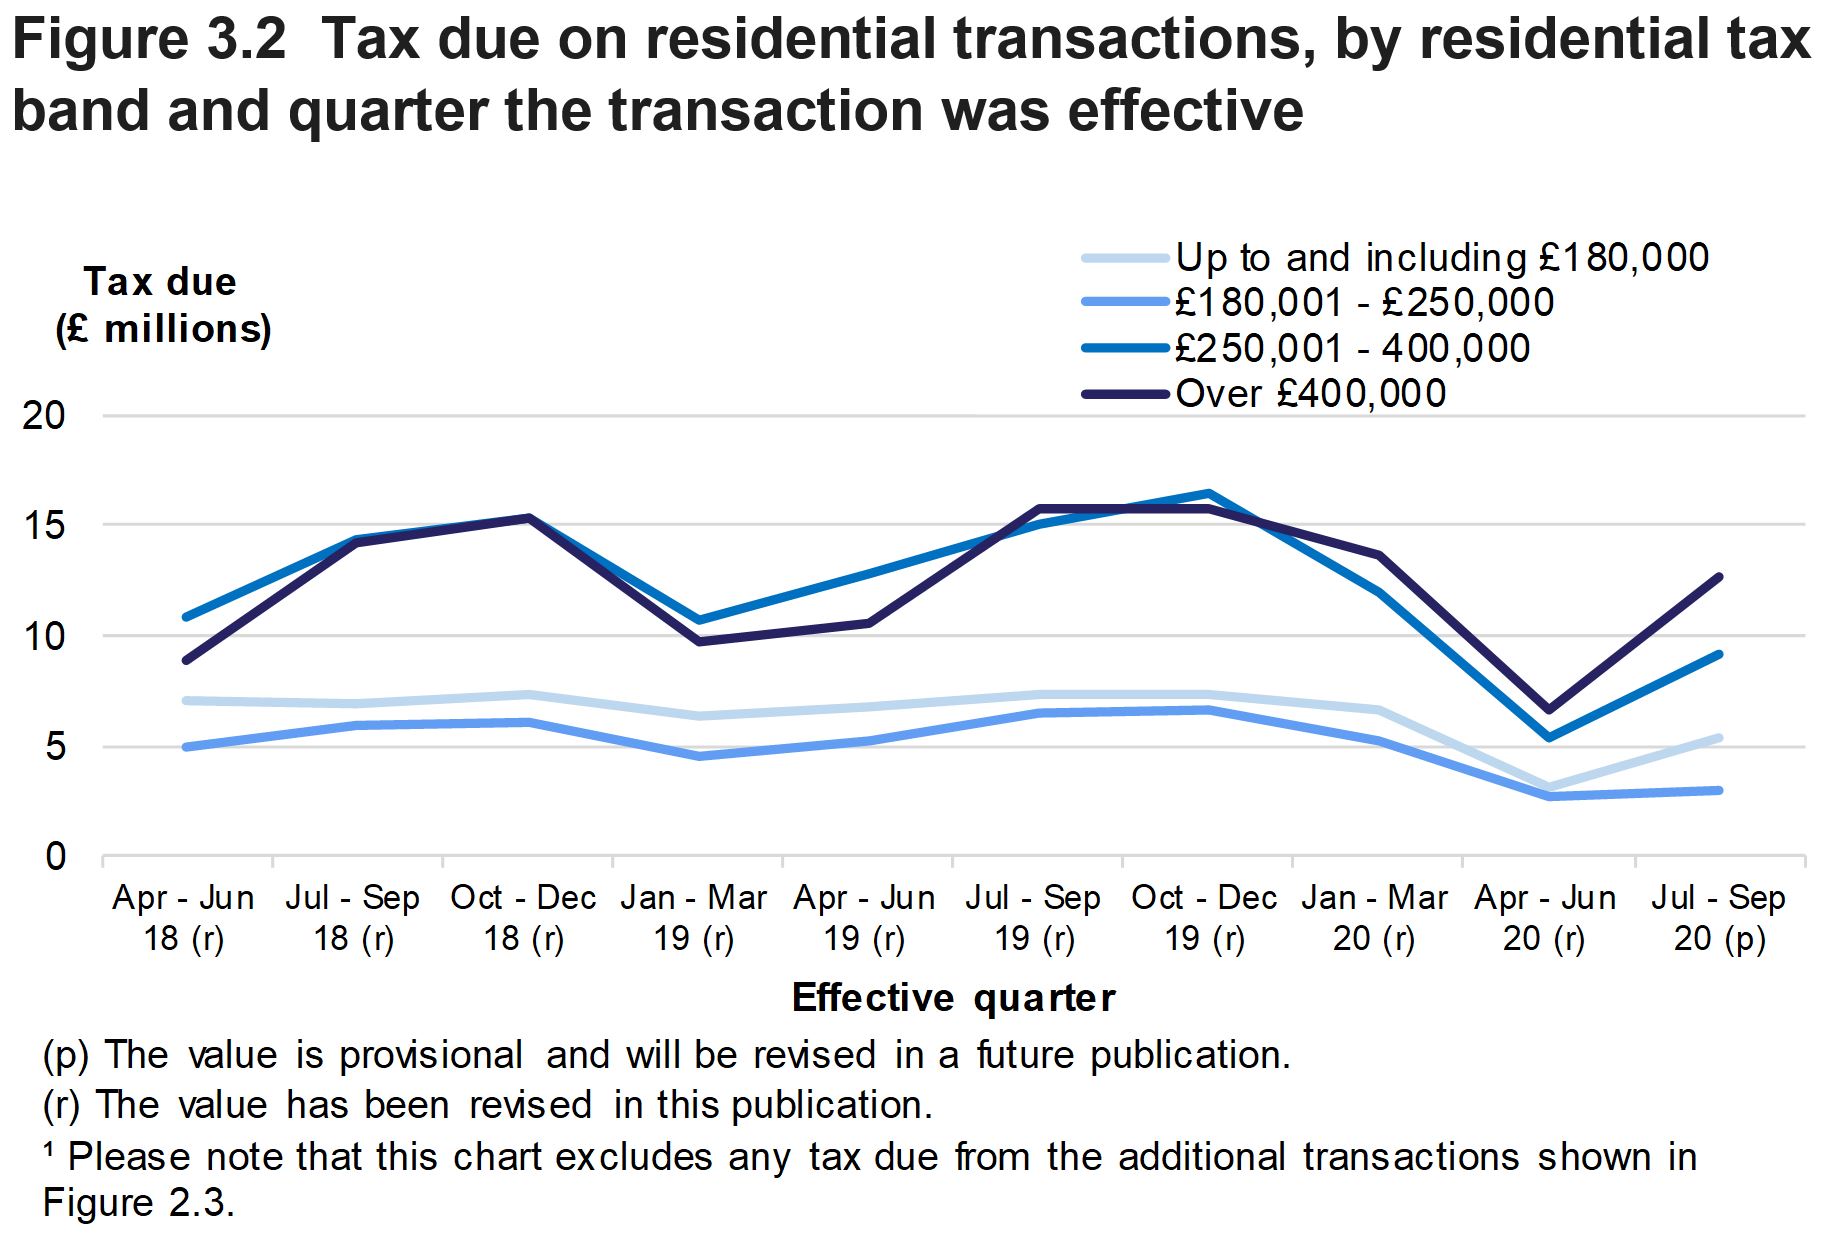
For each tax band, Figures 3.1 and 3.2 show the quarterly trends in the number of residential transactions and tax due. There are six residential tax bands. We have combined the largest three bands here to show results for properties purchased for more than £400,000.
Similar seasonal trends for the tax bands can be seen in both numbers of transactions and tax due. Most of the tax bands show a fall in transactions and tax due in January to March (compared with the preceding October to December).
However, there is greater volatility in the trends when considering the tax due on properties in the higher value bands. For properties purchased for more than £400,000, the tax due in October to December 2019 was the highest quarterly value seen to date. This was also the case for properties purchased for between £250,000 and £400,000.
In April to June 2020, the number of transactions and tax due in each band fell to the lowest levels seen to date. Transactions and tax due in each band partly recovered in July to September 2020. To understand these trends, users should refer to the section of this release ‘Effects of coronavirus (COVID-19) and the LTT rate change on 27 July 2020’.
LTT statistics by time period and residential transaction value on StatsWales
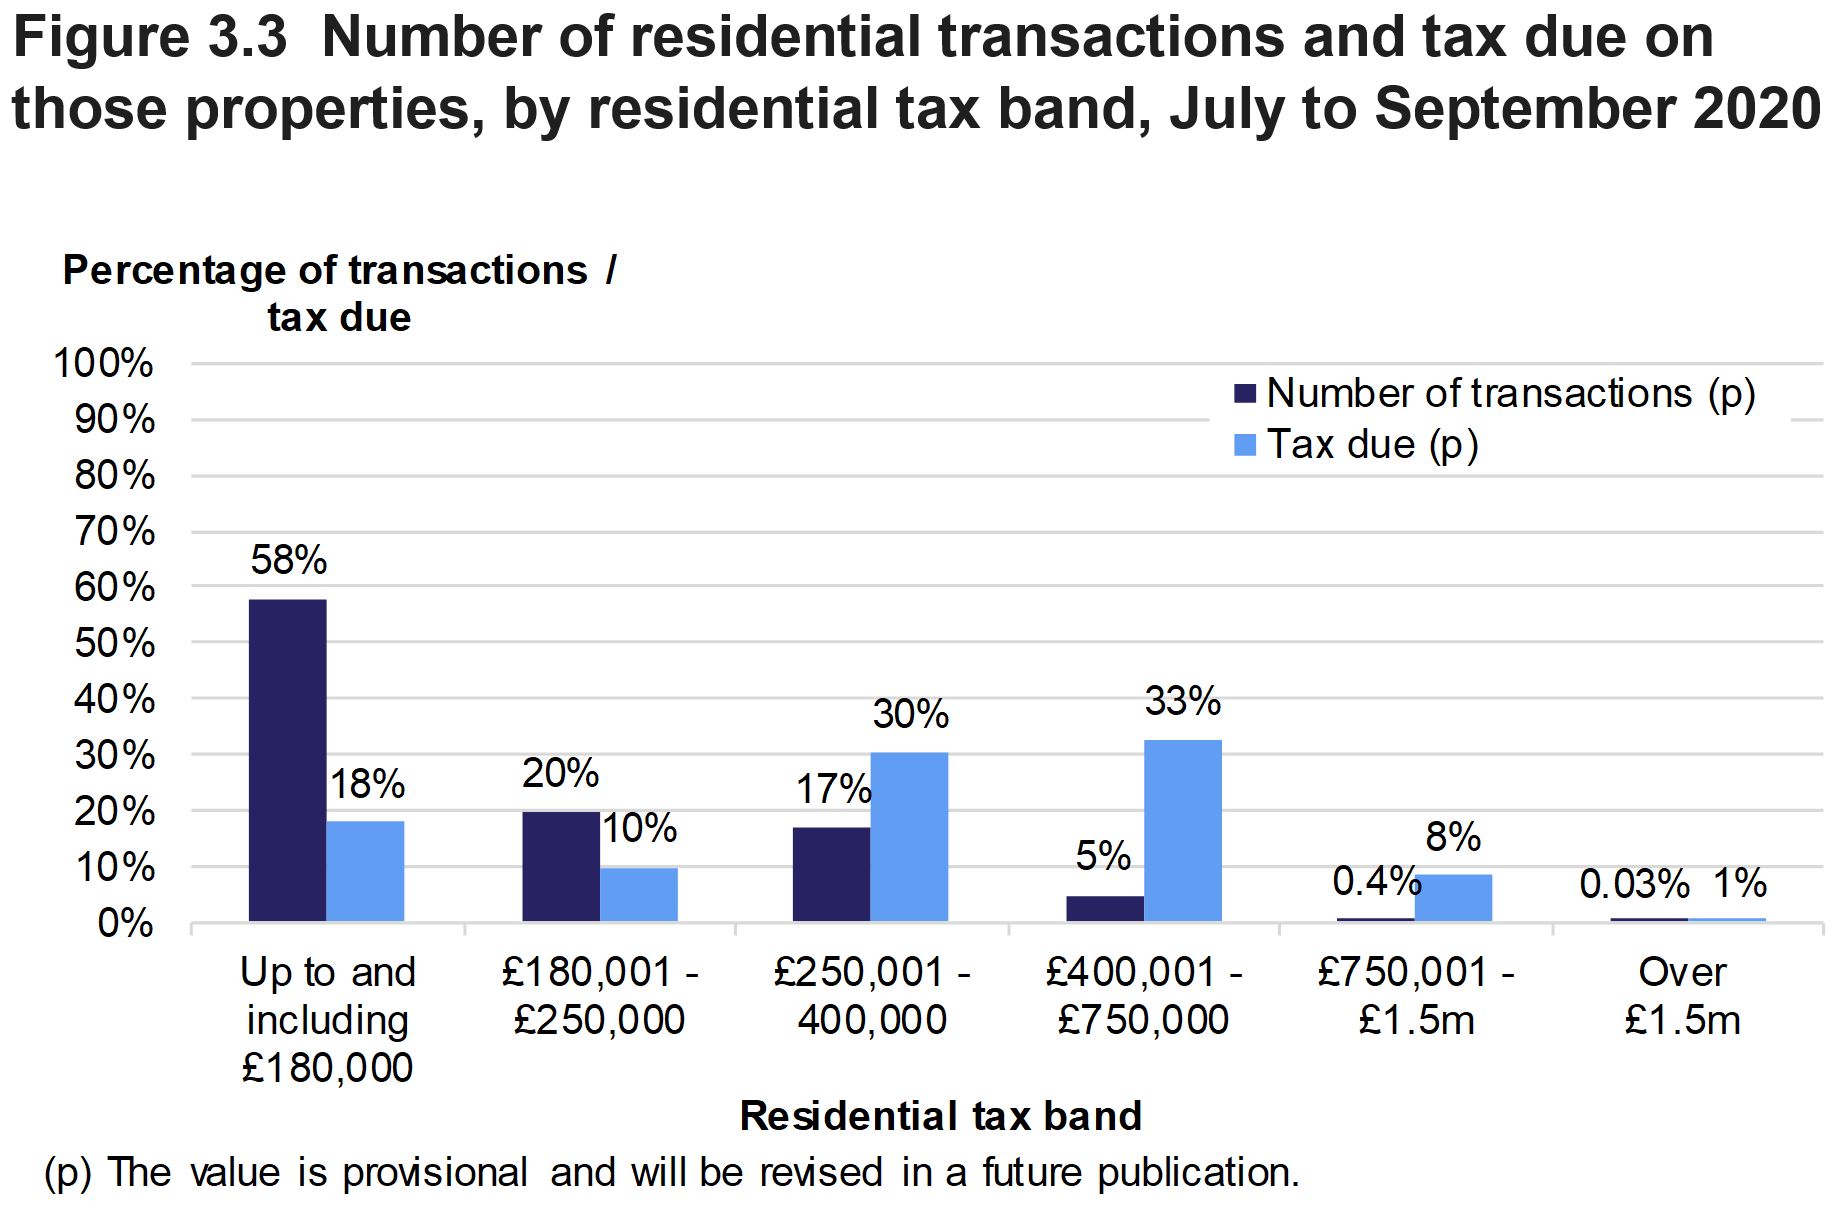
In July to September 2020, nearly three fifths of residential transactions were within the first tax band (purchase price £180,000 or lower). Although the main tax rate on residential transactions of up to £180,000 is 0%, these transactions still accounted for around a sixth of total residential tax due, which relates to the higher rates residential component of the tax.
The 20% of transactions in the second tax band (purchase price £180,001 to £250,000) accounted for a lower proportion of the tax due (10%) than seen in previous quarters (previously around 15%). This effect would be expected due to the LTT rate change on 27 July 2020.
Combining the fourth, fifth and sixth bands (purchase price of greater than £400,000), these accounted for only 5% of transactions. However, the tax due for these transactions accounted for 42% of the total residential tax due.
4. Non-residential transactions by value
LTT statistics by time period and non-residential transaction value on StatsWales
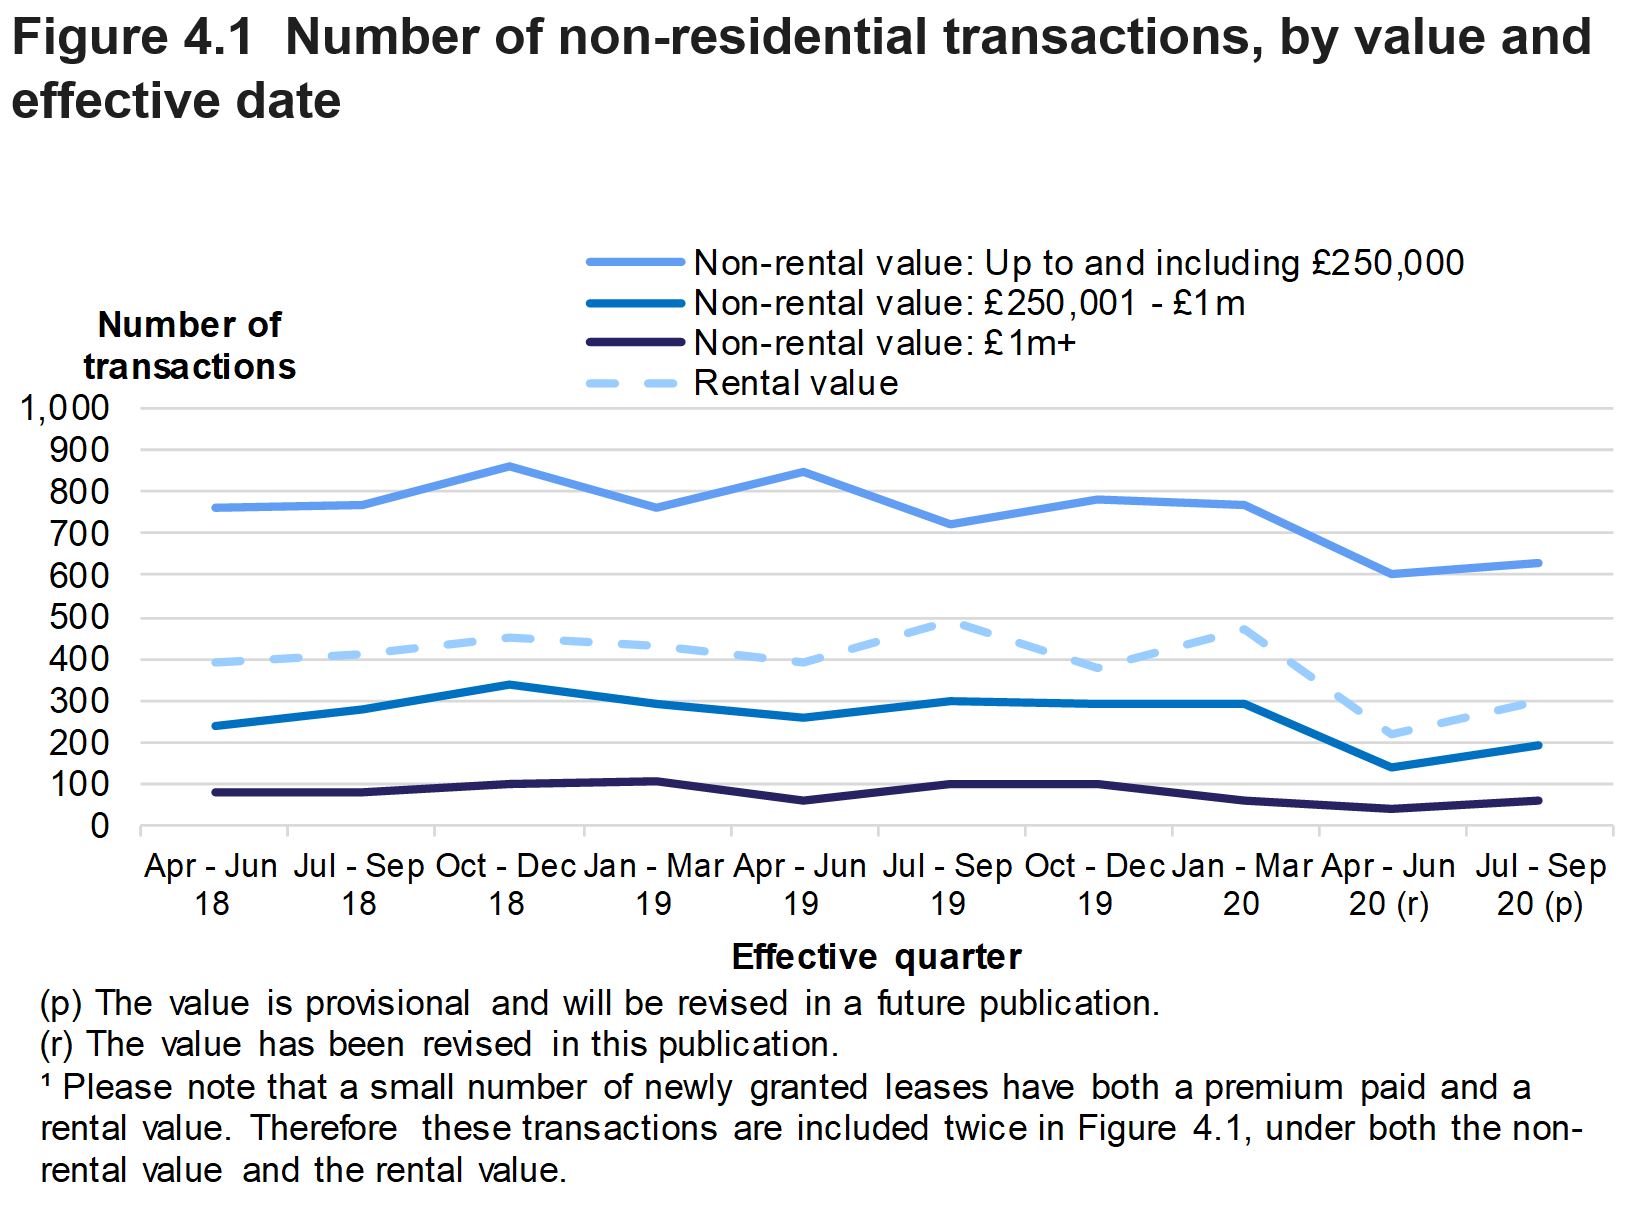
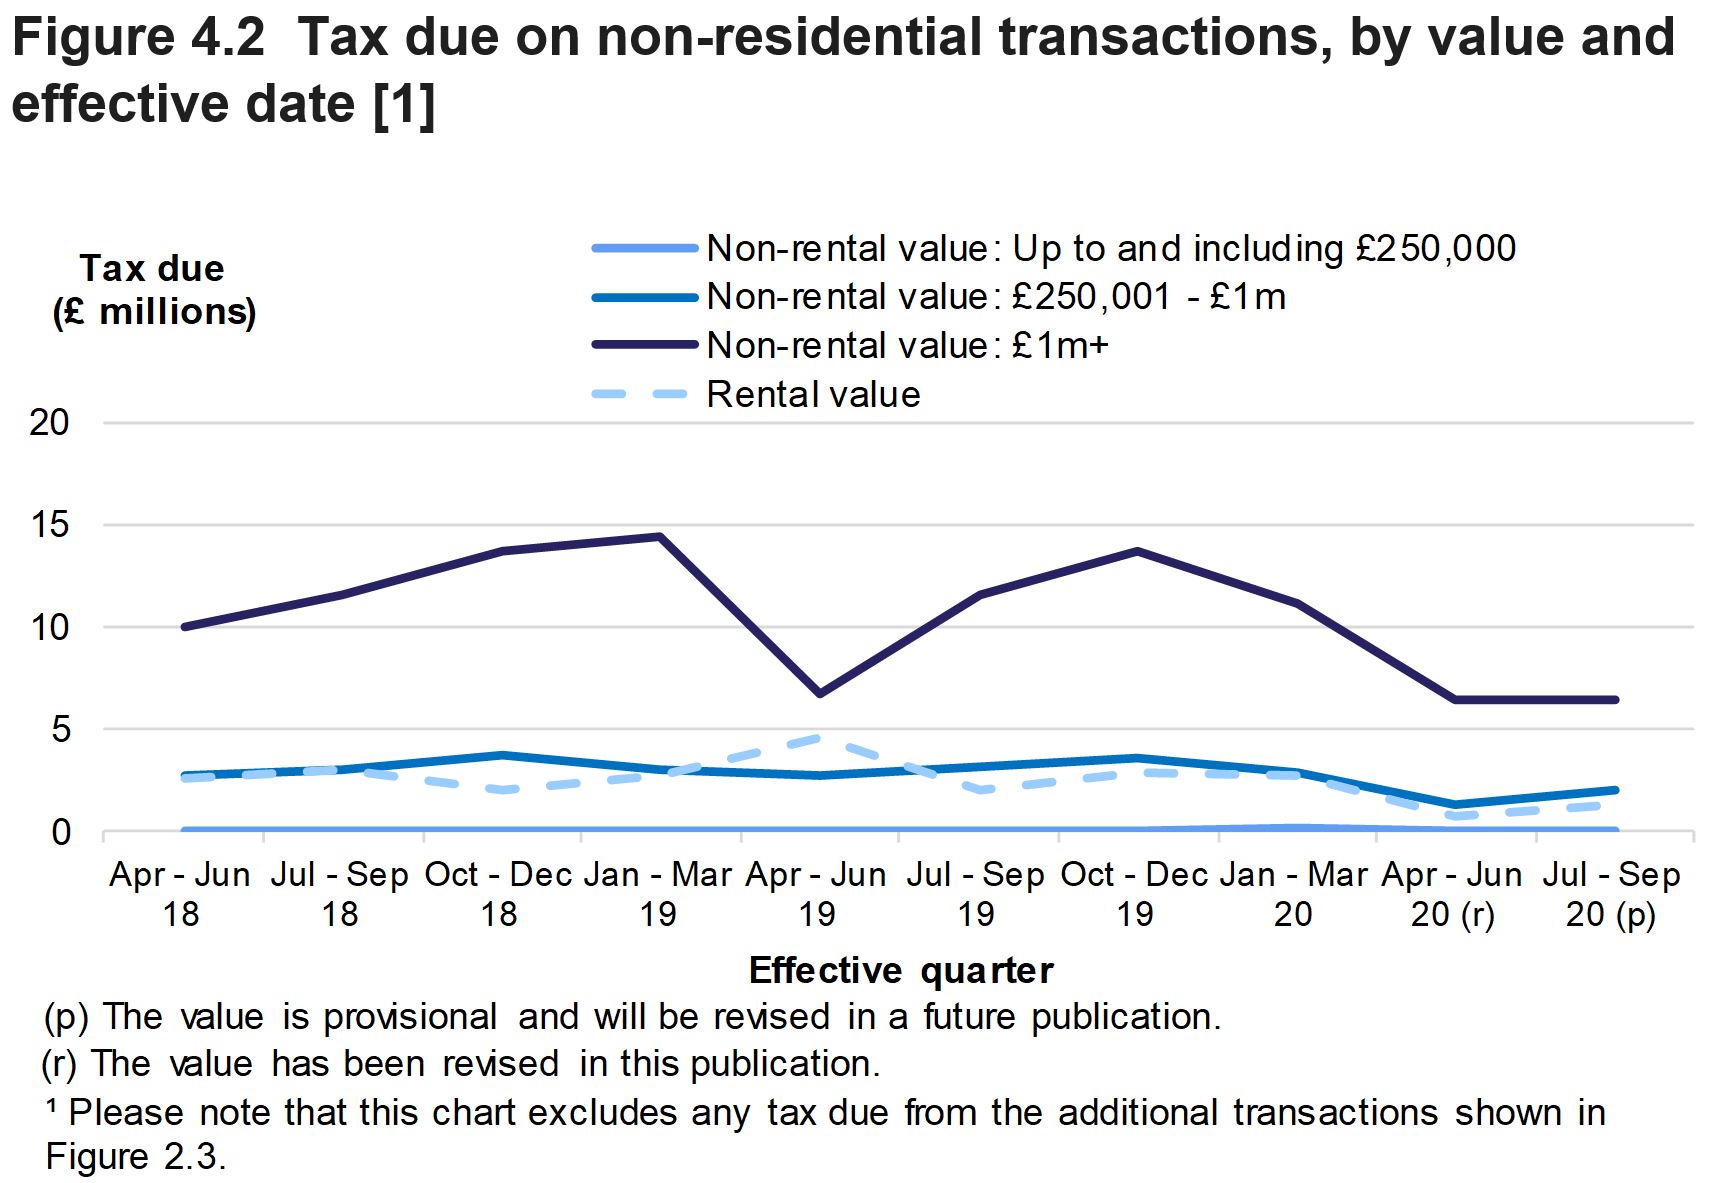
For each tax band, Figures 4.1 and 4.2 show the quarterly trends in the number of non-residential transactions and tax due. There are four tax bands for the non-rental value. We have combined the smallest two bands here to show results for properties with a non-rental value than £250,000.
Figure 4.1 shows that in April to June 2020, the number of transactions in each value band fell to the lowest quarterly values seen to date, before recovering partially in July to September 2020. To understand these trends, users should refer to the section of this release ‘Effects of coronavirus (COVID-19) and the LTT rate change on 27 July 2020’.
In each three-month period since April 2018, around 50% to 70% of the tax due has been contributed by transactions with a non-rental value greater than £1 million. In each three-month period, around 10% to 30% of the tax due has been contributed by the rental value of non-residential properties.
LTT statistics by time period and non-residential transaction value on StatsWales
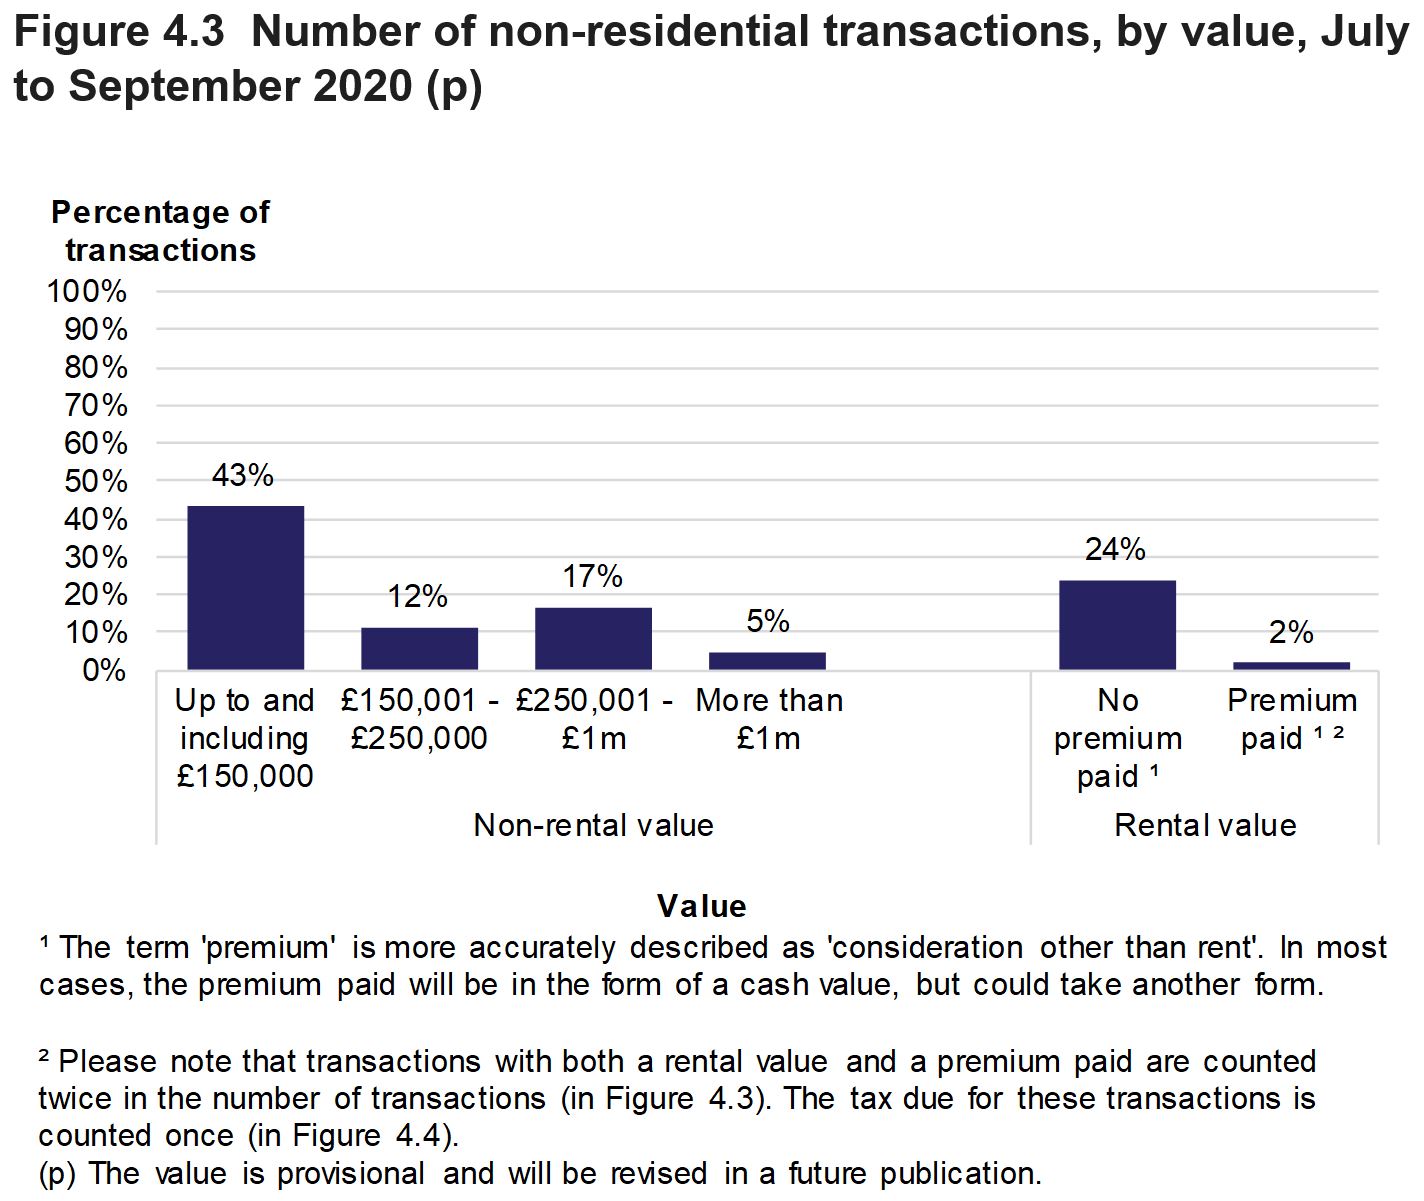
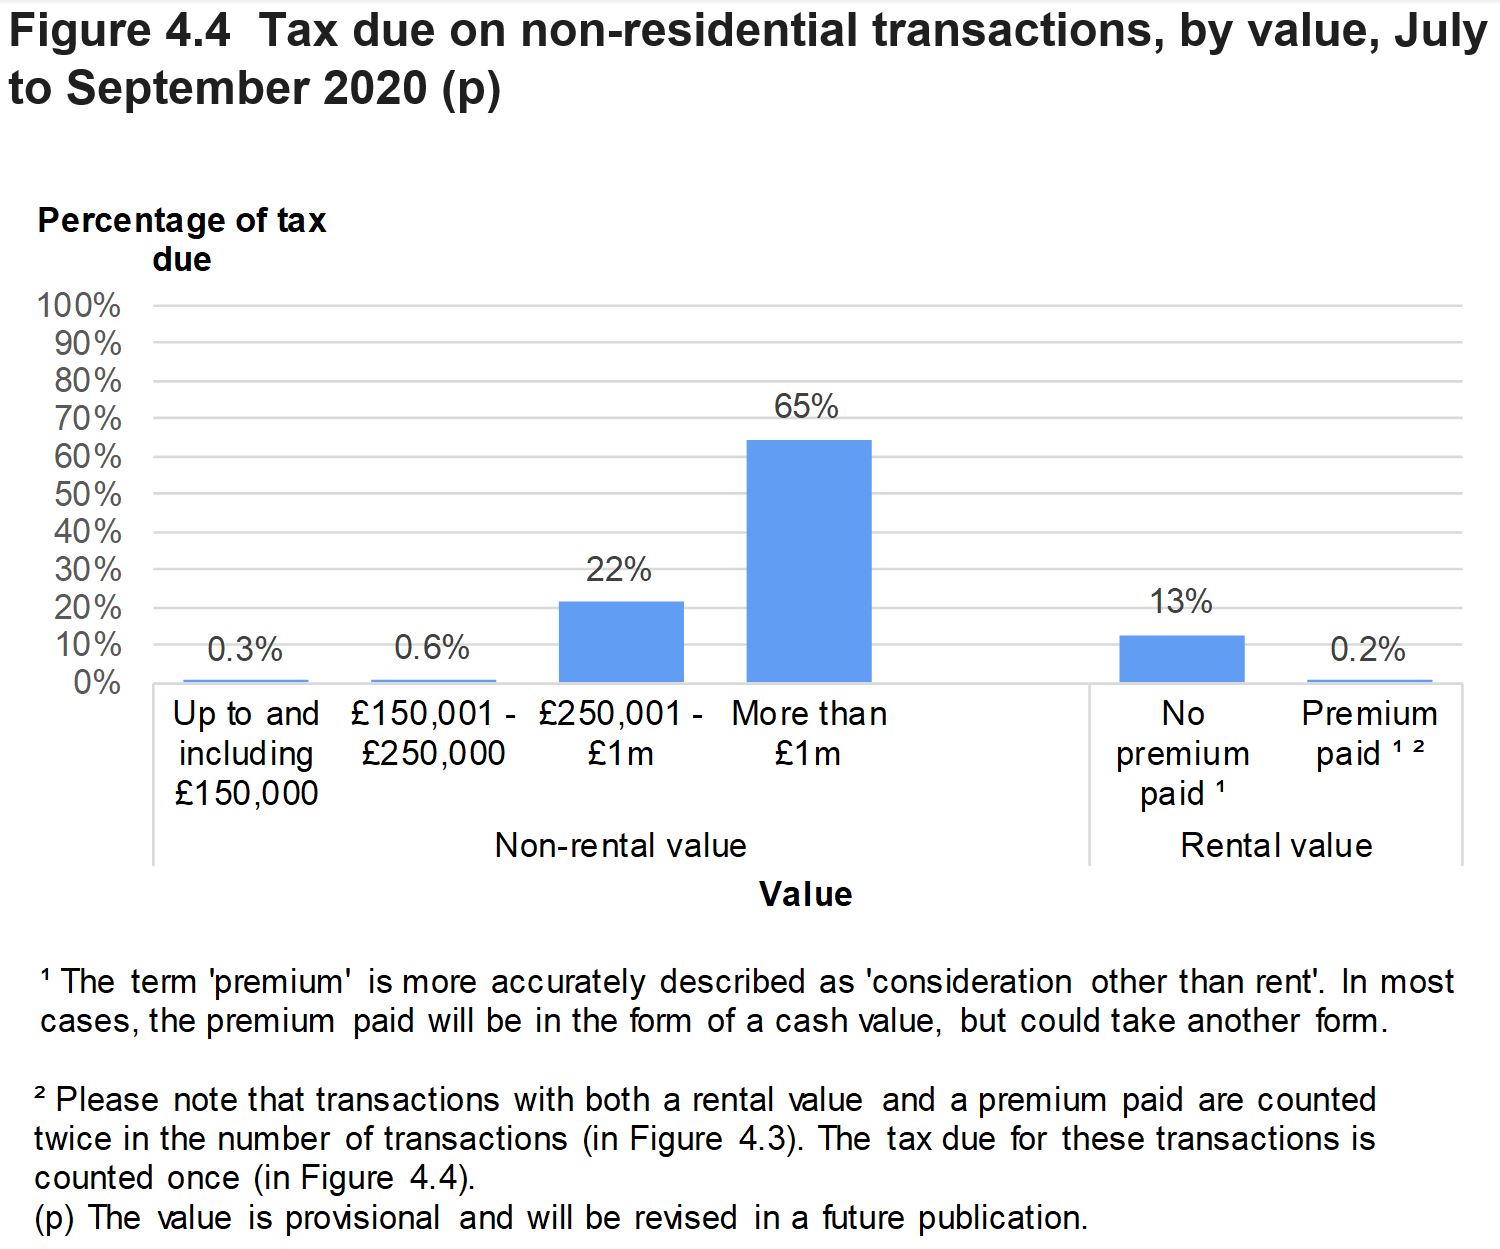
Figure 4.3 shows that in July to September 2020, 5% of non-residential transactions had a non-rental value of more than £1 million. These transactions accounted for 65% of the non-residential tax due (Figure 4.4).
Figure 4.3 also shows that for 26% of non-residential transactions in this period, a rental value was associated with the property (which contributed to the tax paid on the transaction).
The rental value of non-residential properties accounted for 13% of the total non-residential tax due (Figure 4.4).
5. Reliefs
Taxpayers can claim reliefs on both residential and non-residential transactions. Reliefs reduce the amount of tax due when certain conditions are met. More than one relief can be applied to a single transaction.
Reliefs may reduce the tax due:
- To zero, known as a full relief
- Or by a certain percentage or amount, known as a partial relief
LTT statistics on reliefs by measure and transaction type on StatsWales
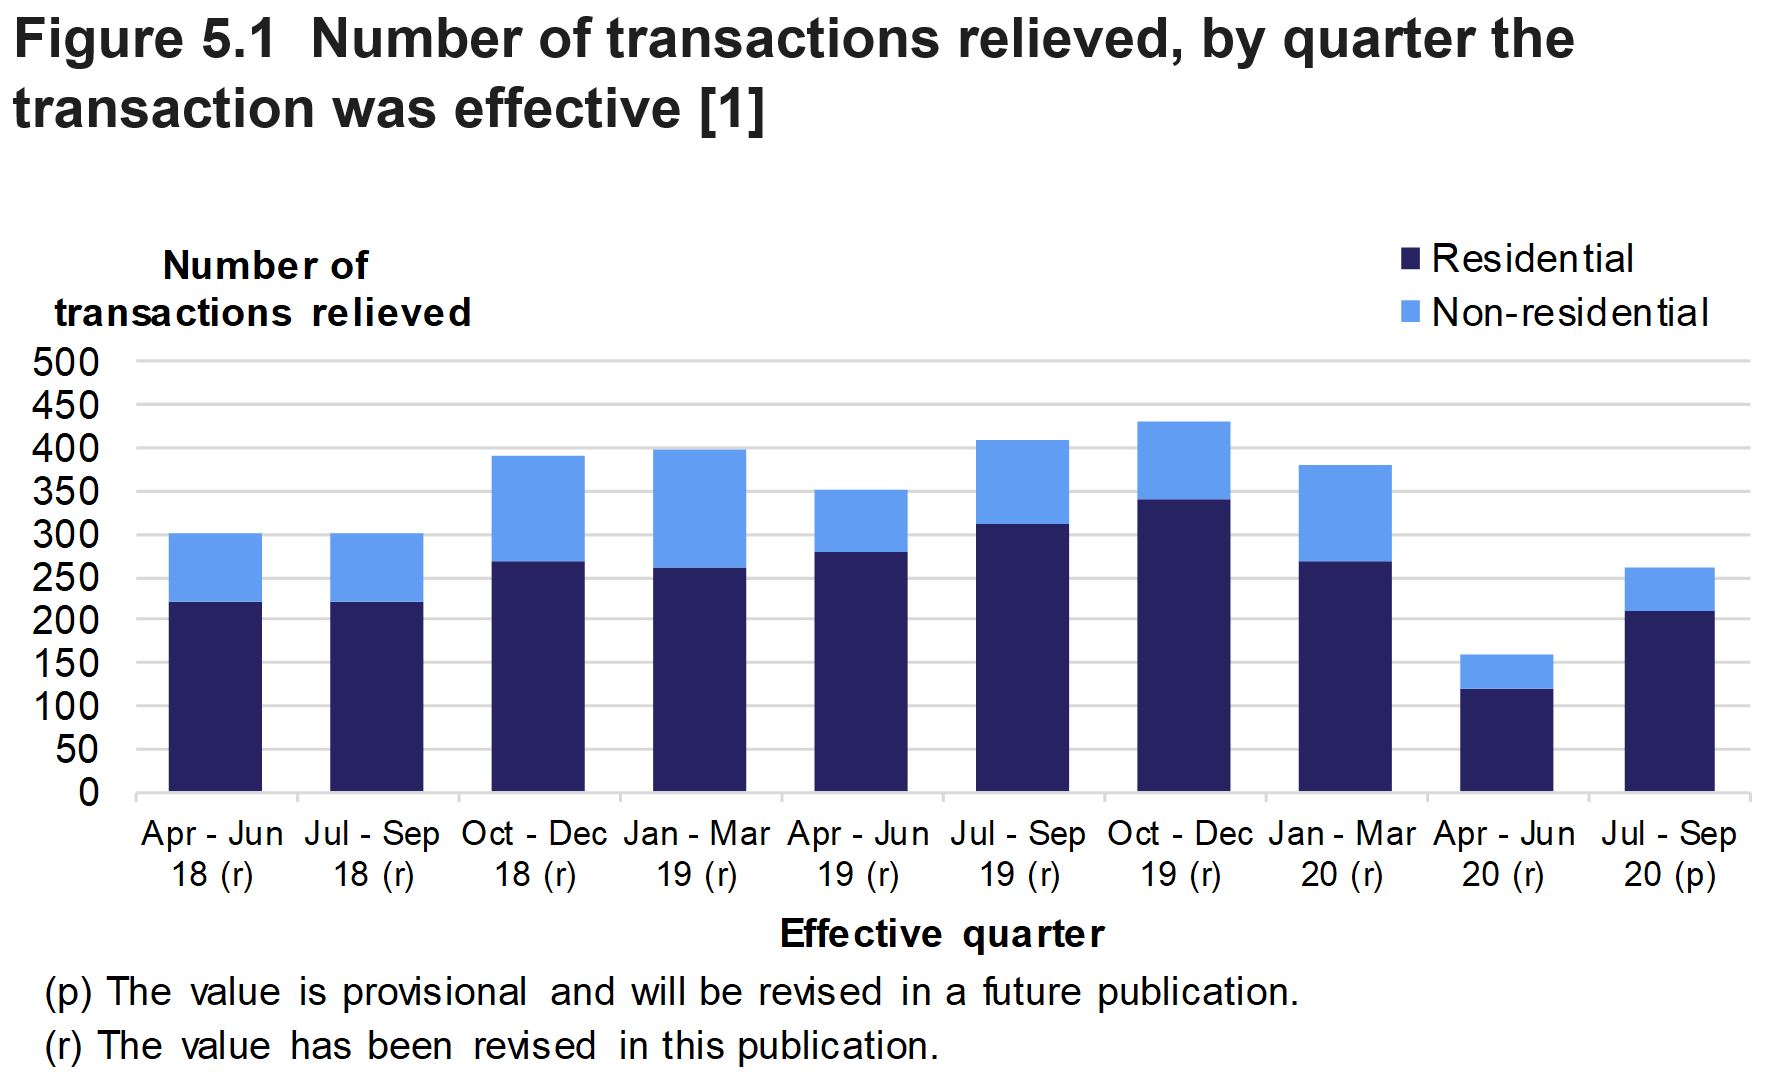
There were 260 transactions in July to September 2020 with reliefs applied to them that reduced the associated tax due. This is the second lowest quarterly value seen to date. The lowest quarterly value seen to date was the 150 relieved transactions seen in April to June 2020. These effects are due to the impact of coronavirus (COVID-19) on the property market from April 2020 and the LTT rate change on 27 July 2020.
On average, there are around 120 reliefs claimed in each three-month period which had no impact on the tax due. These reliefs are excluded from Figure 5.1. Many of them have been reported unnecessarily by the organisations completing the tax return.
As an example, some of these mistakenly claimed reliefs apply to low value residential transactions. Indications are that they are due to a perceived but mistaken need to claim first time buyer relief (which applies for the predecessor tax, but not to LTT). This is known following queries raised with several agents asking why tax reliefs have been claimed where there is no impact on value of the tax. Further information about this category of reliefs is provided in Example 4 in our key quality information.
LTT statistics on reliefs by measure and transaction type on StatsWales
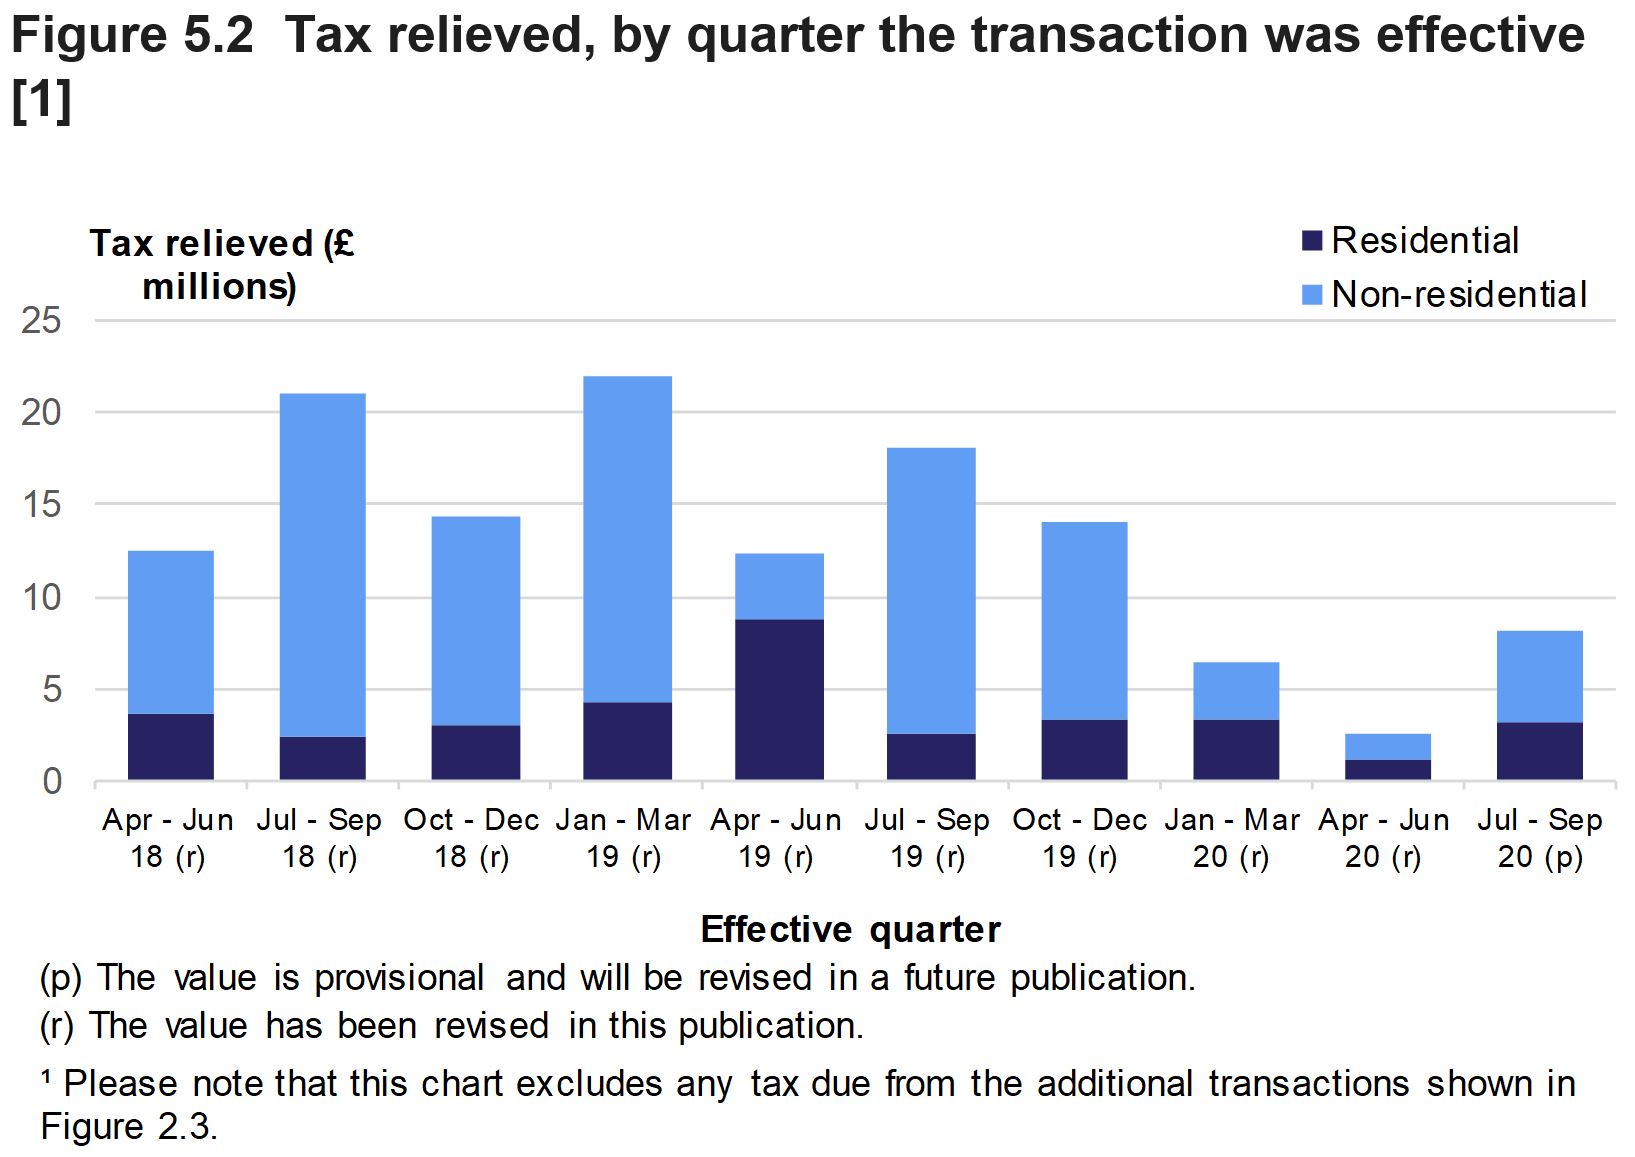
For each three-month period, the numbers of reliefs claimed on residential transactions was higher than for non-residential transactions. The value of reliefs claimed in each three-month has varied considerably over time, along with the share of the value from residential or non-residential transactions. In most of the three-month periods, non-residential transactions contributed over 50% of the total value of reliefs claimed.
However, several large residential transactions in April to June 2019 contributed to residential reliefs being considerably larger than non-residentials reliefs in this period. Also, in January to March 2020 and April to June 2020, non-residential transactions contributed around half of the value of reliefs.
Further data on reliefs is available on StatsWales at the link above, including quarterly data by type of relief.
6. Higher rate refunds
LTT statistics on higher rate refunds by original transaction date on StatsWales
When a taxpayer claims a refund for higher rates residential LTT, the original transaction is amended to a main rate residential LTT transaction. The data in this release is adjusted for any refunds approved by WRA up to and including 19 October 2020.
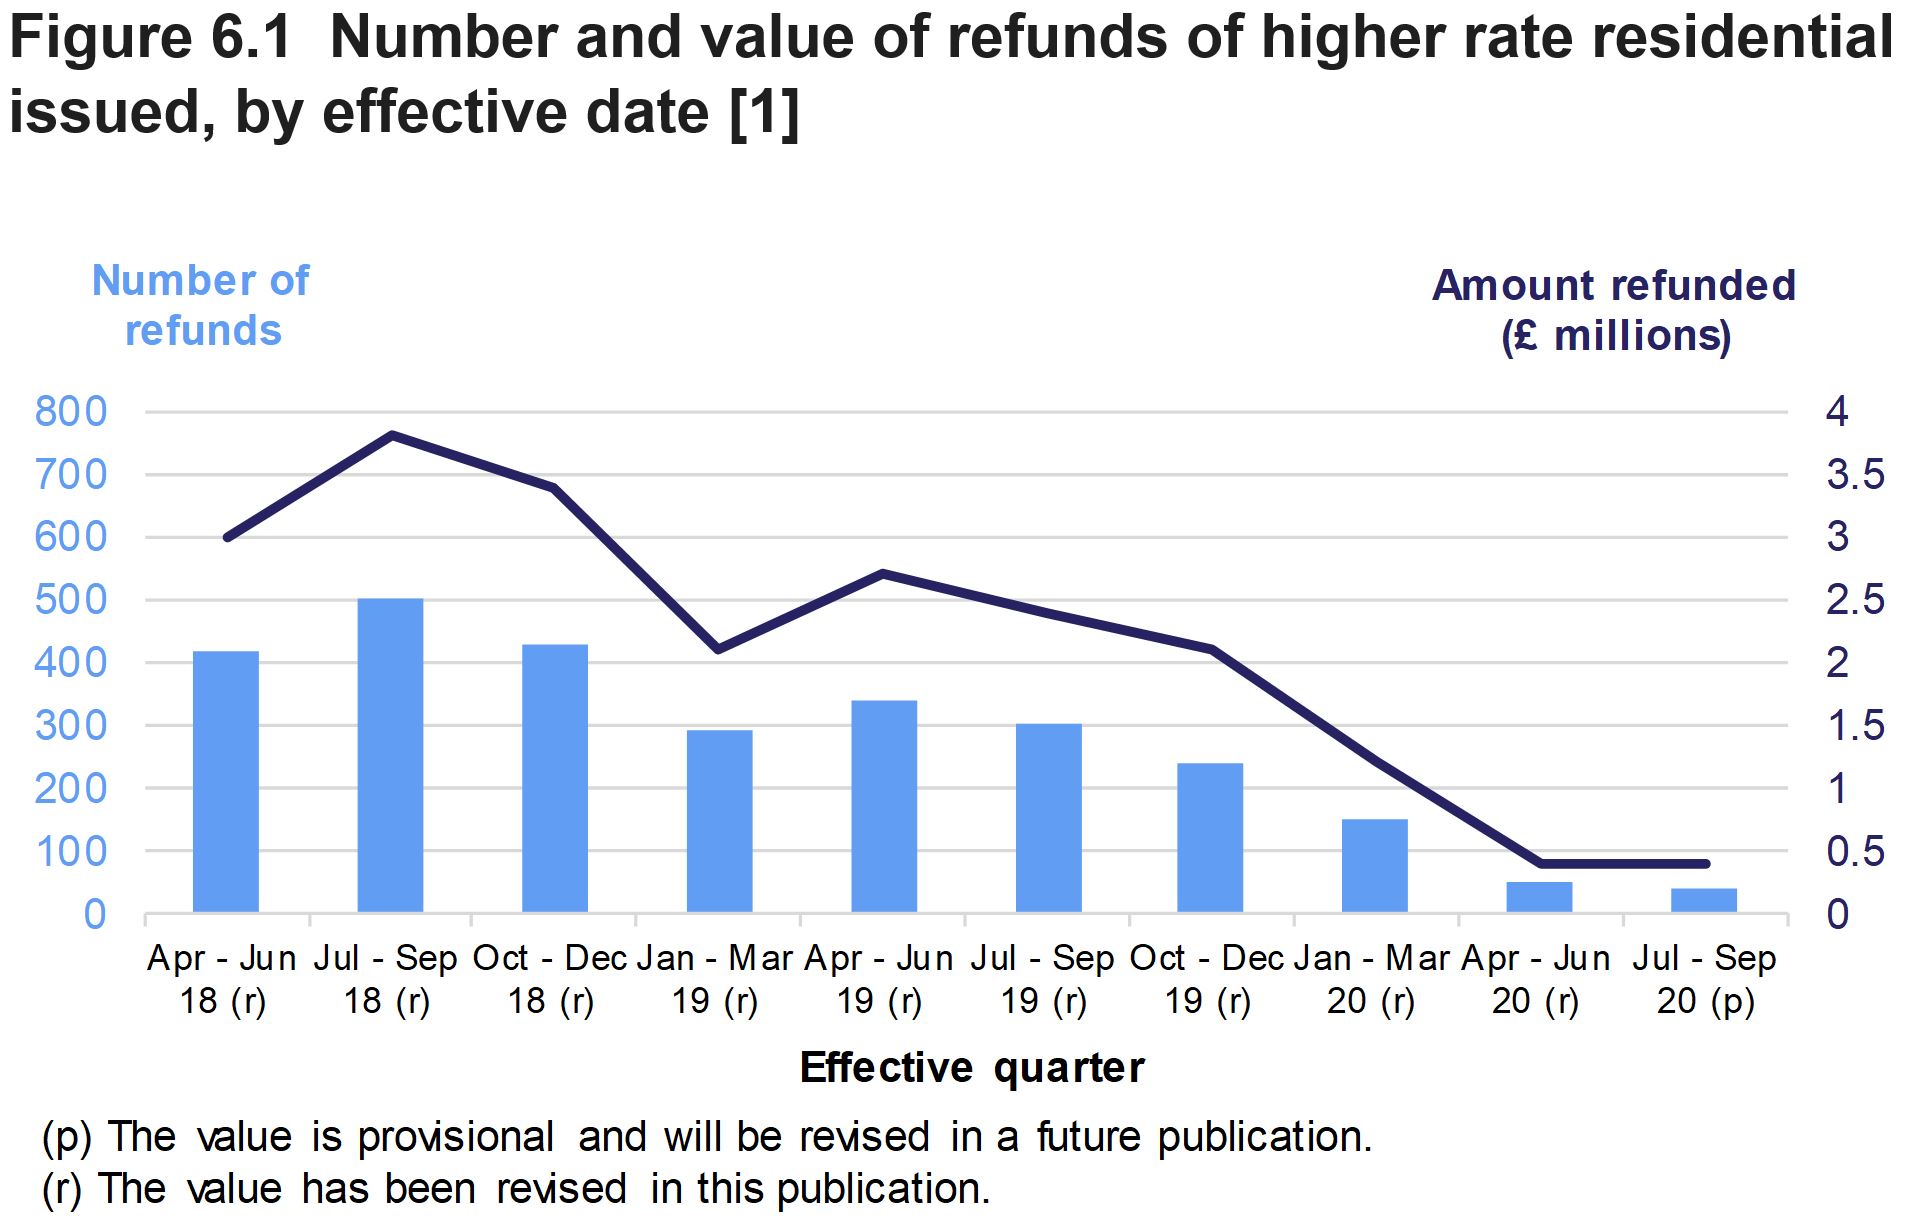
(not shown in Figure 6.1) Cumulatively, 2,740 higher rate refunds were claimed for transactions effective since April 2018, with £21.4 million refunded to taxpayers.
Taxpayers have up to three years to sell their previous main residence and claim a refund. Therefore, all the values in Figure 6.1 will continue to be revised upwards in future editions of our statistics. This will lead to the total tax due in other tables and charts reducing.
The number and value of refunds presented for April to June and July to September 2020 are lower than for earlier periods. This is because compared with earlier periods, not enough time has passed since the transaction was effective for many of the relevant taxpayers to sell their previous main residence and claim their refund.
Refunds of higher rates residential by date the refund was approved
Another useful way of presenting data on higher rates refunds is to use the date when the refund was approved by the WRA. A dataset using these dates and the effective date of the original transaction can be found on the StatsWales website at the link below:
Refunds of higher rates residential (cash basis)
Further information on the refund payments made to taxpayers, by the month in which they were made, can be found at the link below.
LTT statistics on tax paid and higher rate refunds (cash basis) on StatsWales
In the main, these additional data are provided to support forecasting requirements.
Intention to claim a refund of the higher rates element
For all higher rates transactions, the WRA asks the question whether the taxpayer intends to reclaim the higher rates element in future. It will take several years before we know how likely someone is to claim based on their stated intentions (it can take up to three years to make the claim). But we do currently know that around 70% of those who do claim answer this question in the positive.
7. Tax paid
LTT statistics on tax paid and higher rate refunds (cash basis) on StatsWales
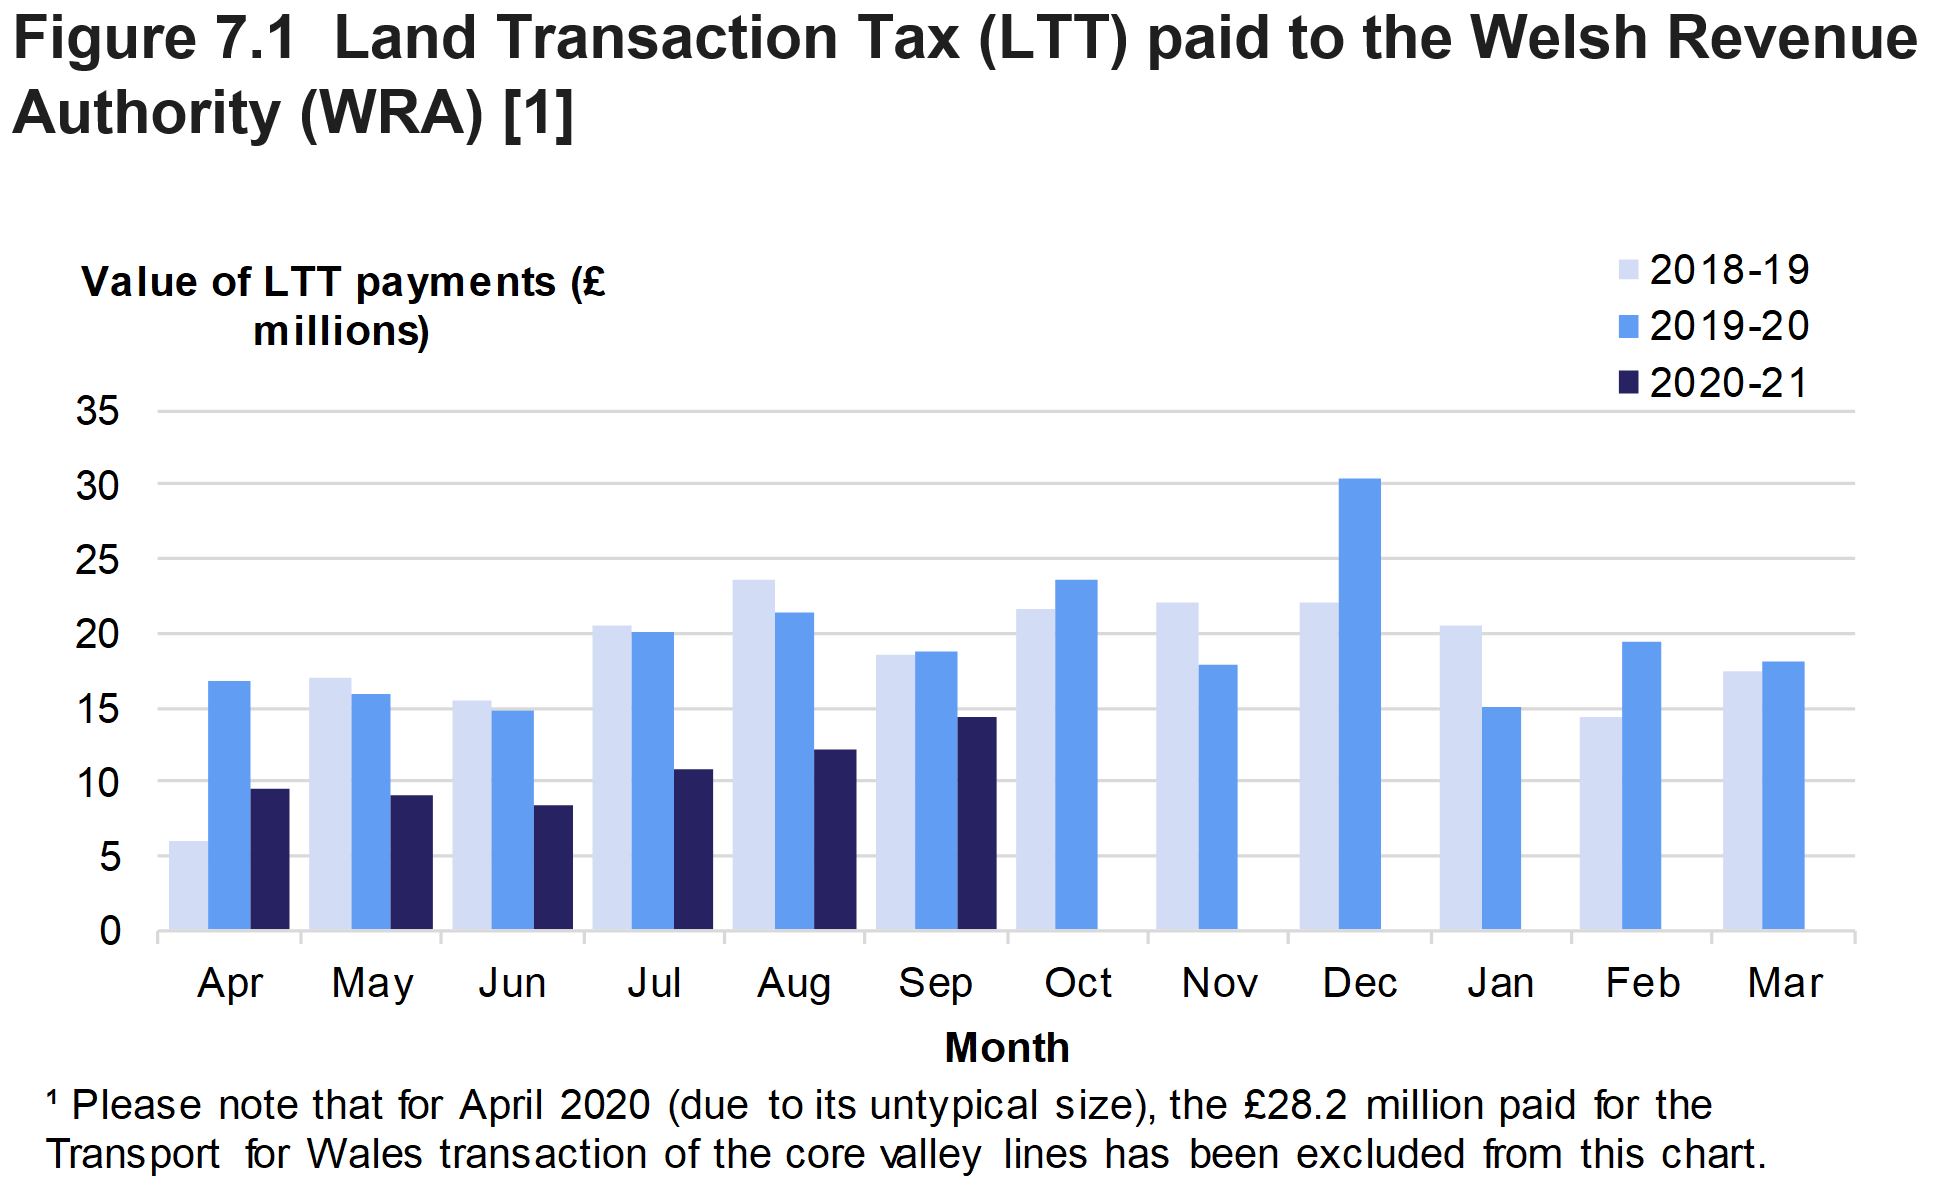
These data on LTT payments received differ from those reported in Figure 2.3 as they relate to the payments received in each month (often referred to as ‘on a cash basis’). This differs from earlier tables in this release which are based on transactions that were effective in the month.
There is a difference in April 2018 as the WRA only started collecting the tax in that month. Therefore, no payments relating to transactions effective in earlier months were relevant.
Excluding the core valley lines transaction (described under Figure 2.3):
- the highest monthly receipts seen to date were in December 2019 (£30.5 million)
- receipts in April to September 2020 were markedly lower than the same months in 2019. In common with other statistics presented in this release, this is due to the impact of coronavirus (COVID-19)
Annex A: Analysis of revisions
We look here at the effect of the regular revisions made to Land Transaction Tax statistics. We analyse the differences between the first, second and third estimates published for a month. This is for both the number of transactions and the tax due.
For example, we have published three estimates for July 2020. We published the first estimate on 21 August, published the second estimate on 25 September and the third estimate on 29 October.
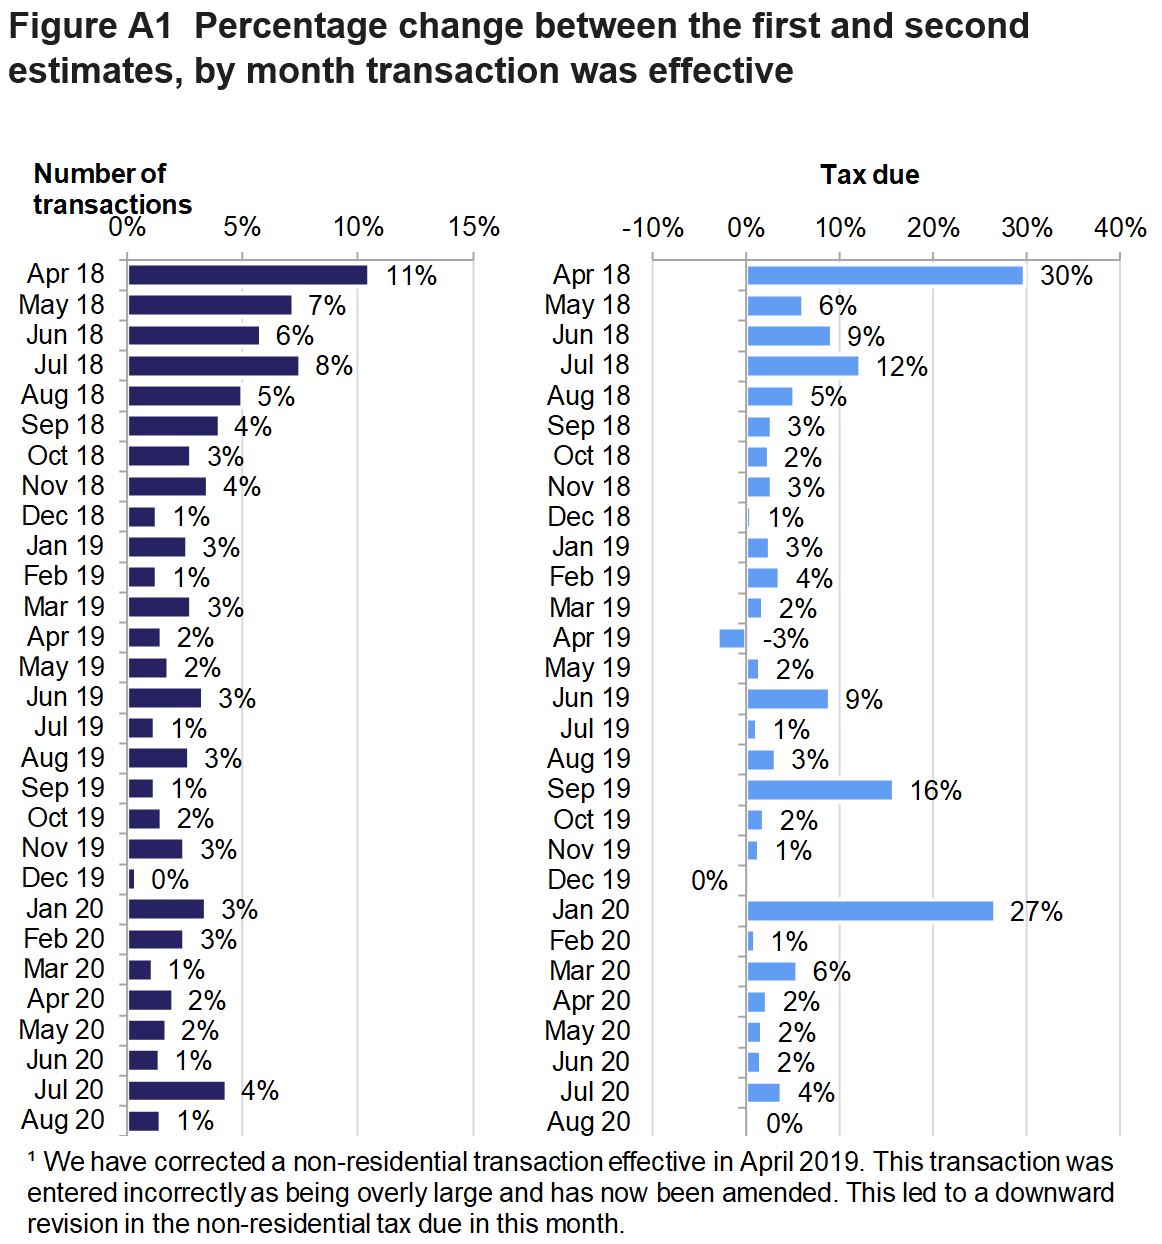
Figure A1 shows that higher levels of revisions can generally be seen in the earlier months that the WRA began collecting LTT. This is particularly the case for the tax due for transactions with an effective date in April 2018, where there was a 30% increase in the estimate of tax due (from the first to the second estimate for the month). A larger revision in April 2018 was expected because the familiarity of the system to users would have been lower, and also because an earlier cut-off date in the following month was used to extract the data.
Nevertheless, the 30% figure for April 2018 in terms of tax due is considerably higher than the equivalent figure for the number of transactions (11%). It is explained by a few larger transactions with an effective date late in April 2018 that were not reported to WRA until later in May 2018 (before the 30 day filing limit, but after the cut-off date for the April publication).
Figure A1 also shows the levels of revisions have generally decreased over time. Since October 2018, the revisions between the first and second monthly estimates have generally been between 0 and 3%. Recent exceptions were:
- June 2019 when the tax due was revised up by 9% between the first and second estimate
- September 2019 (tax due was revised upwards by 16%)
- January 2020 (tax due was revised upwards by 27%)
These exceptions are generally due to a small number of larger value returns arriving towards the end of the 30-day notification period.
The lower level of revisions generally seen now is likely to be due in part to an increasing familiarity with the system amongst solicitors and conveyancers completing the returns. It is consistent with a general decrease in the time taken for returns to be filed with the WRA over the same period (not shown in tables or charts).
There may also be seasonal effects in revisions to the data. For example, we saw higher revisions for the July 2018 estimates than the months around it. However, we do not see any obvious seasonal patterns in data for 2019 or so far in 2020. We will require at least another year’s worth of data to properly assess any data seasonality.
Revisions between second and third published estimates
In a spreadsheet published alongside this statistical release, Tables A1 and A2 show the difference between first, second and third published estimates for a month.
We see relatively small increases between the second and third estimates for a month. In general, this is also the case for the later estimates for a month (not shown in the tables). However, falls may be seen in the second, third and later estimates of tax due for a month. This is because the data are shown net of any refunds for higher rate residential transactions. These refunds may be claimed several years after the effective date of the original transaction. We analyse refunds in section 6 of this statistical release.
In future, we may consider applying a grossing factor to the first estimates for a month. This may help reduce the revisions required to the first estimate for a month. With the volatility shown in the data to date, it is likely we will need several years of LTT data to calculate appropriate grossing factors.
In general, we see larger revisions in the data on non-residential transactions than for residential transactions. This reflects the more volatile nature and often larger size of non-residential transactions.
Links to key quality information and glossary pages
Our key quality information page describes how our Land Transaction Tax statistics meet the Code of Practice for Statistics and the dimensions of value, trustworthiness and quality.
We define relevant terms in the glossary as they are used in this release.
Feedback and contact details
We would be grateful for your feedback on these statistics, to help us improve them. Please contact us using the details below.
Adam Al-Nuaimi
Email: data@wra.gov.wales
Rydym yn croesawu galwadau a gohebiaeth yn Gymraeg / We welcome calls and correspondence in Welsh.
Media
Email: news@wra.gov.wales
Rydym yn croesawu galwadau a gohebiaeth yn Gymraeg / We welcome calls and correspondence in Welsh.
![]()