Healthy Child Wales Programme: 2020
Statistics and further analysis on the percentage of eligible children receiving health visitor contacts through the Healthy Child Wales Programme for 2020.
In this page
This annual report publishes statistics about the Healthy Child Wales Programme (HCWP). It brings together quarterly data, already available on StatsWales, and includes additional analyses.
Quarterly statistics are presented from October to December 2016 (the first quarter when HCWP was introduced) to the quarter October to December 2020.
Other statistics are presented for the full calendar year 2020.
Background
Launched on 1 October 2016, the HCWP is a universal health programme for all families with children aged 0 to 7 years. It includes a consistent range of evidence-based preventative and early intervention measures, with advice and guidance to support parenting and healthy lifestyle choices. The HCWP sets out what planned contacts children and their families can expect from their health boards from maternity service handover to the first years of schooling. These universal contacts cover three areas of intervention: screening; immunisation; and monitoring and supporting child development. This release focusses on the data recorded for each contact with children aged between 10 to 14 days and 3.5 years.
Data is sourced from a module of the National Community Child Health Database and which is anonymised by Digital Health and Care Wales (DHCW) and shared with Welsh Government to produce this statistical release.
More details on the programme are available in the Quality and methodology information section.
Impact of COVID-19
The coronavirus (COVID-19) pandemic has substantially impacted the Healthy Child Wales Programme and the data recorded for monitoring the programme.
At the height of the pandemic, many health visitors were redeployed to work in hospitals to help reduce the initial burden on health boards.
Throughout the pandemic health boards were advised to continue carrying out contacts at 10 to 14 days, 6 weeks and 6 months. Completion of contacts at other points was subject to guidance issued from the Welsh Government at different times during the pandemic.
Many contacts with children and their families took place over the phone, rather than in-person and some health boards were unable to submit data collection forms for phone contacts. It is likely that in practice, more contacts took place than have been recorded on health board systems, therefore caution is advised when interpreting all quarterly data from January to March 2020 onwards and all annual data for the year 2020.
More details on how the programme has been affected by the pandemic are available in the Quality and methodology information section.
Main points
While the COVID-19 pandemic greatly impacted the implementation of the programme and the data collection process, the data which was recorded shows that two thirds (66%) of contacts which should have been offered through the programme, were received by eligible children. This is 9 percentage points lower than in 2019.
In 2020, the percentage of eligible children with a recorded contact varied by contact point, from 93% at 10 to 14 days to 50% at 16 weeks.
Contacts at 10 to 14 days, 6 weeks and 6 months were prioritised at the height of the pandemic, and as a result the percentage of eligible children recorded as receiving these contacts was least affected by the pandemic. By the last quarter of 2020, the percentage of eligible children receiving contacts at these points were at or exceeding pre-pandemic levels.
The percentage of eligible children with a recorded contact at all other contact points were affected more markedly by the pandemic. By the last quarter of 2020, the percentage of eligible children receiving contacts at these points had improved with some contacts approaching pre-pandemic levels and others exceeding pre-pandemic levels.
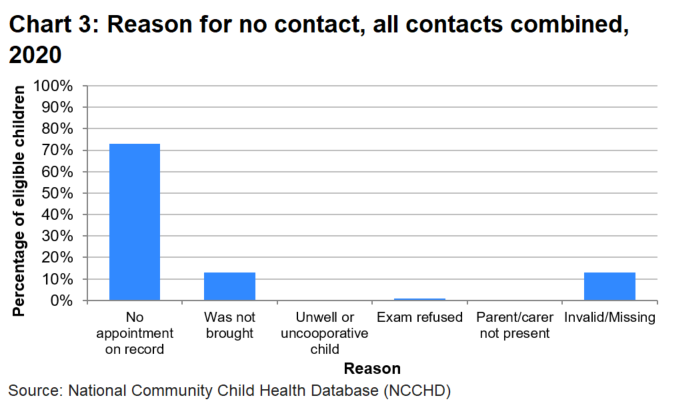
While the majority of contacts were offered, 90,350 contacts to eligible children were not made. Nearly three quarters (73%) of these did not have an appointment on record, while over 11,500 appointments were made and the child was not brought to it.
The majority of all contacts (72%) were made within the programme’s specified age ranges, though there is some variation between contact points.
Since mid-2017, there has been little difference between the percentage of eligible children recorded as receiving contacts in Flying Start areas and non-Flying Start areas. In the last quarter of 2020, the percentage of eligible children recorded as receiving their contact was 73% in Flying Start areas and 74% in non-Flying Start areas.
There are known data quality issues which in particular affect the data at 6 and 8 week contact points. In addition as remote contacts were utilised during the pandemic, some health boards were not able to record these when they were first introduced; however this was resolved by the end of the year.
Annual summary of Healthy Child Wales Programme
| Eligible children | Received contact | % Received contact | |
|---|---|---|---|
| 10 to 14 days | 28,674 | 26,718 | 93% |
| 6 weeks | 28,882 | 22,519 | 78% |
| 8 weeks | 28,925 | 17,281 | 60% |
| 12 weeks | 29,062 | 14,864 | 51% |
| 16 weeks | 29,082 | 14,657 | 50% |
| 6 months | 29,330 | 23,389 | 80% |
| 15 months | 30,128 | 21,115 | 70% |
| 27 months | 31,938 | 20,294 | 64% |
| 3.5 years | 33,007 | 17,838 | 54% |
| Total contacts | 269,028 | 178,675 | 66% |
Source: National Community Child Health Database (NCCHD)
A time series is available in 'Annex 1' (MS Excel).
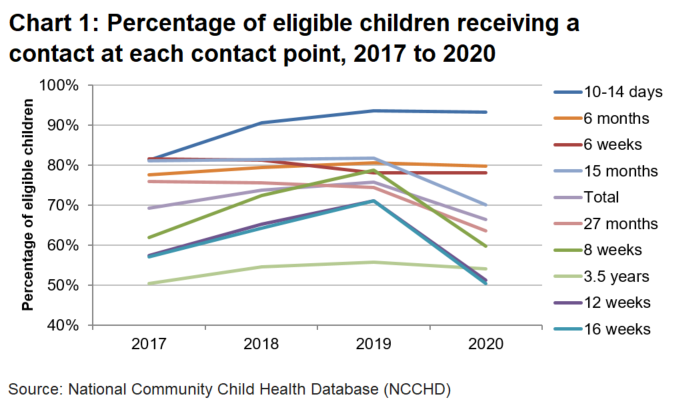
Table 1 and Chart 1 show the number and percentage of eligible children recorded as receiving their contact at each contact point. Of all the contacts which should have been offered to eligible children in 2020, 66% of contacts were recorded as being received by the child. This figure is lower than in previous years, but has been affected by the COVID-19 pandemic and is known to be an undercount of the actual activity which occurred.
The percentage of children with a recorded contact varied by contact point, with the highest percentage of eligible children receiving contacts at 10 to 14 days (93%). The lowest percentage of eligible children receiving contacts was at 16 weeks (50%).
Quarterly time series: percentage of eligible children receiving a contact at each contact point since the start of the programme
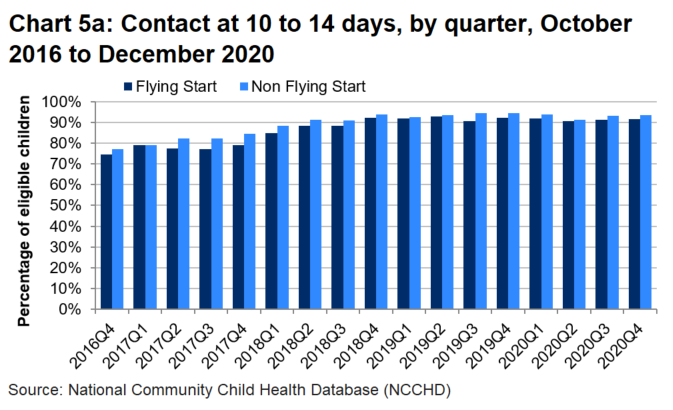
Contact at 10 to 14 days
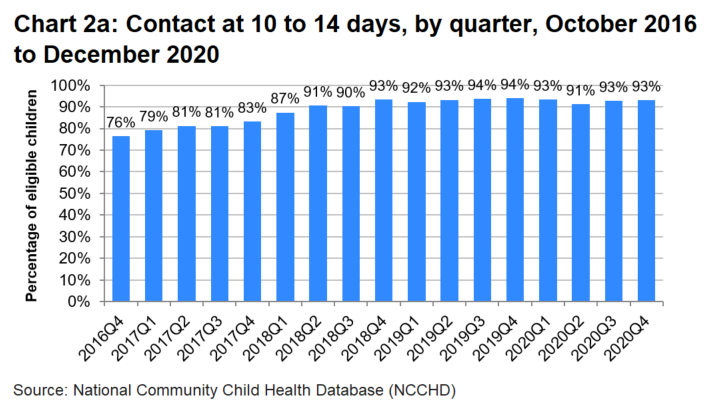
Latest data: 6,554 out of 7,037 eligible children (or 93.1%) received a contact in the latest quarter.
Change since last quarter: up 0.4 percentage points.
Change since first quarter: up 16.7 percentage points.
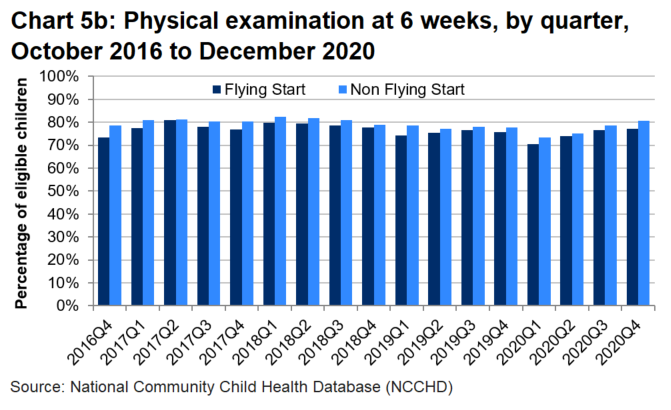
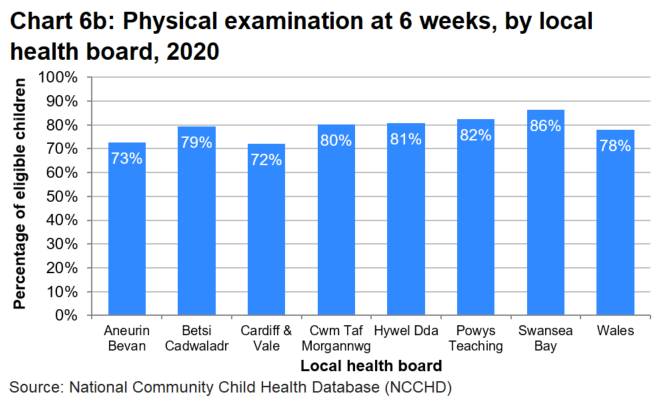
Physical examination at 6 weeks
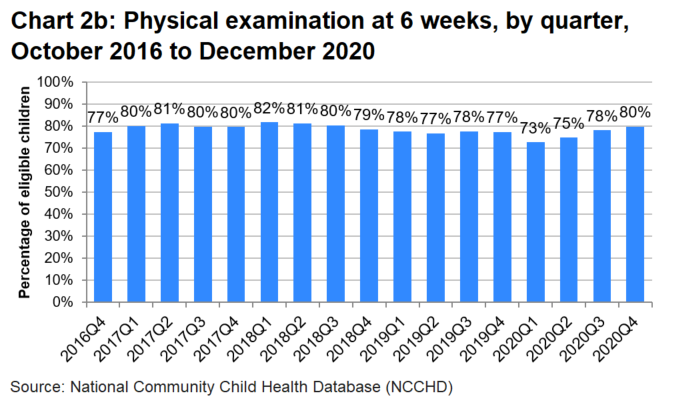
Latest data: 5,882 out of 7,375 eligible children (or 79.8%) received a contact in the latest quarter.
Change since last quarter: up 1.6 percentage points.
Change since first quarter: up 2.4 percentage points.
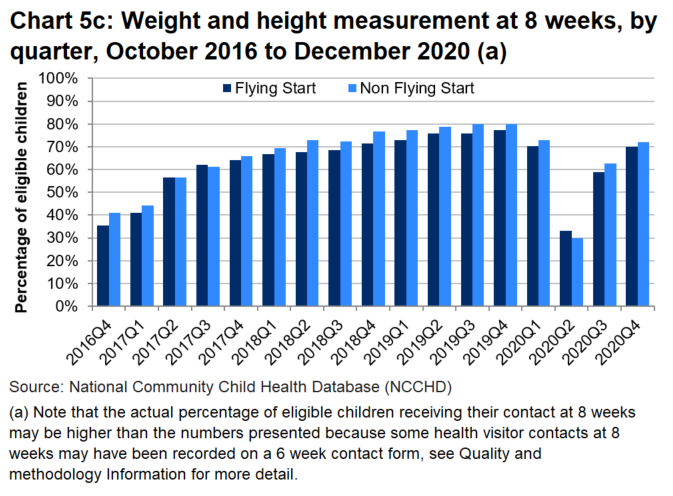
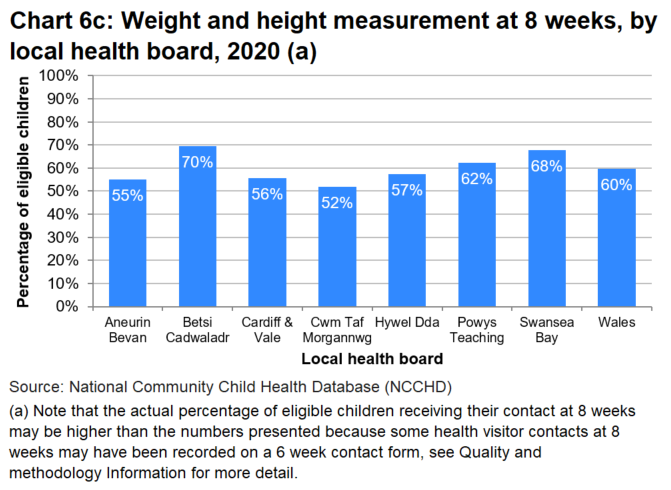
Weight and height measurement at 8 weeks
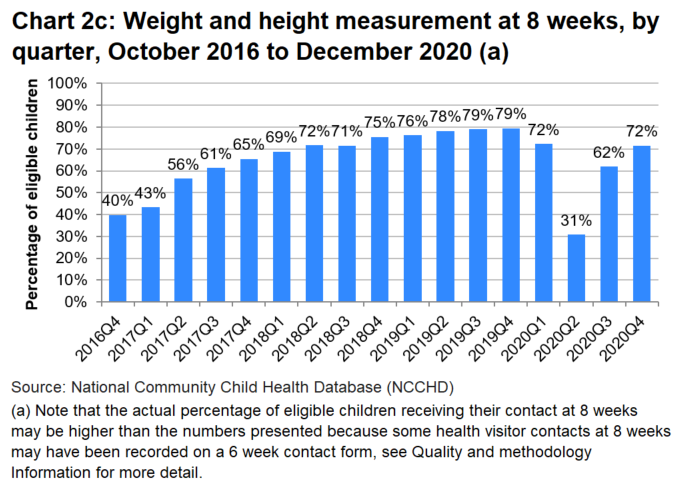
Latest data: 5,327 out of 7,441 eligible children (or 71.6%) received a contact in the latest quarter.
Change since last quarter: up 9.7 percentage points.
Change since first quarter: up 31.9 percentage points.
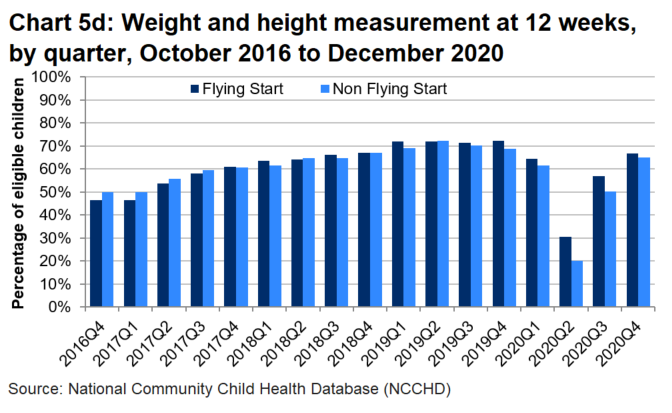
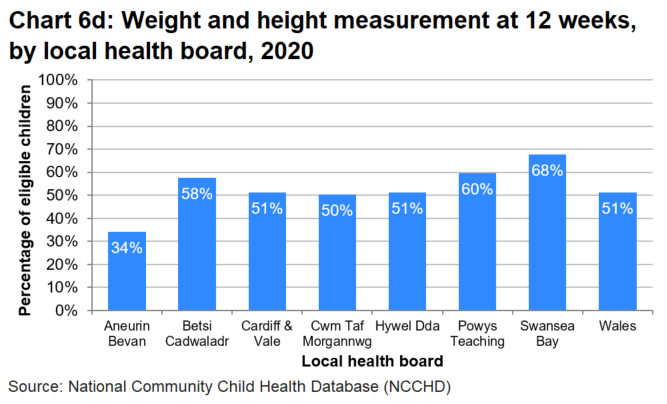
Weight and height measurement at 12 weeks
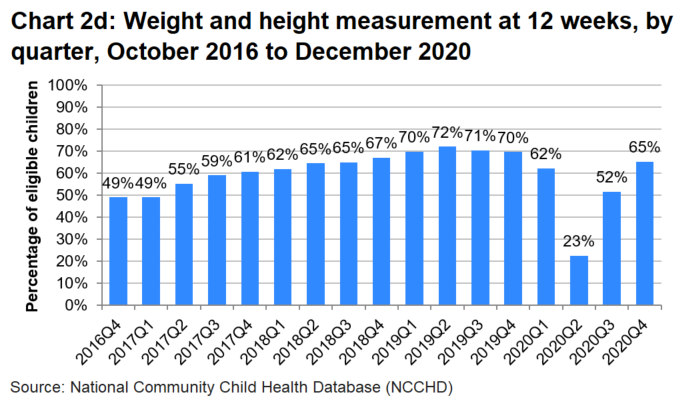
Latest data: 4,912 out of 7,511 eligible children (or 65.4%) received a contact in the latest quarter.
Change since last quarter: up 13.7 percentage points.
Change since first quarter: up 16.3 percentage points.
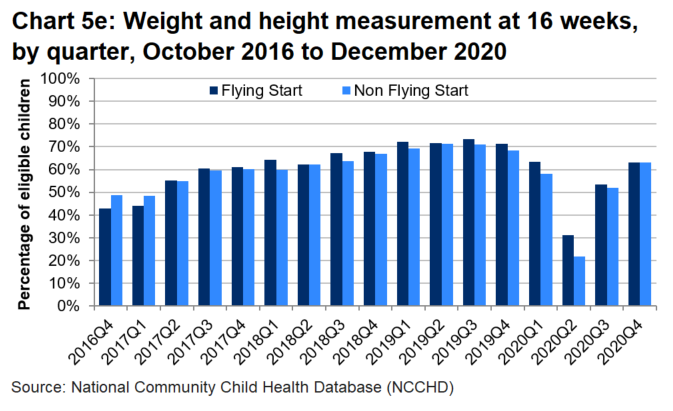
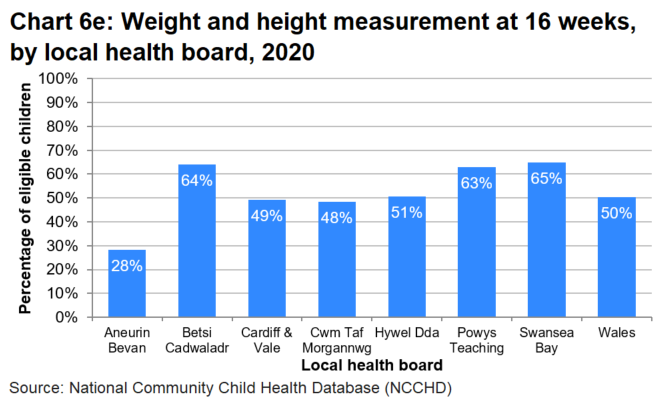
Weight and height measurement at 16 weeks
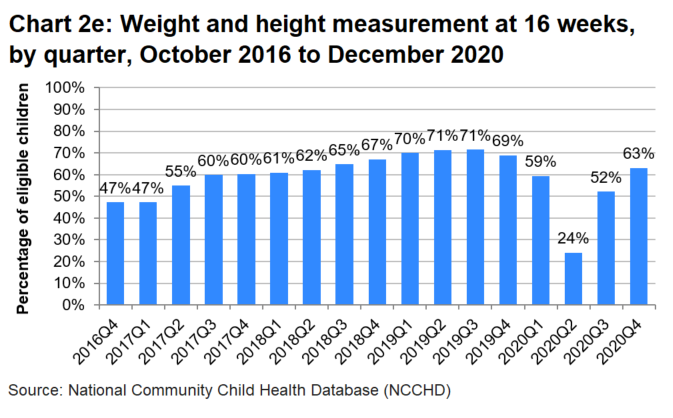
Latest data: 4,616 out of 7,319 eligible children (or 63.1%) received a contact in the latest quarter.
Change since last quarter: up 10.9 percentage points.
Change since first quarter: up 15.9 percentage points.
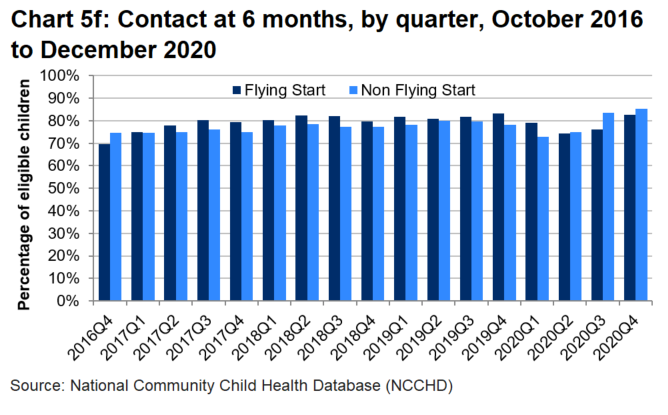
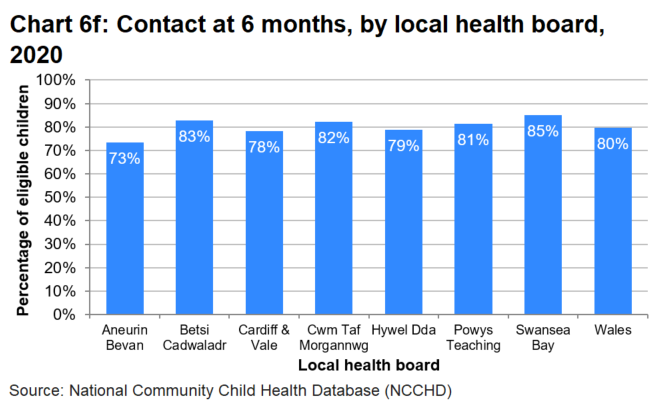
Contact at 6 months
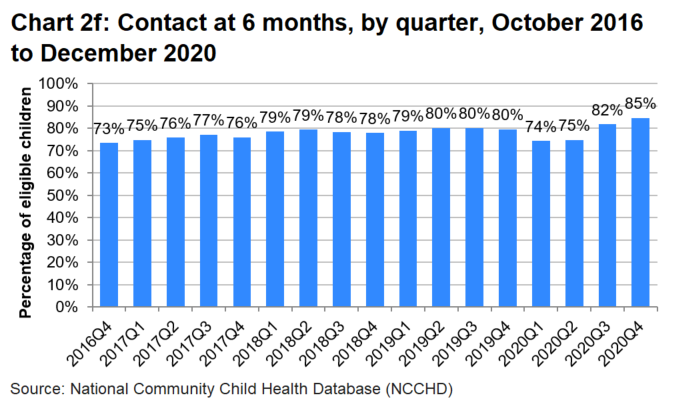
Latest data: 6,135 out of 7,255 eligible children (or 84.6%) received a contact in the latest quarter.
Change since last quarter: up 2.8 percentage points.
Change since first quarter: up 11.1 percentage points.
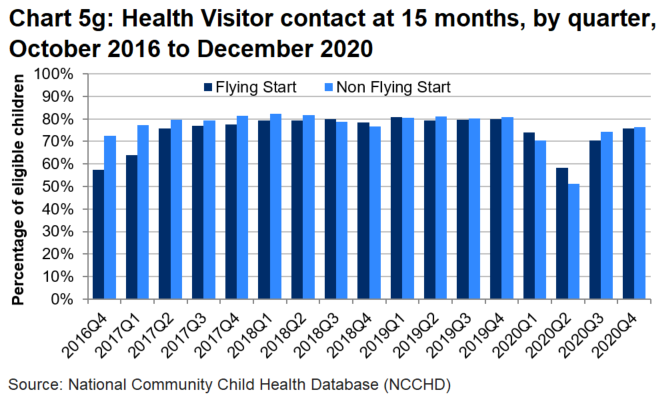
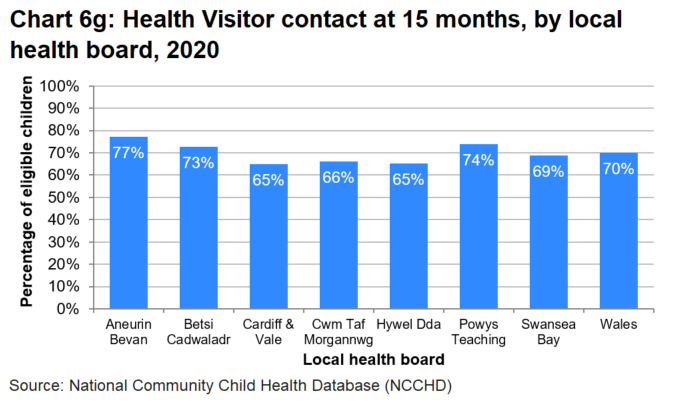
Health Visitor contact at 15 months
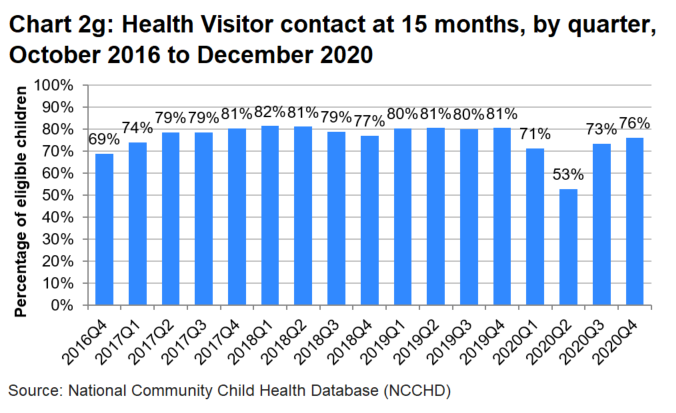
Latest data: 5,890 out of 7,732 eligible children (or 76.2%) received a contact in the latest quarter.
Change since last quarter: up 2.7 percentage points.
Change since first quarter: up 7.2 percentage points.
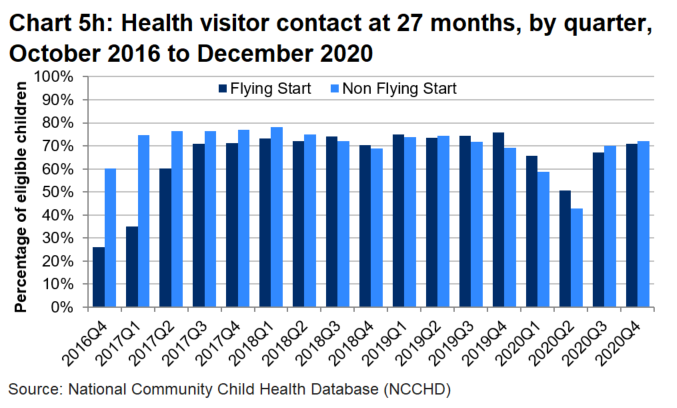
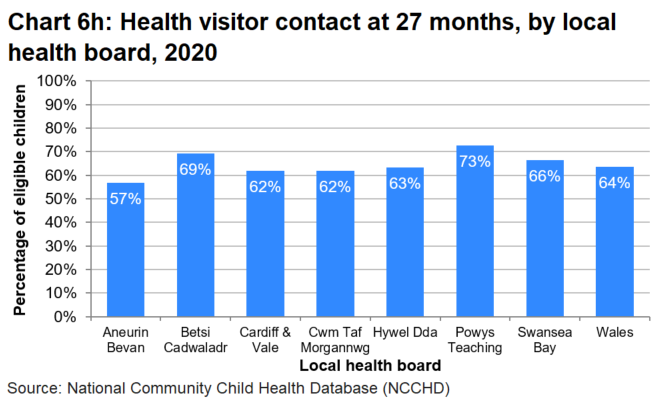
Health visitor contact at 27 months
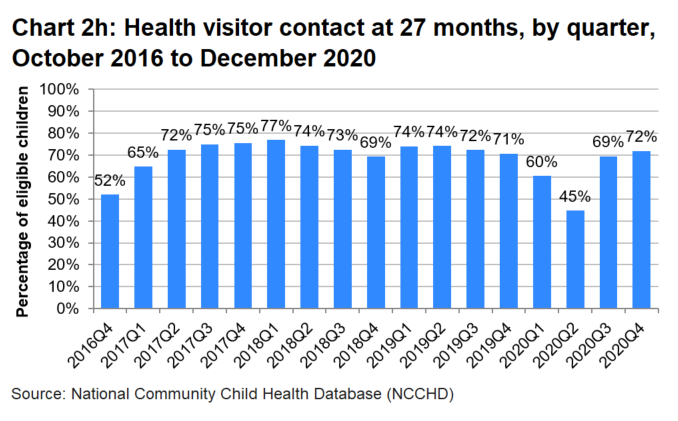
Latest data: 5,905 out of 8,223 eligible children (or 71.8%) received a contact in the latest quarter.
Change since last quarter: up 2.4 percentage points.
Change since first quarter: up 19.8 percentage points.
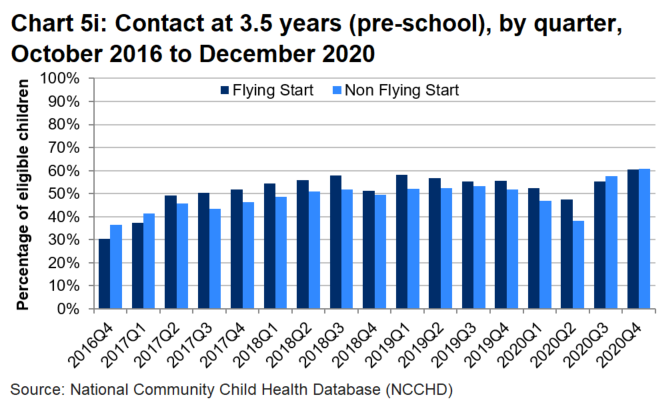
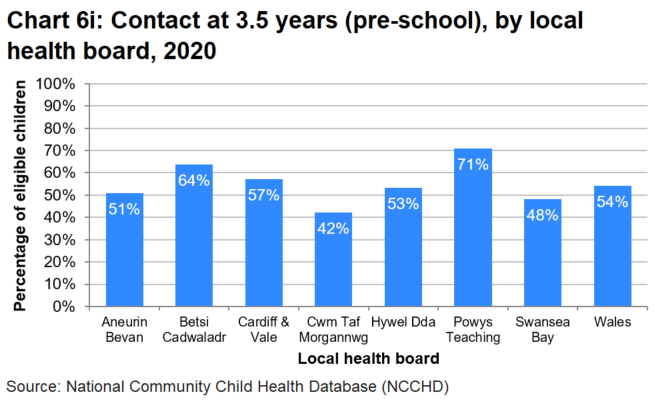
Contact at 3.5 years (pre-school)
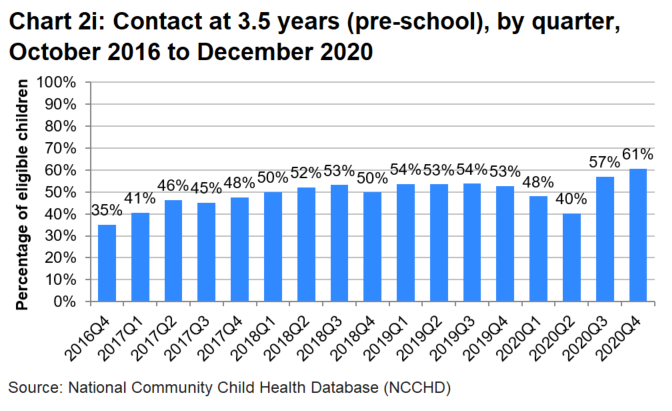
Latest data: 4,996 out of 8,237 eligible children (or 60.7%) received a contact in the latest quarter.
Change since last quarter: up 3.7 percentage points.
Change since first quarter: up 25.5 percentage points.
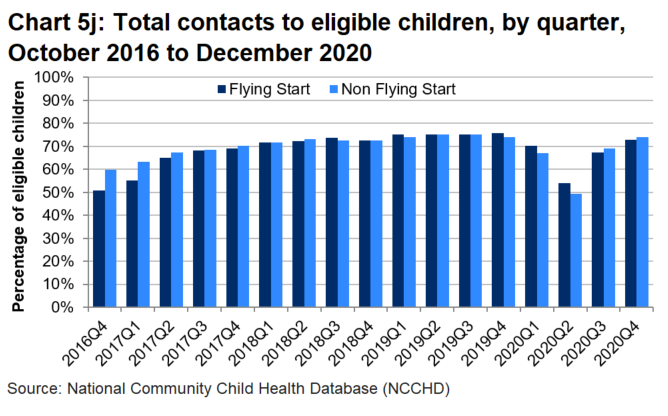
Total contacts to eligible children
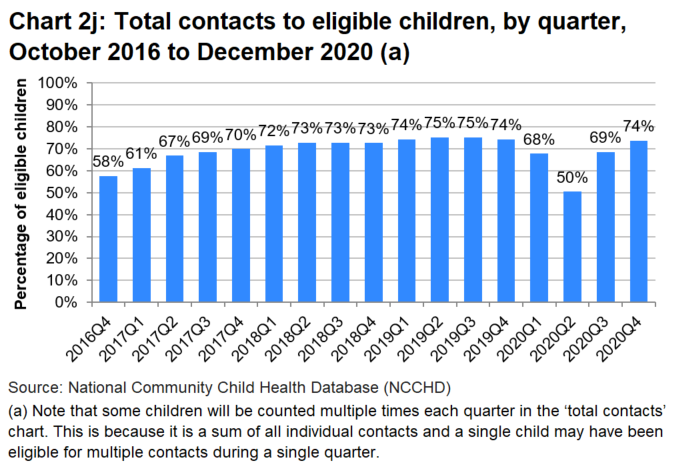
Latest data: 50,217 out of 68,130 eligible children (or 73.7%) received a contact in the latest quarter.
Change since last quarter: up 5.1 percentage points.
Change since first quarter: up 16.1 percentage points.
Summary
With the various challenges the COVID-19 pandemic caused in 2020, and the known issues with recording data, two thirds (66%) of all contacts which should have been offered through the programme were recorded as being received by eligible children. This is nine percentage points lower than in 2019.
The quarterly time series shows an upward trend in the percentage of eligible children receiving contacts across the majority of contact points, from the start of the programme until the January to March 2020 quarter when the COVID-19 pandemic first impacted. The impact of the pandemic is different for each contact point and this is largely due to the guidance issued by Welsh Government asking health boards to prioritise contacts at 10 to 14 days, 6 weeks and 6 months.
Data for the final quarter of 2020 for all contacts combined shows that 74% of eligible children received their contacts, which is the same percentage as in the final quarter of 2019. This suggests that the programme is running at pre-pandemic capacity again on the whole, although many of the contacts are now taking place remotely rather than face-to-face and the percentage differs between each contact point.
The first contact in the programme (10 to 14 days) has been the contact with the highest rate of eligible children receiving their contact throughout the duration of the programme, and the rate remained largely unaffected by the pandemic, with only a slight fall in the quarter April to June 2020. For the whole year 2020, 93% of eligible children were recorded as receiving their contact, the same percentage as in 2019.
The other two contacts (6 weeks and 6 months) which were prioritised during the early stages of the pandemic, also saw slight falls in the middle of the year, but the percentage of eligible children increased at the end of the year. By October to December 2020, 80% of eligible children were recorded as having their contact at 6 weeks, the highest rate since the quarter July to September 2018. Also by the final quarter of 2020, 85% of eligible children were recorded as having their contact at 6 months, the highest on record for that contact point.
All other contact points were affected more prominently by the COVID-19 pandemic, with the percentage of children recorded as having a contact falling in-line with Welsh Government prioritisation guidance. The largest falls in the percentage of eligible children recorded as having a contact were greatest in the health visitor contacts at 8, 12 and 16 weeks in April to June 2020. Rates have since improved for all contact points, but not all are at their pre-pandemic levels.
When the rate for last quarter of 2020 is compared to the last quarter of 2019:
- 8 percentage points fewer occurred at 8 weeks
- 4 percentage points fewer occurred at 12 weeks
- 6 percentage points fewer occurred at 16 weeks
- 4 percentage points fewer occurred at 15 months
- 1 percentage point more occurred at 27 months
- 8 percentage points more occurred at 3.5 years
All contacts offered through the Healthy Child Wales Programme are voluntary, so personal choice affects the percentage of eligible children receiving a contact.
Reasons for not receiving a contact
All eligible children across Wales should be sent an invite for all contacts either directly through the post (for contacts that align with immunisations, providing consent is provided) or via their health visitor for contacts led by the health visitor. Where a contact is not recorded, a reason is provided.
Summary
During 2020 there were just over 90,350 contacts which were not recorded as being made. This will either be because:
- contacts were not offered by health boards because they did not have the capacity to offer it
- contacts were offered and not taken up by parents of eligible children
- contacts did occur, but the data collection form was not completed or added to the child health system
87% of these children had information recorded on the system indicating why a contact was not recorded. The majority (73%) of contacts were not made because there was no record of an appointment being made. Where an appointment was made, the main reason why the contact did not happen was because the child was not brought to the appointment (13%).
Contacts within programme age range, 2020
While the Healthy Child Wales Programme is designed for children to receive a contact at specific ages, in practice each contact point has a minimum and maximum age threshold within which the contact should take place. These thresholds were determined by Heads of Health Visitors at local health boards and are shown in Table 2.
| Contact | Age threshold: minimum age | Age threshold: maximum age |
|---|---|---|
| Contact at 10 to 14 days | 10 days | 14 days |
| Physical examination at 6 to 8 weeks | 6 weeks | 12 weeks |
| Contact at 8 weeks | 8 weeks | 12 weeks |
| Contact at 12 weeks | 12 weeks | 16 weeks |
| Contact at 16 weeks | 16 weeks | 20 weeks |
| Contact at 6 months | 26 weeks | 35 weeks |
| Health Visitor contact at 15 months | 65 weeks | 78 weeks |
| Health visitor contact at 27 months | 117 weeks | 130 weeks |
| Contact at 3.5 years (pre-school) | 185 weeks | 208 weeks |
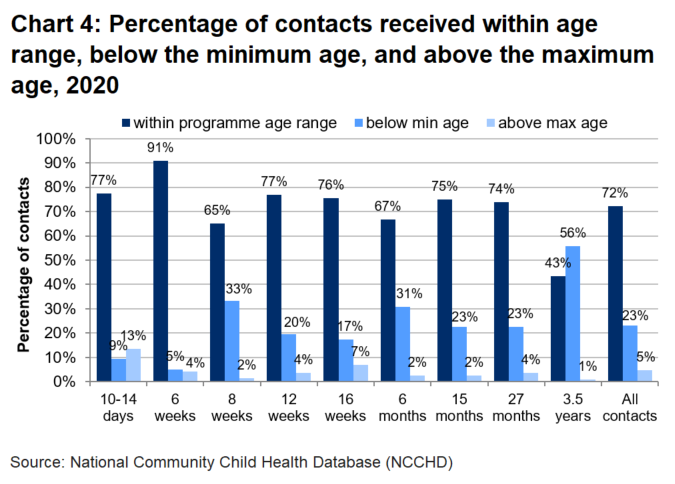
Summary
The majority of all contacts (72%) are made within the specified age range, though there is some variation between contact points. If a child has their appointment outside of the age threshold, it’s more likely to be before the minimum age, apart from at the first contact point. The largest percentage of children not seen within the age range is at 3.5 years, where 56% have their contact before the lower age threshold.
Flying Start
Flying Start is the Welsh Government’s targeted early years programme for families with children aged less than four years of age. It offers families access to enhanced health visiting services, free part-time childcare for two to three year olds, parenting support, and support for the development of speech, language and communication. The programme has been targeted at defined geographical areas within each local authority according to measures of relative disadvantage including the Welsh Index of Multiple Deprivation (WIMD), free school meals and the proportions of children aged under 4 years living in households in receipt of income related benefits.
The caseload of children who live in the designated Flying Start areas has been transferred from generic health visiting services to Flying Start.
Statistics describing activity within Flying Start programme areas as well as outcomes for children living in Flying Start and other areas are published annually: Flying Start: summary statistics.
Summary
Charts 5a to Chart 5j show the differences between the percentage of eligible children receiving Healthy Child Wales Programme contacts who live in Flying Start areas and non-Flying Start areas.
There were some differences between Flying Start and non-Flying Start areas in the percentage of eligible children receiving contacts when the Healthy Child Wales Programme was first introduced. This was expected as both programmes became aligned to each other. Since mid-2017, there has been little difference between the percentage of eligible children receiving contacts in Flying Start areas and non-Flying Start areas.
In the latest quarter, the percentage of eligible children receiving their contact was 73% in Flying Start areas and 74% in non-Flying Start areas.
Note that Flying Start families receive an enhanced health visiting service with additional visits at 24+ week gestation, from the baby’s birth to six weeks old and between the ages of 9 to 12 months and 18 to 24 months.
Quarterly time series: percentage of eligible children receiving Healthy Child Wales Programme contacts at each contact point, Flying Start and non-Flying Start
Annex 1: Summary of Healthy Child Wales Programme, 2017 to 2020
Data is available in 'Annex 1' (MS Excel).
Annex 2: Local health board profiles
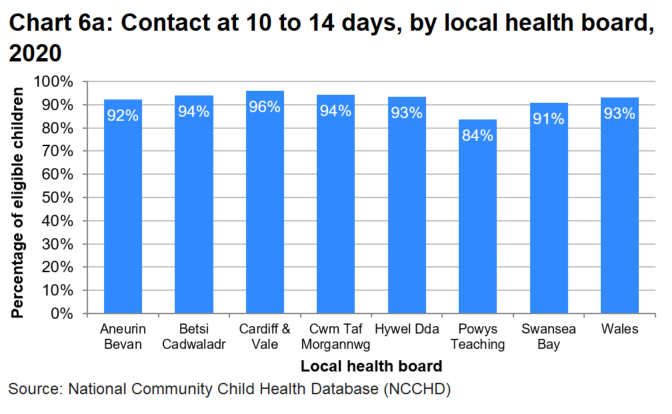
Data for 2020 is shown in the charts below. A full time series of local health board quarterly data is available on StatsWales.
Percentage of eligible children receiving contact at each contact point, by health board, 2020
Note
There are various reasons why the percentage of eligible children receiving contact at each contact point differs between health board areas.
Each health board has their own resource challenges and during the COVID-19 pandemic, while all health boards have endeavoured to complete as many contacts as possible, some health boards have been able to record more contacts than others. For example both Cardiff and Vale and Hywel Dda health boards advised that they were unable to record telephone contacts at the height of the pandemic, but other health boards were able to.
All health boards continue to work internally and with Welsh Government to improve compliance with the programme and improved data management.
Annex 3: Percentage of eligible children receiving contacts, by local authority of residence, 2020
Data is available in 'Annex 3' (MS Excel).
Quality and methodology information
The Healthy Child Wales Programme
Further information on the Healthy Child Wales Programme (HCWP) can be found on the Welsh Government website and the NHS Wales Data Dictionary.
Changes to the programme due to the COVID-19 pandemic
Data from April 2020 onwards will be affected by the COVID-19 pandemic.
Health boards were under extreme pressure to provide services, in particular during the early months of the pandemic, with many health visiting staff being redeployed to different roles. Throughout the pandemic health boards were advised to continue carrying out contacts at 10 to 14 days, 6 weeks and 6 months.
Completion of contacts at other points was subject to guidance issued from the Welsh Government at different times during the pandemic. The first guidance issued on 23 March 2020, when health boards were under most strain, advised health boards to prioritise providing contacts at 10 to 14 days, 6 to 8 weeks and 6 months.
Further guidance was issued on 13 May 2020 advising health boards to reinstate additional contacts and for health boards to work towards providing a full range of contacts.
On 25 August 2020 health boards were advised that they should now return to providing the full range of contacts.
As the rate of COVID-19 infections increased during the winter, further guidance was issued on 22 December 2020 advising health boards to risk assess cessation or the reduction of health visiting services, and as a minimum, health boards should still provide contacts at 10 to 14 days, 6 to 8 weeks and 6 months.
Throughout the COVID-19 pandemic face-to-face contacts were reduced and many contacts would have taken place over the phone, video call or instant messenger. However, not all of these were recorded on data collection forms, so the statistics presented in this release will show an undercount of the actual activity which took place. By the end of the year, all health boards had the means to record remote contacts on data collection forms.
The COVID-19 pandemic also had other impacts on the take-up of contacts from health visitors, with health boards reporting that parental anxiety, shielding and self-isolation had caused families not to take-up offered contacts. Health board also reported that many contacts did not occur because parents did not answer the phone when they were called.
For all of these reasons, caution is advised when using Healthy Child Wales Programme data for 2020.
Monitoring the programme and source
The programme is supported by an updated child health system, delivered by the Digital Health and Care Wales (DHCW), ensuring that health boards are able to schedule contacts effectively under Healthy Child Wales Programme (HCWP) and that there is accurate and comparable data collected to support improvements to child health across Wales.
HCWP data is sourced from the National Community Child Health Database (NCCHD) consists of anonymised records for all children born, resident or treated in Wales and born after 1987. It brings together data from the child health system databases which are held by local health boards. Welsh Government and DHCW have worked together with health professionals to establish a dataset for those HCWP contacts with children between the ages of 10 days and 3.5 years. The data is collected by health visitors and other health professionals and recorded on the child health system by health board community child health staff. The NCCHD is refreshed from local child health system databases every quarter (end January, April, July and October).
Note that only data extracted from the NCCHD is analysed here and that HCWP contacts before 10 days of age and after 3.5 years are not reported in this release. Other key components of the programme are reported elsewhere.
- Immunisation statistics (COVER statistics) are published by Public Health Wales.
- Infant feeding statistics are published in our annual Maternity and birth statistics statistical release.
Measuring coverage of the programme
In order to measure how the programme is being implemented for children living in Wales using the NCCHD, the following methodology has been used.
- Identified appropriate eligible children during the period for each contact. For example, in relation to the 10 to 14 day contact, we have looked at all children in Wales becoming 10 days old during the quarter.
- For these eligible children we have counted the valid records for each HCWP contact.
- Delayed reporting by one quarter to allow time for data to be recorded on child health system databases.
Note that annual data is extracted at the same time as the last quarter in the year and data for the three previous quarters in the year are not revised. If there are late submissions of data for contacts which happened in the first three quarters of the year, then these will be counted in the annual data but not in the quarterly data from when they happened. As a result annual data may not be the sum of the constituent quarters.
Implementing the programme
Statistics in this release only relate to the following HCWP contacts:
- health visitor home contact at 10 to 14 days
- GP contact at 6 weeks
- health visitor service contact (growth assessment) at 8, 12 and 16 weeks
- health visitor service contact at 6 months
- health visitor service contact at 15 months
- health visitor service contact at 27 months
- health visitor service contact at 3.5 years pre-school
After the first home contact at 10 to 14 days, health visitor service contacts can occur either in the home or in clinics, although growth assessments contacts can also take place at GP practices. The physical examination takes place mostly in GP practices or in clinics.
Coverage
Statistics in the release relate to contacts by health professionals with children resident in Wales from birth to three and a half years old.
There are known data quality issues with the data collected through the Healthy Child Wales Programme. One of the issues is that the paper-based system can lead to an undercount in activity because it relies on the health professional completing the paper form correctly, submitting it to a child health administrator, who then needs to upload the data onto the child health system. This process can lead to incorrect data being input on to the form, forms being submitted late or not at all and manual imputation errors. While the large majority of contacts are recorded correctly, this process means data is not collected for all children in practice.
There are specific issues which affect the 6 and 8 week contacts. The 6 week contact is where physical examination of the eyes, heart, testes, hips and general health occurs and should be undertaken by a GP or paediatrician. Data recorded in NCCHD shows that around 80% of these contacts have occurred since the programme was introduced; however feedback from health boards suggests that all children are offered this contact and nearly all children receive the contact. Following an investigation into the data, it was apparent that some GPs recorded the contacts on their GP systems, but did not record the information on the Healthy Child Wales Programme data collection form, so it will not be present on the NCCHD.
Further to this, the 8 week contact with the health visitor often takes place simultaneously to the 6 week GP contact, but in order to be entered onto the NCCHD, separate data collection forms need to be submitted for each contact. This can result in a number of 6 week contact forms being submitted by the health visitor instead of the 8 week contact form. Therefore the number of 8 week contacts on the NCCHD is lower than the number of contacts occurring in practice.
Other health visitor contacts which align with childhood vaccination appointments also suggest there is an undercount of activity recorded in NCCHD as immunisation rates are greater than the rate of eligible children receiving Healthy Child Wales Programme contacts.
Welsh Government officials are continually working with health boards and primary care colleagues to improve the quality of data recorded at all contacts and it is hoped that an electronic data collection system may be introduced in the future to help with this.
Bridgend local authority moving health board
Health service provision for residents of Bridgend local authority moved from Abertawe Bro Morgannwg to Cwm Taf on April 1st 2019. This joint statement provides further detail.
As a result, the quarterly data for Jan-Mar 2019 was the last quarter in the time series for both Cwm Taf and Abertawe Bro Morgannwg. The subsequent quarterly data for April to June 2019 includes data for the two new health boards, Cwm Taf Morgannwg and Swansea Bay.
Time series for all five other health boards and at the Wales level are unaffected.
Related statistics
Maternity and birth statistics provides statistics on maternity services in Wales including antenatal care, care at delivery and outcomes for babies. It also includes statistics on where and when babies were born, their birth weight, whether they were preterm and about their mothers - their age and whether the babies were breastfed.
Flying Start provides key statistics from the Flying Start programme for each of the 22 local authorities in Wales.
A summary of Childhood immunisation statistics produced by Public Health Wales are published on StatsWales.
Revisions
The National Community Child Health Database is a live database and data is extracted from this database every quarter. There is usually a 4 month lag between the extract being taken and the reference period (for example, data extracted in April will be for the reference period October to December in the previous year). This is to allow child health departments to process all data collection forms for the reference period. Data is only extracted for the latest quarter, so data for all previous quarters are not routinely revised. If data for previously published periods were to be extracted at any point after their usual extraction date, numbers may differ slightly to the published data because there may have been some data collection forms processed very late.
Data for previous time periods is not revised unless errors are discovered. In the case of incorrect data being published, revisions would be made and users informed.
What are the potential uses of these statistics?
These statistics will be used in a variety of ways. Some examples of these are:
- advice to ministers
- to inform debate in the Welsh Parliament and beyond
- to make publicly available data on child health statistics in Wales
- monitoring service delivery
- public health research
- policy development
Users of this data
The main users of this data are likely to be:
- ministers and the Members Research Service in the Welsh Parliament
- local health boards and local authorities
- primary care organisations
- the research community
- students, academics and universities
- the general public
- private hospitals
- NHS organisations
- voluntary birth organisations
Relevance
The statistics provide an opportunity to monitor the implementation of the HCWP and provide an insight into the profile of the early years in Wales.
Users of the statistics are encouraged to contact Welsh Government to let us know how they use the data.
Main users have been contacted prior to release of this data and will continue to be liaised with as the statistical release develops.
The release will be adapted to respond to policy changes ensuring our statistics remain relevant.
Accuracy
There are known data quality issues with data collected through the programme, most of which are explained in the coverage section.
The data collection form records information on additional data items such as female genital mutilation (FGM), the age at which breastfeeding ceased, the age at which solid foods were introduced, and schedule of growing skills (SOGS). However none of these data items are currently recorded with sufficient accuracy and consistency to publish data.
Welsh Government and DHCW are continuously working with health boards to improve completeness and quality. Part of this work includes changing the data collection form to make it easier for health visitors to complete and potentially moving to an online data collection system, rather than using the current paper-based process which has many limitations.
Completeness
Notwithstanding the known data quality issues and impacts of the COVID-19 pandemic, data completeness is variable across some of the published data items, but is sufficiently high to produce official statistics with explanatory notes.
The current paper-based data collection process relies on the accurate completion of data collection forms by health care professionals, and timely processing and accurate imputation by child health system administrators.
Timeliness and punctuality
The NCCHD is refreshed from data derived from local child health systems every quarter. The next statistical release is planned for summer 2022, following the April NCCHD refresh and will cover the whole calendar year for 2021.
There is often a lag in data collection forms being sent to child health system administrators so data is usually extracted from the system around 4 months after the reference period and is published by Welsh Government, as soon as resource allows but usually within 2 months of receiving the data.
To supplement the annual statistical release, quarterly data are published on StatsWales.
Accessibility and clarity
The statistics are published in an accessible, orderly, pre-announced manner on the Welsh Government website at 9:30am on the day of publication. An RSS feed alerts registered users to this publication. Simultaneously the releases are also published on the National Statistics Publication Hub. We also publicise our outputs on Twitter. All releases are available to download for free.
Open data tables are available via StatsWales every quarter.
We aim to use plain English in our outputs and all outputs adhere to the Welsh Government’s accessibility policy. Furthermore, all our headlines are published in Welsh and English.
Further information regarding the statistics can be obtained by contacting the relevant staff detailed on the release or via stats.healthinfo@gov.wales.
Comparability and coherence
Where there are changes to the source data provided, this will be shown in the statistical outputs. Where advance warning is known of future changes these will be pre-announced in accordance with Welsh Government arrangements.
Data collected from NCCHD adheres to national standards and are coherent within and across health organisations in Wales.
England has a Healthy Child Programme which is similar scheme to Healthy Child Wales.
Scotland has a Child Health Programme which differs somewhat from the Healthy Child Wales Programme.
Northern Ireland statistics on public health are available from the Northern Ireland Public Health Agency and demography statistics from the Northern Ireland Statistics & Research Agency (NISRA).
Well-being of Future Generations Act (WFG)
The Well-being of Future Generations Act 2015 is about improving the social, economic, environmental and cultural wellbeing of Wales. The Act puts in place seven wellbeing goals for Wales. These are for a more equal, prosperous, resilient, healthier and globally responsible Wales, with cohesive communities and a vibrant culture and thriving Welsh language. Under section (10)(1) of the Act, the Welsh Ministers must (a) publish indicators (“national indicators”) that must be applied for the purpose of measuring progress towards the achievement of the Well-being goals, and (b) lay a copy of the national indicators before Senedd Cymru. The 46 national indicators were laid in March 2016 and this releases includes 1 of the national indicators namely The percentage of live single births with a birthweight of under 2.5kg.
Information on the indicators, along with narratives for each of the wellbeing goals and associated technical information is available in the Wellbeing of Wales report.
Further information on the Well-being of Future Generations (Wales) Act 2015.
The statistics included in this release could also provide supporting narrative to the national indicators and be used by public services boards in relation to their local wellbeing assessments and local wellbeing plans.
Contact details
Statistician: Craig Thomas
Telephone: 0300 025 1646
Email: stats.healthinfo@gov.wales
Media: 0300 025 8099
SFR 251/2020