COVID-19 Wales situational report: 8 July 2021
Update from the COVID-19 Intelligence Cell and Health Protection Advisory Group.
This file may not be fully accessible.
In this page
COVID-19 situation report summary
Key points to note
Wales is at Alert Level 1.
Overall transmission of COVID-19 is rapidly increasing in all areas across Wales. The SAGE consensus estimate of the reproduction number for Wales is between 1.2 and 1.5, while PHW's estimate is between 1.5 and 1.6. Source: SAGE / PHW (7/7/21). Note that SAGE's estimate is typically lagged by 2 to 3 weeks while PHW, which uses a different methodology, is lagged by around 1 week. The case incidence and percentage of people testing positive for COVID-19 has also increased. Slide 3, Source: PHW.
COVID-19 pressure on the NHS remains stable at the lowest levels since reporting began, although if cases continue to rapidly rise hospital admissions are likely to follow. Slide 4, Source: NHS Wales Operational data.
As at 6 July 2021, Wales has 3,666 confirmed cases of the more transmissible Delta variant (an increase of 1,917 from the previous week) making Delta the dominant variant of COVID-19 in Wales. Of the 3,666 cases detected to date, 48.7% of cases were in unvaccinated individuals, 33.6% received 1 dose and 17.6% had received 2 doses. Note that this data may include vaccinations that have not yet been given the 14 to 21 days necessary to provide maximum protection against COVID-19. Of the 3,666 cases 38, or 1.0%, were hospitalised. Source: PHW.
On vaccination, as at 6 July 2021, a total of 4.03 million (+0.11 million) doses of COVID-19 vaccine have been given in Wales, of which 2.27 (+0.02) million were first doses and 1.76 million (+0.19) were second doses. Based on SAGE's estimate of an immunity coverage requirement of at least 80% for the delta variant, current coverage will not offer population level protection in the absence of other protective behaviours. Source: PHW, SPI-M-O.
| Current value (03/07/21) | Change since previous week (26/06/21 to 03/07/21 unless stated otherwise) | ||||
| Percentage change | Value change | ||||
| Confirmed case rate (rolling 7 day sum per 100k) | 116 | +74% | ↑ | (+49) | |
| Confirmed case rate for over 60s (rolling 7 day sum per 100k) | 24 | +68% | ↑ | (+10) | |
| Test positivity (7 day RA) | 6.30% | +46% | ↑ | (+2.0 percentage points) | |
| Population estimated to have COVID-19 (prevalence)1 | 0.30% | +36% | ↑ | (+0.08 percentage points) | |
| NHS COVID-19 Admissions2 | 6 | +52% | - | (+2) | |
| ONS deaths (7 day sum)3 | 1 | - | - | (+1) | |
| PHW deaths (7 day sum) | 3 | +50% | - | (+1) | |
- Latest COVID Infection Survey data is taken from the 27 June 2021 to 3 July 2021.
- Seven day rolling average to the current date of confirmed COVID-19 patients, does not include COVID-19 suspected or recovering.
- Latest ONS deaths data is to 25 June 2021 (rather than 3 July 2021) for the current value. Data to 18 June 2021 is used for the change since previous week.
What is the current status of the epidemic?
| Local Authority | Number | % of All Wales Total | Case Incidence per 100,000 | Incidence threshold reached | Change from previous week |
|---|---|---|---|---|---|
| Wrexham | 346 | 10.00% | 254.5 | 50 or higher | 92% ↑ |
| Flintshire | 337 | 9.80% | 215.9 | 50 or higher | 39% ↑ |
| Denbighshire | 157 | 4.50% | 164.1 | 50 or higher | 37% ↑ |
| Conwy | 175 | 5.10% | 149.3 | 50 or higher | 48% ↑ |
| Cardiff | 511 | 14.80% | 139.3 | 50 or higher | 49% ↑ |
| Isle of Anglesey | 91 | 2.60% | 129.9 | 50 or higher | 78% ↑ |
| Gwynedd | 148 | 4.30% | 118.8 | 50 or higher | 30% ↑ |
| Caerphilly | 206 | 6.00% | 113.8 | 50 or higher | 249% ↑ |
| Monmouthshire | 99 | 2.90% | 104.7 | 50 or higher | 175% ↑ |
| Torfaen | 96 | 2.80% | 102.2 | 50 or higher | 123% ↑ |
| Rhondda Cynon Taf | 243 | 7.00% | 100.7 | 50 or higher | 111% ↑ |
| Vale of Glamorgan | 133 | 3.80% | 99.6 | 50 or higher | 73% ↑ |
| Blaenau Gwent | 56 | 1.60% | 80.2 | 50 or higher | 167% ↑ |
| Powys | 104 | 3.00% | 78.5 | 50 or higher | 167% ↑ |
| Bridgend | 115 | 3.30% | 78.2 | 50 or higher | 156% ↑ |
| Carmarthenshire | 144 | 4.20% | 76.3 | 50 or higher | 140% ↑ |
| Newport | 107 | 3.10% | 69.2 | 50 or higher | 215% ↑ |
| Swansea | 163 | 4.70% | 66 | 50 or higher | -7% ↓ |
| Neath Port Talbot | 82 | 2.40% | 57.2 | 50 or higher | 71% ↑ |
| Pembrokeshire | 64 | 1.90% | 50.9 | 50 or higher | -6% ↓ |
| Ceredigion | 29 | 0.80% | 39.9 | 25 to < 50 | 12% ↑ |
| Merthyr Tydfil | 24 | 0.70% | 39.8 | 25 to < 50 | 60% ↑ |
| Unknown | 25 | 0.70% | - | 19% ↑ | |
| Total | 3455 | 100.00% | 109.6 | 50 or higher | 69% ↑ |
At a Wales level, on 2 July, the 7-day rolling incidence of COVID-19 cases and the percentage of people testing positive for COVID-19 have increased since last week (slide 2).
The SAGE/ SPI-M consensus estimate of Reproduction number (Rt) is between 1.2 and 1.5 (as at 7 July 2021). When we look at reproduction numbers using PHW positive test data only (see second table below), a more timely estimate but limited by variation in testing, we see a reproduction number estimate of between 1.5 and 1.6 for Wales. PHW estimate a national doubling time of 10 days. The Rt number is above 2 for the Aneurin Bevan and Powys health boards. Doubling times range from 5 to 46 days. Source: PHW.
7-day cumulative case incidence in Wales has increased by two thirds in the last week. Case incidence has risen to 109.6 per 100,000 population in Wales compared with 64.8 per 100,000 population last week.
Case incidence is increasing in all local authorities. 20 of 22 local authorities have a case incidence above the 50 per 100,000 population threshold. Local authorities with the highest case incidences are in North Wales. Case incidence is highest for Wrexham and Flintshire at 254.5 and 215.9 per 100,000 population, respectively.
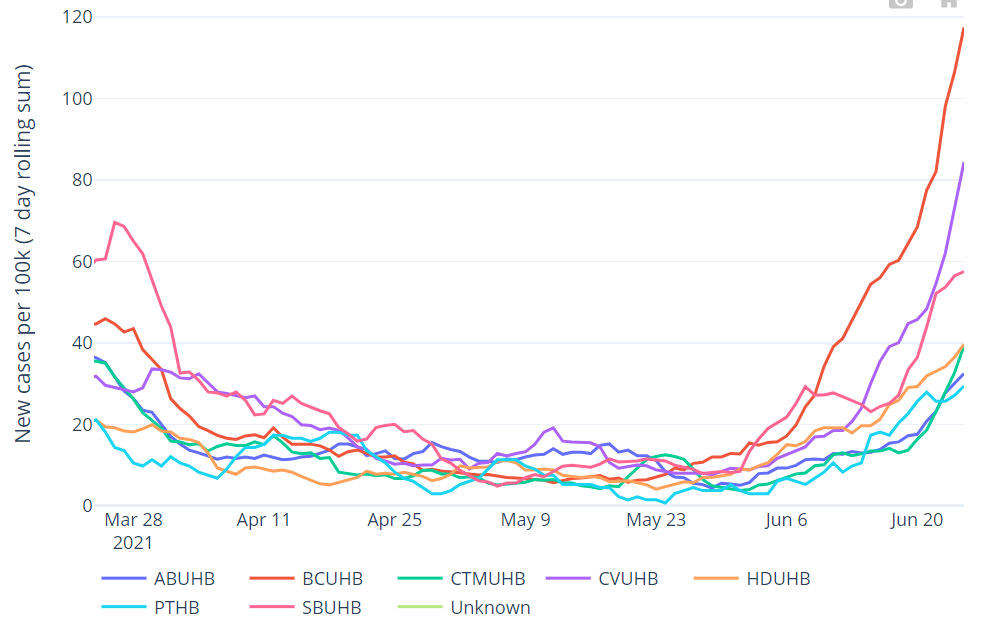
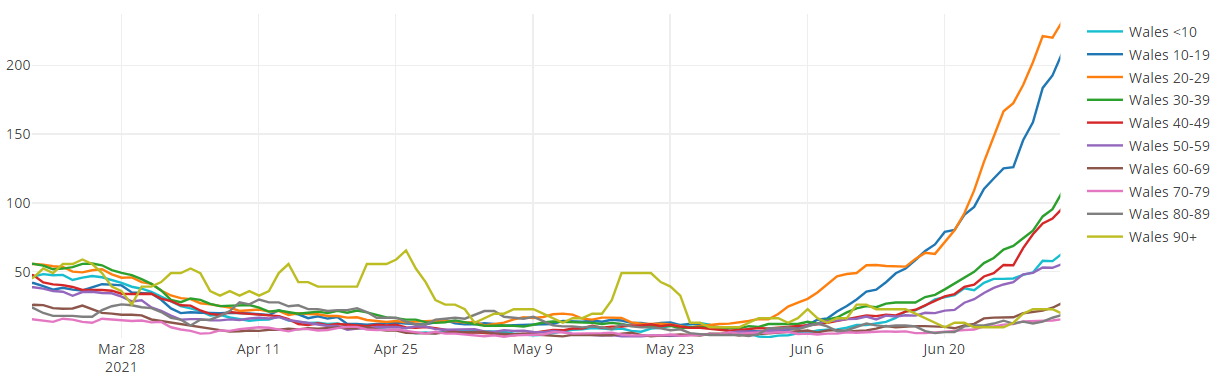
Over the past week, case incidence has risen sharply for those aged 20 to 29. Case incidence is highest for those aged 10 to 19 and 20 to 29. Case incidence is highest for the Betsi Cadwaladr health board.
The second table below provides estimates of doubling and halving times based on PHW COVID-19 positive test data. In this table, doubling times are positive, whilst halving times are negative. The 95% confidence intervals are showing in brackets after the central estimate. An asterisk (*) means that there are small numbers and estimates should be treated with caution. Local health board level estimates of Rt and halving times will be unstable when incidence is low.
| Area | Rt (95% CI) | Halving time (95% CI) |
|---|---|---|
| All Wales | 1.6 (1.5 to 1.6) | 10 (7 to 23) DOUBLING |
| Swansea Bay UHB | 1.2 (1.1 to 1.3) | 46 (11 to -21) DOUBLING |
| CTM UHB | 1.9 (1.7 to 2.0) | 7 (5 to 9) DOUBLING |
| Aneurin Bevan UHB | 2.4 (2.3 to 2.6) | 5 (4 to 8) DOUBLING |
| Cardiff & Vale UHB | 1.5 (1.4 to 1.6) | 10 (5 to 44) DOUBLING |
| Hywel Dda UHB | 1.5 (1.4 to 1.7)* | 8 (5 to 22)* DOUBLING |
| Powys THB | 2.6 (2.3 to 3.1)* | 5 (3 to 13)* DOUBLING |
| Betsi Cadwaladr UHB | 1.5 (1.4 to 1.5) | 13 (8 to 35) DOUBLING |
Cases per 100k (PHW Data) (7 day rolling sum)
Cases per 100k by age (PHW Data) (7 day rolling sum)
Data as at 12:00PM 6 July 2021 unless otherwise specified.
What is the situation with the NHS and social care?
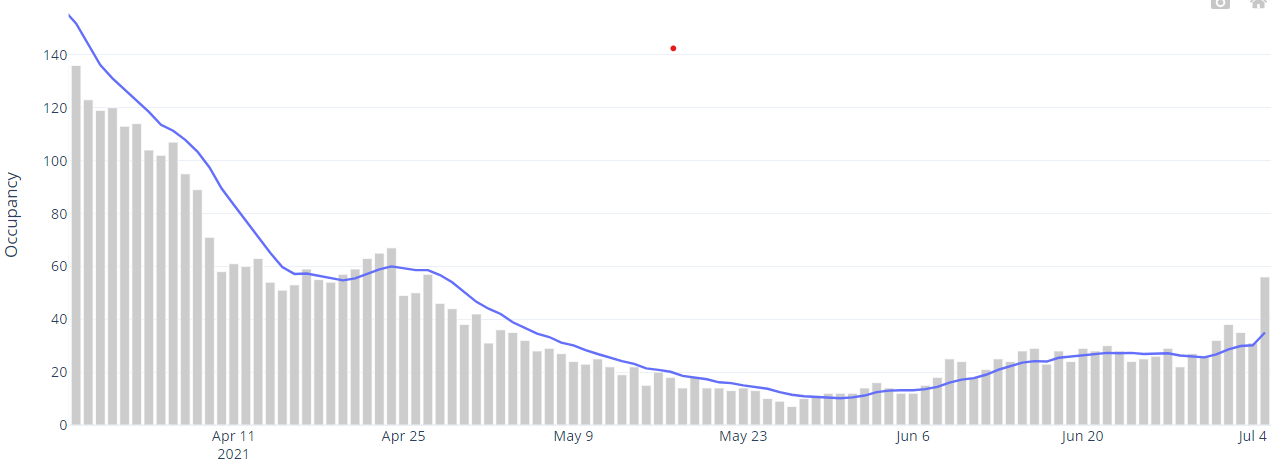
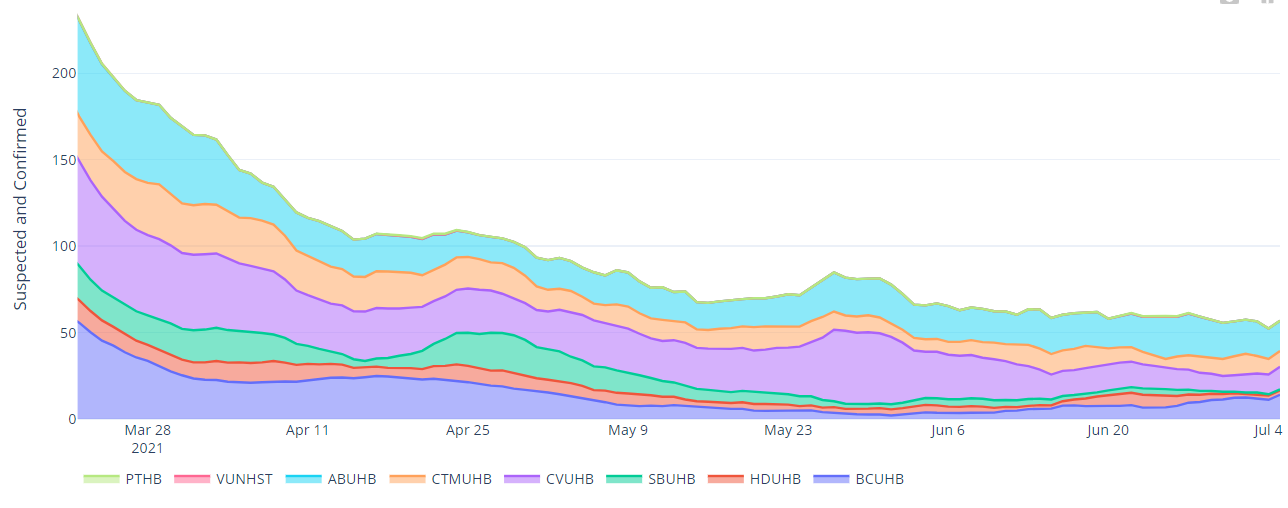
COVID-19 pressure on the NHS has remained relatively stable. The number of new daily admissions with suspected or confirmed COVID-19 is close to the lowest levels since reporting began, however there has been a slight increase in the number of beds occupied with COVID-19 related patients in recent weeks.
As at 7 July 2021, there were 124 COVID-19 related patients (Suspected, Confirmed and Recovering) occupying a hospital bed. This compares to 86 (38 more occupied beds) on 30 June 2021. Confirmed COVID-19 patients accounted for 57 of the total occupied beds and are at similar levels to late April 2021.
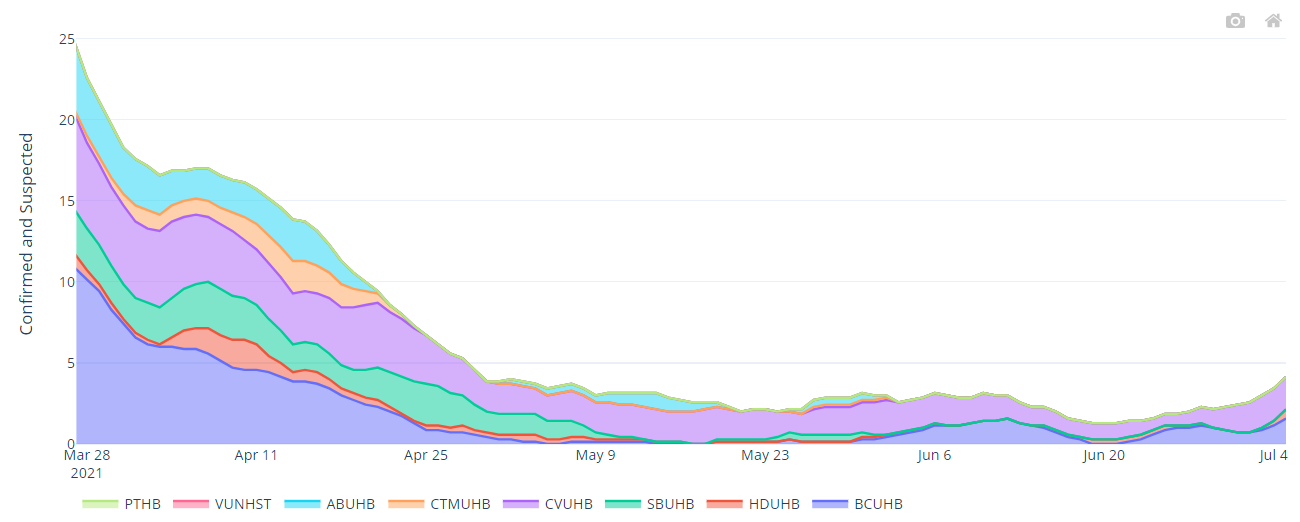
There are 5 patients with Suspected or Confirmed COVID-19 in critical care beds in Wales. This is 159 lower than the maximum COVID-19 position of approximately 164. The total number of patients in critical care for both COVID-19 and non-COVID-19 stands at 156, 4 more than the historic maximum critical care capacity of approximately 152.
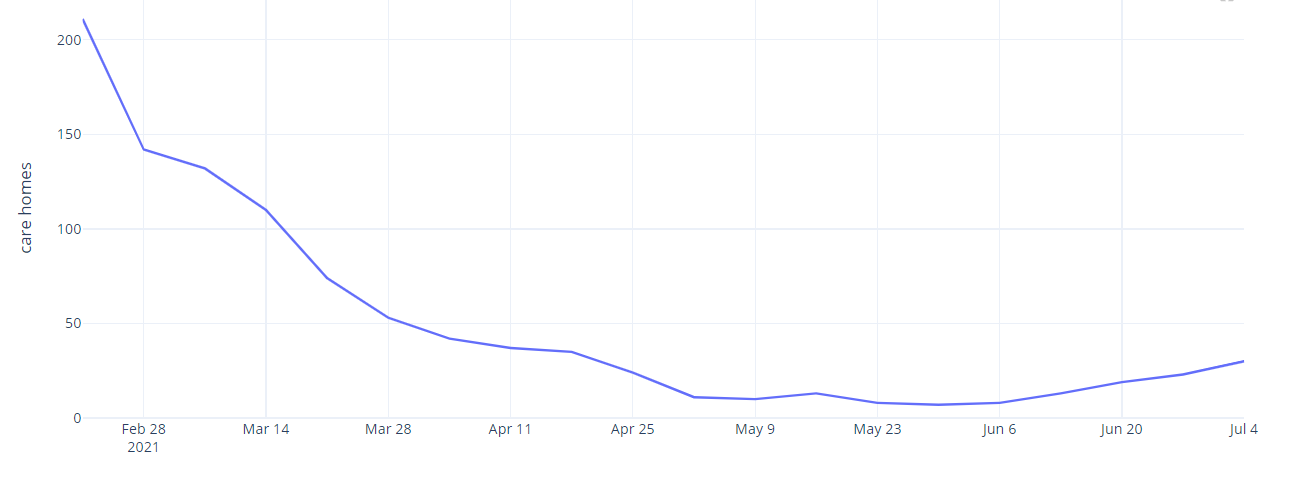
The situation with care homes remains relatively stable with a low number of care home incidents reported in Wales. Care homes are reporting small numbers of single cases in staff members, through their routine testing programme.
Confirmed hospital occupancy (7 day rolling average)
Overall invasive ventilated bed occupancy (7 day rolling average)
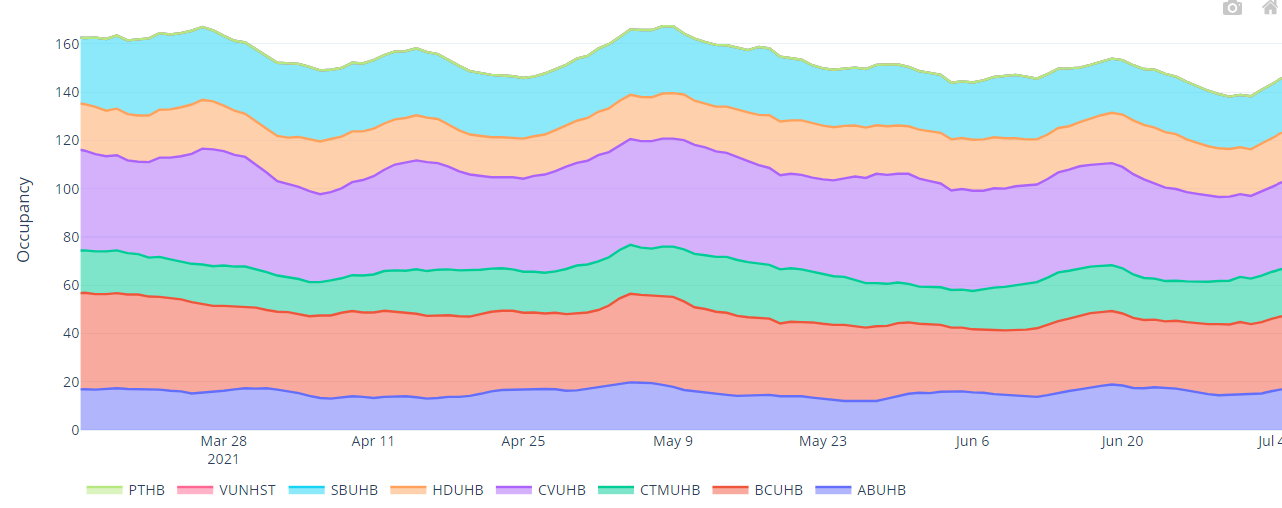
Hospital bed occupancy for suspected and confirmed COVID-19 positive patients (7 day rolling average)
Invasive ventilated bed occupancy for suspected and confirmed COVID-19 positive patients (7 day rolling average)
Number of adult care homes reported an ongoing outbreak/incident (last 7 days)
What is the situation with education, children and young adults?
Childcare settings
The latest National Situation Background Assessment Recommendation (SBAR) report covering the week of 28 June to 04 July reported that the incidence of clusters in child care settings remains low.
1* new cluster was reported last week compared to 3 new clusters reported the previous week across 3 health board areas.
*NB: figure does not include data from Conwy or Cwm Taf Morgannwg
Schools
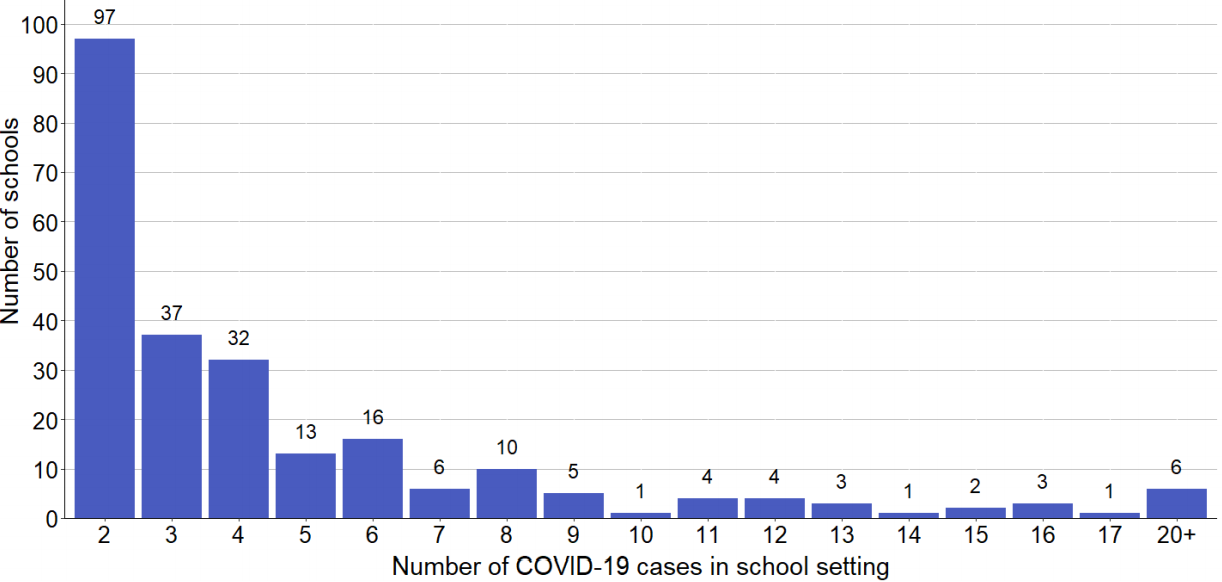
IMTs are reporting an increase in the number of children isolating when cases are confirmed in school settings. There were 25* new clusters associated with schools last week, which is a decrease from the 35 new clusters reported by IMTs the week before; and 33* ongoing clusters. 25* are attributed to school settings and 48* to household, social or extra-curricular activities.
Clusters continue to be reported in all but one health board. It is noted that community/household transmission and increased social contact outside of school, account for the majority of cases in most schools, with in school transmission itself, being limited. Source: National SBAR *NB: figure does not include data from Conwy, Cwm Taf Morgannwg or Gwynedd.
Weekly COVID-19 per 100,000 population for school age children and young adults incidence in Wales (data as at 1pm 7 July 2021)

Schools with more than one COVID-19 case identified within the last 21 days, excluding 263 schools with 1 COVID-19 case
Epidemiological curve of cases in all staff and pupils linked to a school between 22 February 2021 and 5 July 2021 for all Wales maintained schools

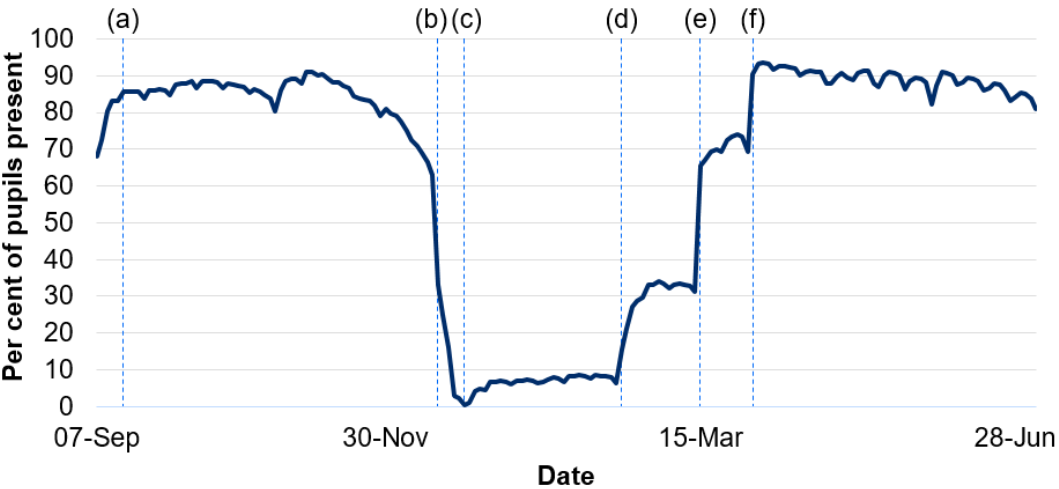
School Attendance
An average of 84% of all pupils were present in school over the week of 28 June to 2 July Source: Stats Wales.
Pupils present by day in Wales, from 7 September 2020
Further Education (FE)
The latest National SBAR reported 2* new clusters associated with FE settings this week compared to 11 reported the previous week. The clusters were reported by one health board and related to a secondary school sixth form and an FE College Source: National SBAR.
Higher Education Institutions (HEIs)
HEIs report cases notified to them by students and staff. From 1 February 2021 most HEIs have changed the way in which they report data, with positive cases referring only to students or staff attending campus or returning to the local area for study (with the exception of University of Wales Trinity St David's who are unable to split cases on this basis). Over the past week, the 7-day rolling average has been less than 5 positive COVID-19 cases for all HEI's. Source: Stats Wales.
We now also capture data via the National SBAR from local IMTs. There were no new clusters and 1* ongoing cluster associated with HE settings last week, compared to 1 new cluster and 2 ongoing clusters last week. There are ongoing cases among students from different institutions, with spread through social contact.
Source National SBAR*NB: figures do not include data from Conwy or Cwm Taf Morgannwg.
7 day rolling average of positive cases in Welsh universities 27 September to 4 July 2021

Please note: Due to accuracy & timeliness limitations with the capability of our surveillance systems, distinguishing exact case associations between children over 19, school staff and/or family members is currently not possible. We are looking to develop this with local health protection officers.
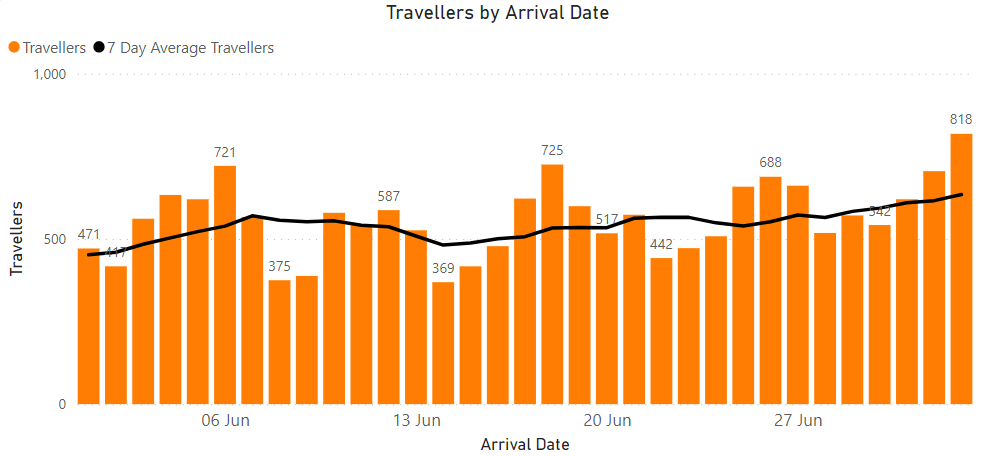
What is the situation with arriving travellers
There is an increase since last week in the overall arrivals (approximately 11%). The increase in overall arrivals is from amber list arrivals. Positives, remain steady at 0.2% with both red and green list arrivals also remaining low.
Due to increasing traveller volumes, community cases and limited staff capacity, the arriving travel team (ATT) in Wales, prioritise travellers who have been contacted.
- 4,258 total for this week (3,836 last week)
- Amber: 3,772 (3,450 last week)
- Red: 159 (182 last week)
- Green: 296 (168 for last week)
- There were 9 positive arrivals (0.2%)
- In the same period 524 (478 last week) of 4,258 travellers marked themselves as exempt (12.3%)
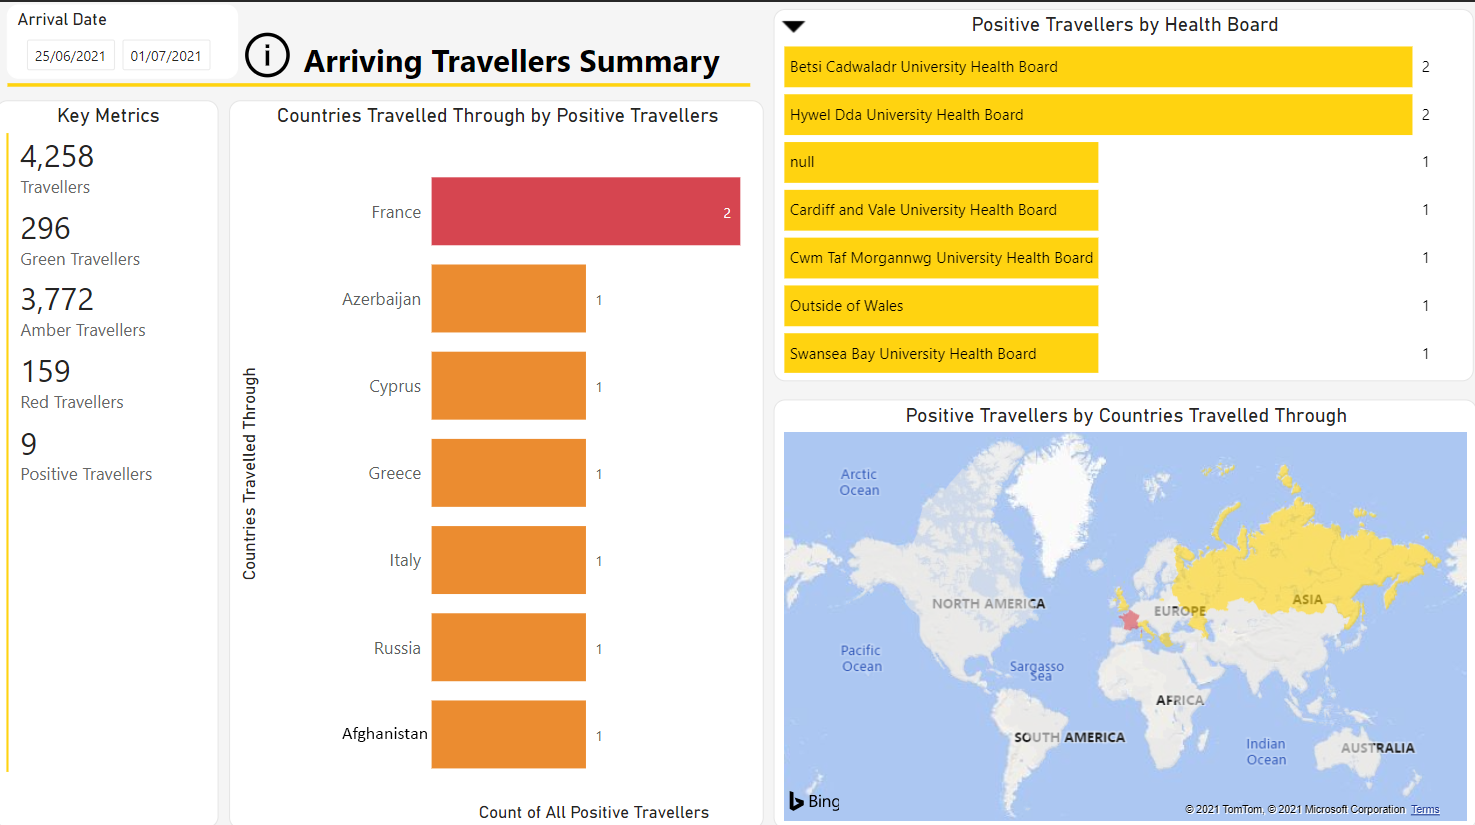
Source: Home Office, as at 1 July 2021
Please note that the data provided by the Home Office is derived from Passenger Locator Forms (PLF) which are self-completed by travellers. As such, data may contain inaccuracies. Due to the limitations associated with data capture and legislation, some minor discrepancies may be present in the data.
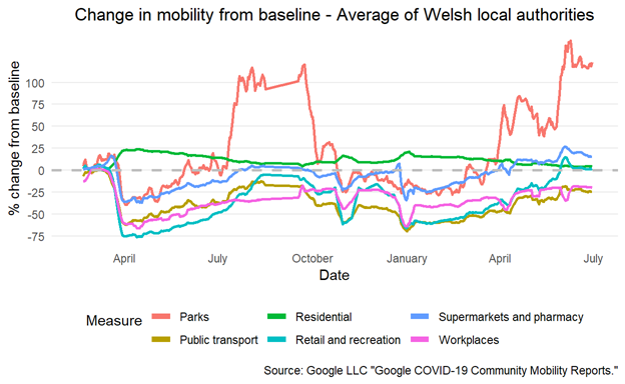
Mobility data, adherence and UK comparison
Recent mobility data shows small changes from the previous week. In some cases mobility remains above baseline, but lower than in half term week. The baseline for much of the data is during January to February 2020. It is not possible to determine if mobility is higher/lower than would have been expected prior to the pandemic as data for 2019 or earlier years is not published.
Mobility data by location of trip
Adherence
The most recent IPSOS MORI data for Wales is the same as last week, showing those who reported making essential trips only to be the lowest since the survey began in March 2020 and those ensuring they were more than 2m apart from others showing an increase from the last survey wave.
The latest results from the Public Engagement Survey on Health and Wellbeing during Coronavirus Measures for the period 21 to 27 June show that 40% of people say they understand the current restrictions in Wales ‘very well’. A further 45% reported understanding the restrictions ‘fairly well’. The survey also shows that 43% of people said they were following coronavirus restrictions ‘completely’ and a further 40% reported majority compliance. 47% reported having people outside their household/permitted support bubble come into their house, whilst 30% reported going into other people’s houses.
Results from the Coronavirus (COVID-19) Infection Survey, 27 June to 3 July
The percentage of people testing positive has continued to increase for all UK nations. The positivity rate is highest for Scotland and lowest for Wales.
It is estimated that an average of 9,000 people in Wales had COVID-19 (95% credible interval: 5,300 to 13,600), equating to around 1 in 340 people. This compares to around 1 in 160 people in England, around 1 in 100 people in Scotland, and around 1 in 300 people in Northern Ireland.
Source: Office for National Statistics COVID-19 Infection Survey
Positivity rates (%) across UK countries up to 3 July 2021

Vaccine and immunity status
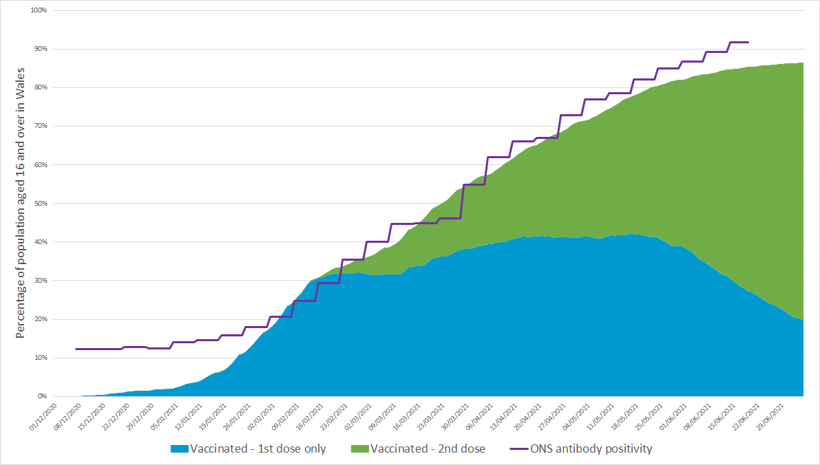
Vaccination and antibody status of individuals aged 16 and over in Wales
Immunity estimates and antibody status of individuals aged 16 and over in Wales

The COVID-19 vaccination rollout continues to progress well in Wales. As at 3 July 2021, 86% of people aged 16 and over had received at least one COVID-19 vaccine dose in Wales. 20% of people aged 16 and over had exactly one vaccine dose and 66% are fully vaccinated.
Between 14 and 20 June 2021, the ONS COVID infection survey estimated that 91.8% of the community population aged 16 and over in Wales tested positive for COVID-19 antibodies.
As at 3 July 2021, it was estimated that 80% of people aged 16 and over in Wales had some immunity against COVID-19 infection. The lower and higher estimates of immunity are 61% and 87% of people aged 16 and over in Wales. If no vaccines had been administered, it is estimated that 34% of people aged 16 and over would be immune. These estimates do not account for waning immunity and assume all natural infections lead to immunity.
It is currently estimated that over 80% (may be closer to 90%) of the population, spread evenly across Wales, must be immune to COVID-19 before population immunity effects would be observed (TAG advice on the Delta variant published on 18 June 2021). Note that the immunity estimate of 80% is for individuals aged 16 and over, not the total Wales population, and varies across age groups.
Differences between antibody presence and immunity estimates include:
- ONS antibody estimates are based on study participants who have volunteered for the study and estimates extrapolated.
- ONS estimates are based on the 16+ community population, which excludes people in care homes or hospitals. Immunity estimates are based on the whole 16+ Wales population.
- While antibody protection doesn’t equal immunity from infection, it does give a useful indication of the level of protection from infection in the Welsh population, on top of the impact of vaccines.
- We use the 2020 ONS mid-year estimates whereas the ONS antibody estimates use the 2019 ONS mid-year estimates.
Source: ONS COVID-19 Infection Survey, PHW, SPI-M, Swansea University modelling
What does the situation look like going forward?
Based on the current rates observed with current restrictions:
Cases
the probability of incidence greater than 200 per 100,000 between 18 July and 24 July is above 80% for 10 local authorities. The figure illustrates the probability (between 0 to 100%) of incidence being greater than 100 per 100,000. Source: Imperial College London.
Probability of greater than 100 per 100,000 cases by local authority
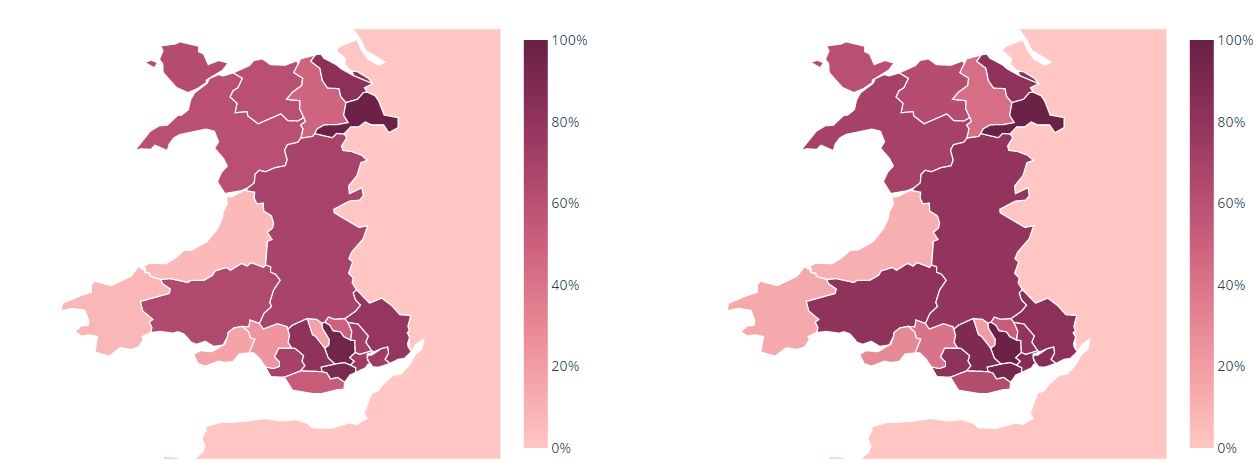
11 to 17 July and 18 to 24 July
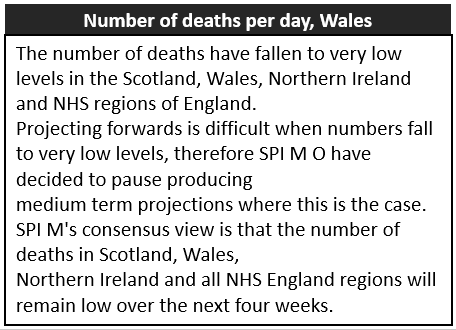
Deaths per day
SPI-M's consensus view is that the number of deaths in Wales will remain low over the next four weeks. Source: Modelled medium term projections, SAGE/SPI-M, 5 July.
Hospitalisations per day
projected to increase to around 25 per day over the next four weeks. Source: Modelled medium term projections, SAGE/SPI-M, 5 July.
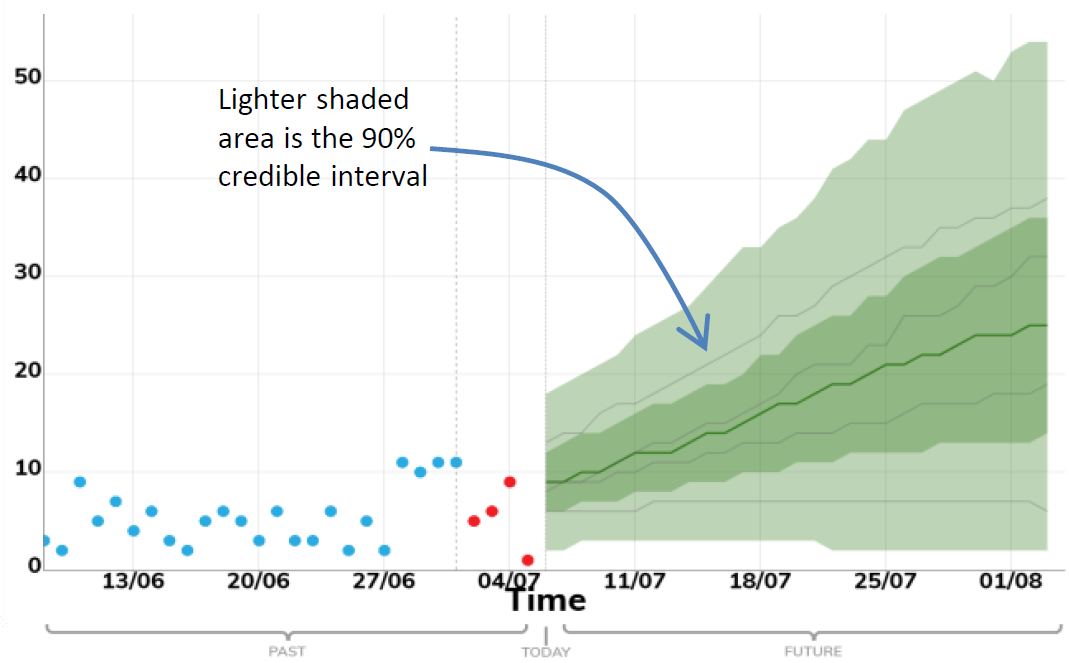
These projections are based on current trends and will not fully reflect the impact of policy or behavioural changes over the past two to three weeks. The projections include the impact of vaccines, but cannot capture any future increases in transmission resulting from new variants. They are not forecasts or predictions.
Key risks and sources
Key risks
Transmissions, incidence and prevalence
Overall transmission, percentage of people testing positive is rapidly increasing since last week.
Trends vary across health boards and local authorities.
NHS Capacity
COVID-19 pressure on the NHS remains relatively stable. The number of new daily admissions with suspected or confirmed COVID-19 is close to the lowest levels since reporting began. There has been a slight increase in the number of beds occupied with COVID-19 related patients in recent weeks
Mortality
Low numbers of deaths in the most recent week.
Variants
Wales has 3,666 confirmed cases of the more transmissible Delta variant (an increase of 1,917 from the previous week) making Delta the dominant variant of COVID-19 in Wales.
Immunity and vaccines
4.03 million (+0.11 million) doses of COVID-19 vaccine have been given in Wales, of which 2.27 (+0.02) million were first doses and 1.76 million (+0.19) were second doses.
International
There is an increase in travellers numbers this week, however positive rates continue to remain low.