Coronavirus (COVID-19) infection survey: 29 November to 5 December 2020
Analysis of the proportion of people testing positive for COVID-19 for 29 November to 5 December 2020.
In this page
The COVID-19 Infection Survey (CIS) is run across the whole of the UK and aims to estimate:
- how many people have the infection over a given time (positivity)
- how many new cases occur over a given period (incidence)
- how many people have antibodies to COVID-19
The survey helps track the extent of infection and transmission of COVID-19 among people in private residences, referred to as the community population.
Proportion of people in Wales who had COVID-19
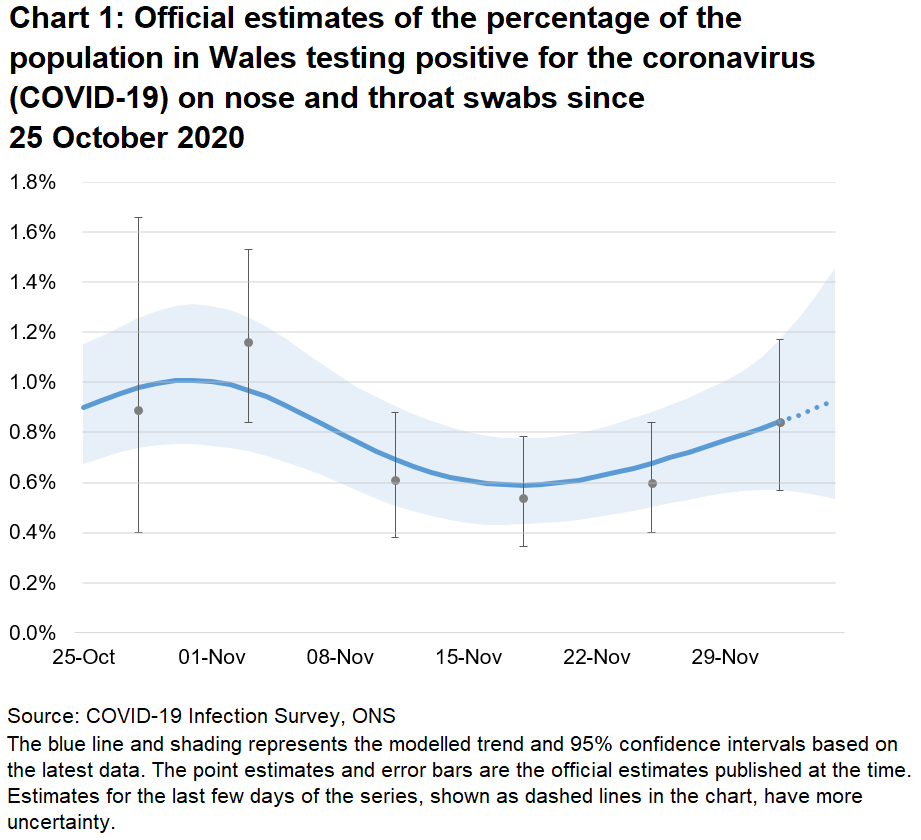
For the week of 29 November to 5 December 2020 it is estimated that an average of 0.84% of the community population had COVID-19 (95% credible interval: 0.57% to 1.17%).
This equates to around 1 in 120 individuals (95% credible interval: 1 in 175 to 1 in 85), or an estimated 25,600 people in total (credible interval: 17,300 to 35,600).
The positivity rate appears to have increased in the last two weeks, after falling from a peak at the end of October. Since the estimates are based on a relatively low number of positive tests, there is some uncertainty and the results should be interpreted with caution.
Antibodies
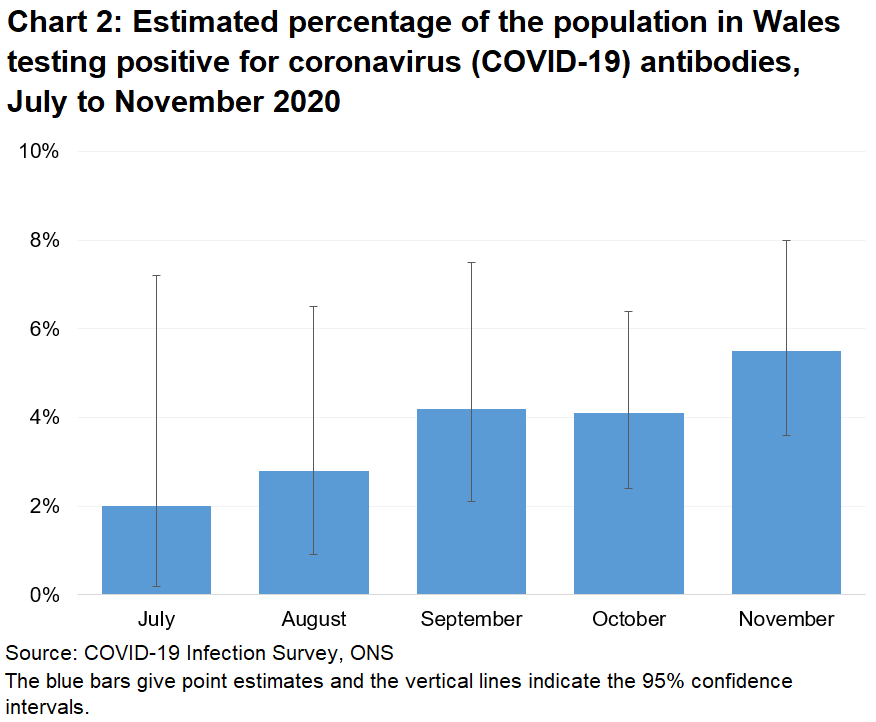
As part of the survey we measure the presence of antibodies to understand who has had COVID-19 in the past. Updates to antibodies estimates are provided on a monthly basis.
One way the body fights infections like COVID-19 is by producing small particles in the blood called antibodies. It takes between two and three weeks for the body to make enough antibodies to fight the infection. The length of time antibodies remain at detectable levels in the blood is not fully known. It is also not yet known how having detectable antibodies, now or at some time in the past, affects the chance of getting COVID-19 again.
In November, 5.5% (95% confidence interval: 3.6% to 8.0%) of people aged 16 and over tested positive for antibodies to the coronavirus (COVID-19). The estimate is weighted to be representative of the overall population, and equates to around 1 in 18 people (95% confidence interval: 1 in 28 to 1 in 12), or around 140,000 individuals in total (95% confidence interval: 91,000 to 203,000).
Chart 2 gives monthly estimates from July (when antibody estimates were first available for Wales). Though there is uncertainty with the estimates, it does appear that antibody rates have increased since the summer. Antibody levels in the blood can decline over time, meaning that some people who have previously had COVID-19 may subsequently test negative for antibodies. For this reason, these figures should be regarded as estimates of monthly antibodies prevalence, not cumulative exposure.
Estimates for the countries of the UK
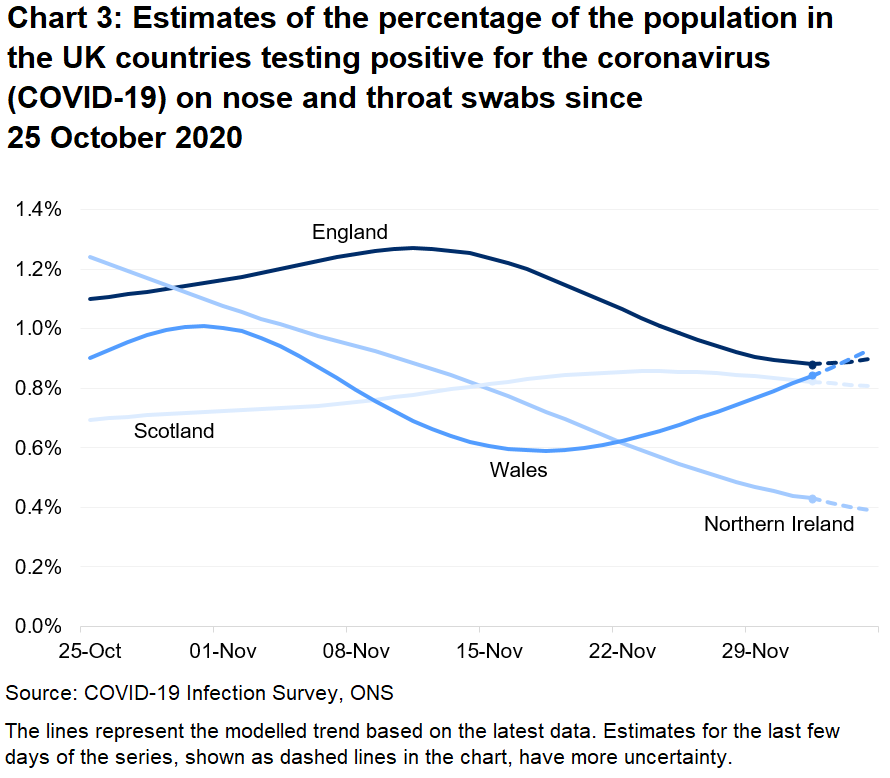
At the midpoint of the most recent week (29 November to 5 December 2020) the positivity rates for Wales, Scotland and England were very close, though the trend in Wales appears to be increasing.
There is some uncertainty around the individual point estimates for the nations. Estimates for the last few days of the series, shown as dashed lines in the chart below, have more uncertainty.
| Positivity rates (95% Confidence Interval) |
|||
|---|---|---|---|
| Wales | 0.84% (0.57 to 1.17) |
1 in 120 people (1 in 175 to 1 in 85) |
25,600 people (17,300 to 35,600) |
| England | 0.88% (0.83 to 0.94) |
1 in 115 people (1 in 120 to 1 in 105) |
481,500 people (450,800 to 513,600) |
| Scotland | 0.78% (0.60 to 0.98) |
1 in 130 people (1 in 165 to 1 in 100) |
40,900 people (31,500 to 51,800) |
| Northern Ireland | 0.52% (0.33% to 0.77%) |
1 in 190 people (1 in 305 to 1 in 130) |
9,500 people (6,000 to 14,100) |
Source: COVID-19 Infection Survey, Office for National Statistics
Definitions
Community population
This survey covers people living in private households only and this is referred to as the community population. Residents in hospitals, care homes and/or other institutional settings are excluded.
Confidence intervals
A confidence interval gives an indication of the degree of uncertainty of an estimate, showing the precision of a sample estimate. The 95% confidence intervals are calculated so that if we repeated the study many times, 95% of the time the true unknown value would lie between the lower and upper confidence limits. A wider interval indicates more uncertainty in the estimate. Overlapping confidence intervals indicate that there may not be a true difference between two estimates.
Credible intervals
A credible interval gives an indication of the uncertainty of an estimate from data analysis. 95% credible intervals are calculated so that there is a 95% probability of the true value lying in the interval.
Incidence
The number of new infections over a period of time.
Modelled estimates
Estimates of positivity from this survey are based on statistical modelling of the underlying data. The model smooths the series to understand the trend and is revised each week to incorporate new test results.
Point estimates
The headline point estimates are based on the modelled trend and are reflect the most representative reference point for the given week.
Positivity rate
The estimated proportion of people who test positive for coronavirus (COVID-19) at a point in time, with or without symptoms, based on nose and throat swabs.
Quality and methodology information
The results of the survey are based on self-administered nose and throat swabs provided by participants to the study. A subgroup of participants also provide blood test, taken by trained field staff.
As well as looking at overall incidence, positivity and antibody level, the survey will be used to examine the characteristics of those testing positive for COVID-19 and the extent to which those infected experience symptoms. The results are for private households only and do not apply to those in hospitals, care homes or other institutional settings. This is referred to as the community population.
The survey covers all the countries of the UK, enabling estimates to be calculated for each country individually, and in time the UK as a whole. Fieldwork started first in England on 26 April meaning there is more cumulative data available for England enabling more detailed analysis at present. Fieldwork began in Wales on 29 June 2020 followed by Northern Ireland on 26 July and Scotland on 21 September.
The sample for Wales is not yet large enough to support more detailed analysis than is provided here (headline figures for positivity and antibodies). Fieldwork has been scaled up, with the intention of delivering approximately 9,000 participants per fortnight. Currently, the expectation is that this will be reached by mid-March. Sample increases will enable more detailed analysis, which may include incidence (the number of new infections over a period of time) and analysis of the characteristics of people testing positive. The type of analysis that is possible will also depend on the underlying prevalence of the virus, with higher infection rates enabling more analysis and vice versa.
It is important to note that there is a significant degree of uncertainty with the estimates. This is because, despite a large sample of participants, the number of positive cases identified is small. Estimates are provided with 95% credible or confidence intervals to indicate the range within which we may be confident the true figure lies.
The modelled estimates are carried out afresh each week using the previous 6 weeks’ data. The model works by smoothing the series to understand the trend and is revised each week to incorporate new test results. This means that the latest estimate for an earlier period may be different to the official estimate that was produced at the time. Chart 1 shows the latest modelled trend and the official (point) estimates that were published at the time.
The Office for National Statistics (ONS) publishes weekly statistical bulletins and references tables and periodic statistical articles which include results for England, Wales, Northern Ireland and Scotland as they become available. The estimates for Northern Ireland and Scotland are published by the respective administrations, as we do here for Wales.
Further information about quality and methodology can be found on the ONS website and the survey pages on the Oxford University site.
Well-being of Future Generations Act (WFG)
The Well-being of Future Generations Act 2015 is about improving the social, economic, environmental and cultural well-being of Wales. The Act puts in place seven well-being goals for Wales. These are for a more equal, prosperous, resilient, healthier and globally responsible Wales, with cohesive communities and a vibrant culture and thriving Welsh language. Under section (10)(1) of the Act, the Welsh Ministers must (a) publish indicators (“national indicators”) that must be applied for the purpose of measuring progress towards the achievement of the Well-being goals, and (b) lay a copy of the national indicators before the National Assembly. The 46 national indicators were laid in March 2016.
Information on the indicators, along with narratives for each of the well-being goals and associated technical information is available in the Well-being of Wales report.
Further information on the Well-being of Future Generations (Wales) Act 2015.
The statistics included in this release could also provide supporting narrative to the national indicators and be used by public services boards in relation to their local well-being assessments and local well-being plans.
Contact
Statistician: Ryan Pike
Telephone: 0300 025 6415
Email: kas.covid19@gov.wales
Media: 0300 025 8099
SFR 225/2020