Coronavirus (COVID-19) infection survey (antibodies data): 4 February to 3 March 2021
Analysis of the proportion of people in Wales testing positive for COVID-19 antibodies for 4 February to 3 March 2021.
This file may not be fully accessible.
In this page
The antibody data presented is part of the Coronavirus (COVID-19) Infection Survey (CIS) which is run across the whole of the UK. The data can be used to identify individuals who have had the infection in the past or have developed antibodies as a result of vaccination.
The analysis presented on past infection and/or vaccination, is defined as testing positive for antibodies to SARS-CoV-2 based on findings from the COVID-19 Infection Survey. SARS-CoV-2 is the scientific name given to the specific virus that causes COVID-19.
Further information on these changes, along with estimates of antibody positivity broken down by age for each of the UK countries can be found on the Office for National Statistics website.
Proportion of people in Wales who had antibodies against COVID-19
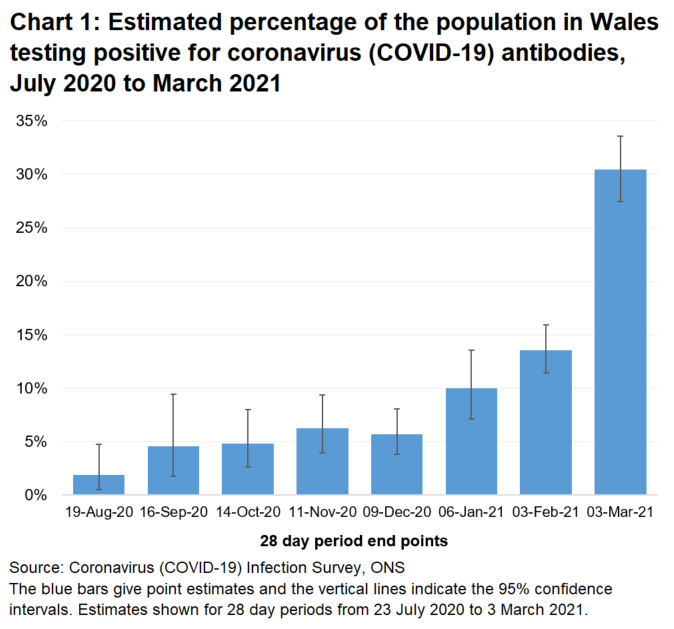
Between 4 February and 3 March 2021, 30.5% (95% confidence interval: 27.5% to 33.6%) of people aged 16 and over tested positive for antibodies to the coronavirus (COVID-19).
The estimate is weighted to be representative of the overall population, and equates to around 1 in 3 people (95% confidence interval: 1 in 4 to 1 in 3), or around 773,000 individuals in total (95% confidence interval: 697,000 to 852,000).
Though there is uncertainty with the estimates, it appears that there has been a sizeable increase in antibody rates recently. As more people become vaccinated the number of people with antibodies is likely to increase.
Antibody levels in the blood can decline over time, meaning that some people who have previously had COVID-19 may subsequently test negative for antibodies. For this reason, these figures should be regarded as estimates of monthly antibodies prevalence, not cumulative exposure.
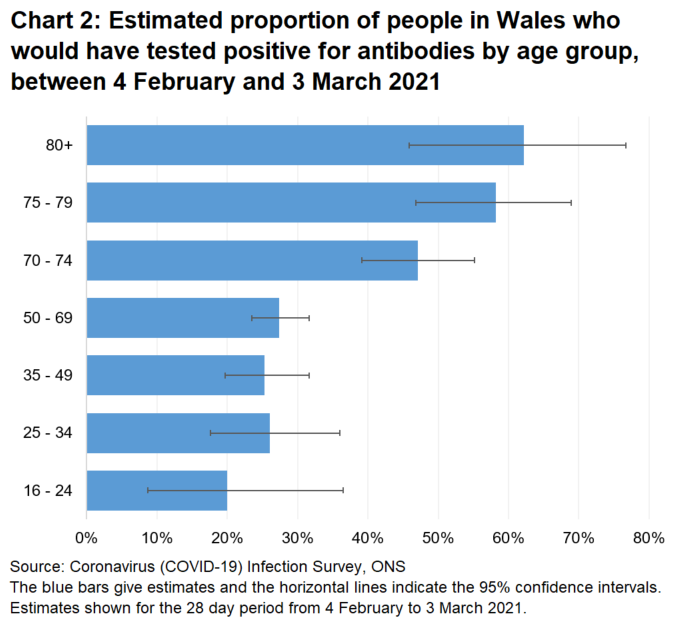
In the 28 days up to 3 March 2021, the percentage of people aged 80 years and over testing positive for antibodies was 62.2% (95% confidence interval: 45.8% to 76.7%).
The percentage of people testing positive for antibodies was lower for those aged under 70, ranging from 20.0% to 27.4%. The higher percentages seen for those aged 70 and over is likely to be due to higher vaccination rates.
Caution should be taken in over-interpreting the latest estimates. Confidence intervals are wide and the sample size is relatively low, meaning there is higher uncertainty in these figures.
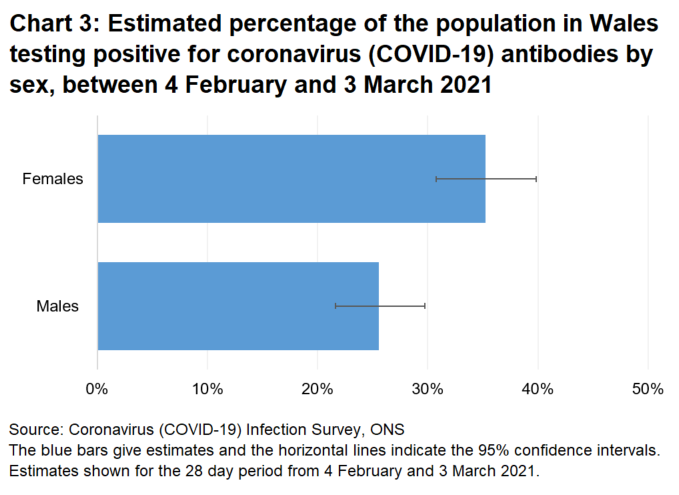
In the 28 days up to 3 March 2021, the percentage of people testing positive for antibodies appeared to be higher for females at 35.2% (95% Confidence Interval: 30.8% to 39.9%) than males at 25.5% (95% Confidence Interval: 21.6% to 29.7%).
Caution should be taken in over-interpreting the latest estimates. Confidence intervals are wide and the sample size is relatively low, meaning there is higher uncertainty in these figures.
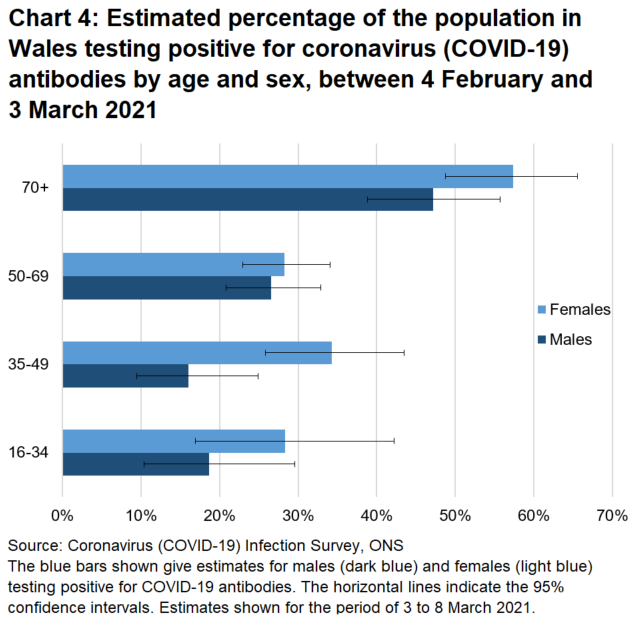
In the 28 days up to 3 March 2021, the percentage of people testing positive for COVID-19 antibodies was higher in females than in males, and this is broadly consistent across all age groups.
Caution should be taken in over-interpreting the latest estimates. Confidence intervals are wide and the sample size is relatively low, meaning there is higher uncertainty in these figures.
Definitions
Community population
This survey covers people living in private households only and this is referred to as the community population. Residents in hospitals, care homes and/or other institutional settings are excluded.
Confidence intervals
A confidence interval gives an indication of the degree of uncertainty of an estimate, showing the precision of a sample estimate. The 95% confidence intervals are calculated so that if we repeated the study many times, 95% of the time the true unknown value would lie between the lower and upper confidence limits. A wider interval indicates more uncertainty in the estimate. Overlapping confidence intervals indicate that there may not be a true difference between two estimates.
Positivity rate
The estimated proportion of people who test positive for antibodies against coronavirus (COVID-19) at a point in time.
Quality and methodology information
The reporting of antibody estimates has recently changed. Weighted estimates for 28-day periods of antibody positivity are now presented, rather than monthly estimates. Please note that these estimates cannot be directly compared with previously published monthly antibody estimates.
The analysis presented is based on blood test results taken from a randomly selected subsample of individuals aged 16 years and over, which are used to test for antibodies against SARS-CoV-2. This can be used to identify individuals who have had the infection in the past or have developed antibodies as a result of vaccination.
One way the body fights infections like COVID-19 is by producing small particles in the blood called antibodies. It takes between two and three weeks after infection or vaccination for the body to make enough antibodies to fight the infection. Antibodies remain in the blood at low levels, although these levels can decline over time to the point that tests can no longer detect them. Having antibodies can help to prevent individuals from getting the same infection again.
The presence of antibodies is measured to understand who has had coronavirus (COVID-19) in the past and the impact of vaccinations. Once infected, the length of time antibodies remain at detectable levels in the blood is not fully known. It is also not yet known how having detectable antibodies, now or at some time in the past, affects the chance of getting COVID-19 again.
These statistics refer to infections reported in the community, by which we mean private households. These figures exclude infections reported in hospitals, care homes and/or other institutional settings. The population used in this analysis relates to the community population aged 16 years and over.
It is important to note that there is a significant degree of uncertainty with the estimates. This is because, despite a large sample of participants, the number of positive cases identified is small. Estimates are provided with 95% confidence intervals to indicate the range within which we may be confident the true figure lies.
Further information on antibody test results is published by the Office for National Statistics (ONS) and includes antibody information for England, Wales, Scotland and Northern Ireland. The estimates for Northern Ireland and Scotland are published by the respective administrations, as we do here for Wales.
Further information about quality and methodology can be found on the ONS website and the survey pages on the Oxford University site.
More information about the COVID-19 Infection Survey in Wales.
Well-being of Future Generations Act (WFG)
The Well-being of Future Generations Act 2015 is about improving the social, economic, environmental and cultural well-being of Wales. The Act puts in place seven well-being goals for Wales. These are for a more equal, prosperous, resilient, healthier and globally responsible Wales, with cohesive communities and a vibrant culture and thriving Welsh language. Under section (10)(1) of the Act, the Welsh Ministers must (a) publish indicators (“national indicators”) that must be applied for the purpose of measuring progress towards the achievement of the Well-being goals, and (b) lay a copy of the national indicators before Senedd Cymru. The 46 national indicators were laid in March 2016.
Information on the indicators, along with narratives for each of the well-being goals and associated technical information is available in the Well-being of Wales report.
Further information on the Well-being of Future Generations (Wales) Act 2015.
The statistics included in this release could also provide supporting narrative to the national indicators and be used by public services boards in relation to their local well-being assessments and local well-being plans.
Next update
30 March 2021
Contact details
Statistician: Lisa Bloemberg
Telephone: 0300 025 0166
Email: kas.covid19@gov.wales
Media: 0300 025 8099
SFR 76/2021