Attendance at local authority settings during the coronavirus (COVID-19) pandemic: 26 to 29 May 2020
Attendance of children and staff on weekdays (excluding bank holidays) at local authority settings during the ongoing coronavirus pandemic for 26 to 29 May 2020.
In this page
1. Headline national figures
The latest figures in this release cover the week of 26 to 29 May, which would normally have been the Whitsun school holidays. In keeping with the trends seen over the Easter school holidays, the figures for this latest week are lower than in previous weeks.
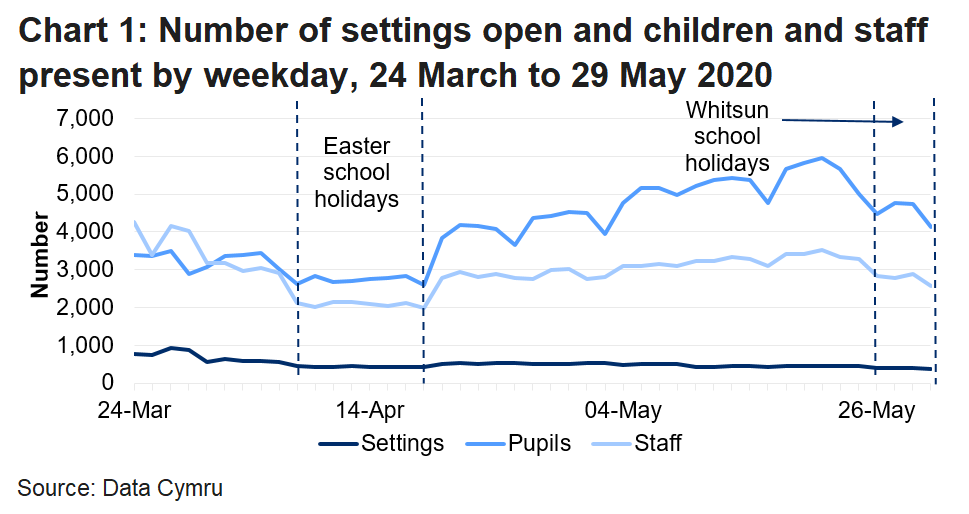
During the week of 26 May to 29 May:
- On average 390 settings were open each day, down from 456 in the previous week. An average of 583 settings were open in the week before the Easter school holidays. More local authorities have moved to a ‘hub’ approach since the data collection began.
- 4,500 pupils attended settings, down from 5,600 seen the previous week, but up from the 3,300 in the two weeks before the Easter school holidays. Attendance on Friday is usually lower, perhaps reflecting working patterns of part time key workers.
- There were 2,800 staff present, down from 3,400 in the previous week and 3,100 in the week before the Easter school holidays.
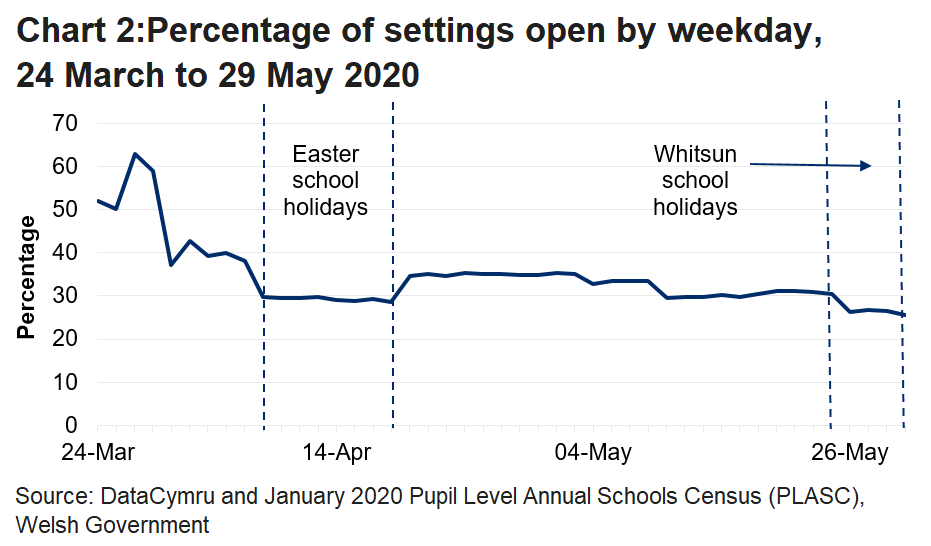
Percentage of settings open by weekday, 24 March to 29 May 2020 (MS Excel)
During the week of 26 May to 29 May:
- On average 26% of settings were open, down from 31% in the previous week, and down from 39% in the week before the Easter school holidays.
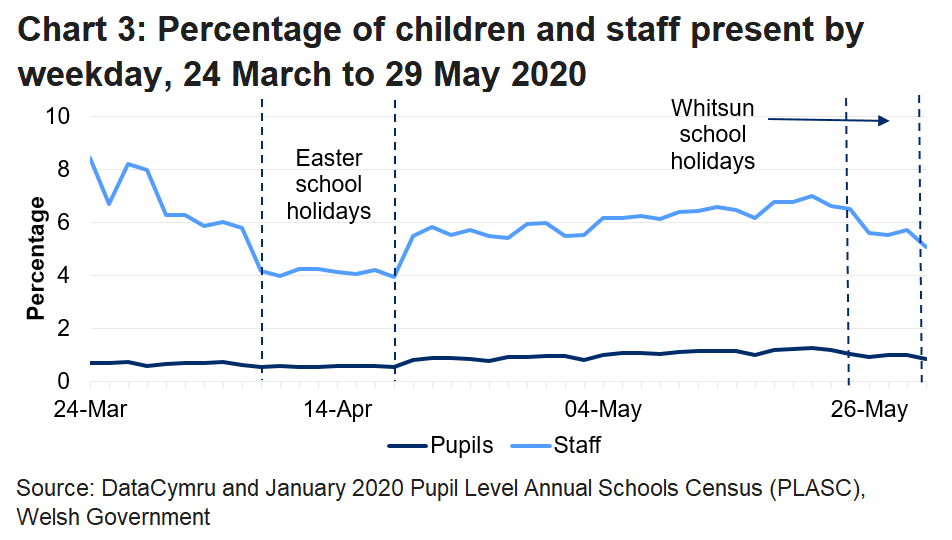
Percentage of children and staff present by weekday, 24 March to 29 May 2020 (MS Excel)
During the week of 26 May to 29 May:
- 1.3% or less of pupils have attended local authority settings each day over the course of the data collection.
- On average 5.5% of staff were present in local authority settings in the latest week, down from 6.7% in the previous week and down from 6.1% in the week before the Easter school holidays.
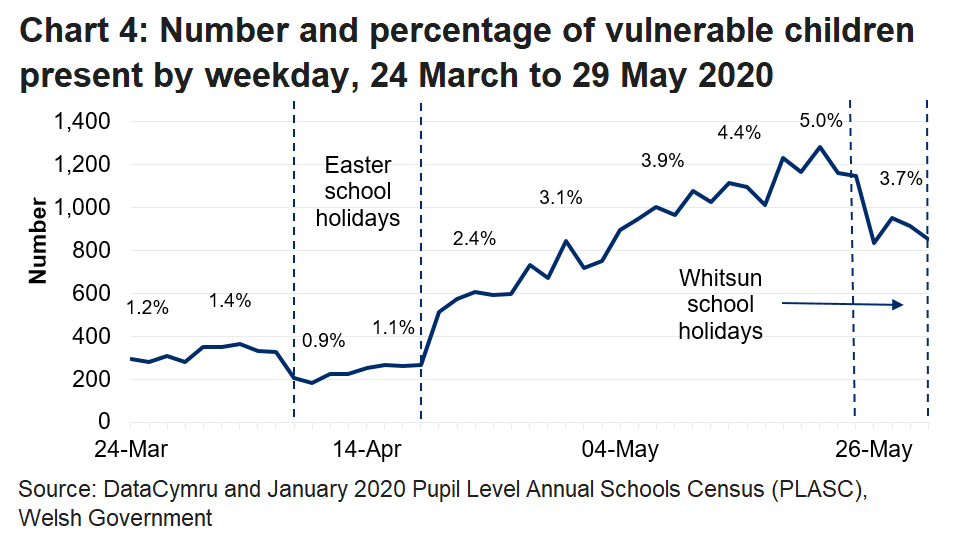
Number and percentage of vulnerable children present by weekday, 24 March to 29 May 2020 (MS Excel)
Vulnerable children are children with a social worker or with Statements of special educational needs. Please see the notes for further information.
The percentages in this chart are based on an estimated total number of 24,112 vulnerable children in Wales. Please see the notes for further detail on this calculation. Percentages shown are weekly averages of the percentage of all vulnerable children attending settings.
During the week of 26 May to 29 May:
- On average 890 (3.7%) vulnerable children attended settings, down from 1,200 (5.0%) seen the previous week, but up from 340 (1.4%) in the week before the Easter school holidays.
2. Quality and methodology information
Context
On Wednesday 18 March 2020 it was announced that all educational establishments in Wales would close at the latest on Friday 20 March 2020. The exception was provision for children of critical workers and vulnerable children due to the ongoing coronavirus pandemic.
Education and child care: coronavirus has a wide range of information about education in Wales and the impact of coronavirus.
The information presented in this release helps to monitor demands for provision in settings that are open.
Definition of vulnerable children
Vulnerable children are children with a social worker and with Statements of special educational needs. In this context, children who have a social worker include children with care and support or support plans, children on the child protection register and children who are looked after. You can find further information at our Vulnerable children and young people: coronavirus page.
To calculate the percentage of vulnerable children who are attending a setting, we have estimated the total number of vulnerable children in Wales to be 24,112. This is calculated as follows:
| Number of children in the Children Receiving Care and Support Census (CRCS) with a UPN as at March 2019 | 13,462 |
| Number of children in PLASC with a statement of special educational needs as at January 2020 | 13,513 |
| Number of children in both CRCS and PLASC | 2,863 |
| Number of children in PLASC after removing those children who are also in CRCS | 13,513 - 2,863 = 10,650 |
| Number of children in CRCS + number of additional children in PLASC = number of vulnerable children | 13,462 + 10,650 = 24,112 |
Relevance
These statistics are used daily for a number of purposes:
- understanding demand and resource implications
- to support evidence-based advice on future decisions around reviews of lockdown arrangements
- contributions to UK wide monitoring and decision-making, with figures for Wales being provided on a daily basis to the UK Government
- ministerial briefings and press conferences
Accuracy
Data is collected on a daily basis via an online form developed and maintained by DataCymru. This is an aggregate return rather than being at individual pupil level. The data is validated against previous returns and any significant changes are queried.
Local authorities are asked to submit data by 3pm each day.
The data collection covers all settings that local authorities are using to provide child care during the coronavirus pandemic. These settings do not necessarily have to be schools. Local authorities may choose to use other community facilities to provide provision. The data does not currently include any provision in independent schools.
The data collection covers children of any age.
Rates are calculated using data from the January 2020 school census. Please note that the denominators used are for the total number of children in school and the total number of staff, but there may be both children and staff attending settings that would not normally attend a school. The rates are meant to give a general indication of coverage.
Timeliness and punctuality
The data in this release provides data for the last week and comparisons to previous weeks.
Accessibility and clarity
This statistical release has been pre-announced and then published on the Statistics and Research section of our website. It is accompanied by an Open Document Spreadsheet to allow users to have direct access to the data that underlies the charts in this release.
Comparability
Data for England was first published on 21 April 2020.
Data is not published for Scotland or Northern Ireland.
National Statistics status
These statistics are not National Statistics. However, as far as has been practicable, they have been collected and validated in accordance with the pillars and principles within the Code of Practice for Statistics. We continue to develop the data collection and quality assurance process to improve the data.
These statistics have been produced quickly in response to developing world events. The Office for Statistics Regulation, on behalf of the UK Statistics Authority, has reviewed them against several key aspects of the Code of Practice for Statistics and regards them as consistent with the Code’s pillars of Trustworthiness, Quality and Value.
Letter from the Director of General Regulation endorsing the publication of the statistics can be found on the UK Statistics Authority website.
Well-being of Future Generations Act (WFG)
The Well-being of Future Generations Act 2015 is about improving the social, economic, environmental and cultural wellbeing of Wales. The Act puts in place seven well-being goals for Wales. These are for a more equal, prosperous, resilient, healthier and globally responsible Wales, with cohesive communities and a vibrant culture and thriving Welsh language. Under section (10)(1) of the Act, the Welsh Ministers must (a) publish indicators ('national indicators') that must be applied for the purpose of measuring progress towards the achievement of the wellbeing goals, and (b) lay a copy of the national indicators before the National Assembly. The 46 national indicators were laid in March 2016.
Information on the indicators, along with narratives for each of the well-being goals and associated technical information is available in the Well-being of Wales report.
Further information on the Well-being of Future Generations (Wales) Act 2015.
The statistics included in this release could also provide supporting narrative to the national indicators and be used by public services boards in relation to their local well-being assessments and local wellbeing plans.
Next update
This is currently a weekly statistical release. It will usually be published at midday every Monday. We will review the frequency in line with changing user need.
The next release will be on Monday 8 June.
We want your feedback
We welcome any feedback on any aspect of these statistics which can be provided by email to school.stats@gov.wales.
3. Contact details
Statistician: Stephen Hughes
Telephone: 0300 025 5060
Email: school.stats@gov.wales
Media: 0300 025 8099
SFR 55/2020