Absence from school amongst children living in homeless households
This output compares school age children living in households who approach the City and County of Swansea housing team, with those who do not or the ‘stabily’ housed.
In this page
Introduction
Under the Housing (Wales) Act (2014), local authorities in Wales are required to prevent and alleviate homelessness through the provision of advice and assistance to households either at risk of or who are homeless (Allocation of accommodation and homelessness: guidance for local authorities). Each local authority in Wales has its own ‘housing team’, whose function is to coordinate the provision of assistance under the Housing (Wales) Act. Assistance can range from the provision of information on money management, up to securing alternative accommodation for the household, which can include placement in temporary accommodation by the council.
This output examines all approaches by households to the City and County of Swansea’s housing team. Data did not enable a detailed analysis of different types of assistance required, therefore this analysis explores all approaches made to the housing team, regardless of the severity of the housing issue faced by the household. Specifically, we compare school age children living in households who approach the City and County of Swansea housing team, with those who do not or the ‘stabily’ housed. See below for a detailed overview of the data used in this analysis.
Main results
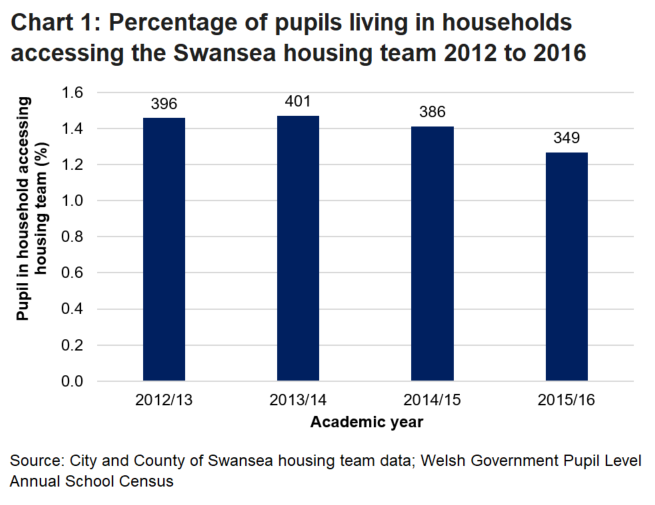
- In any given academic year, just over 1% of pupils (between the ages of 5 and 16 years old) were living in households that have accessed the City and County of Swansea housing team.
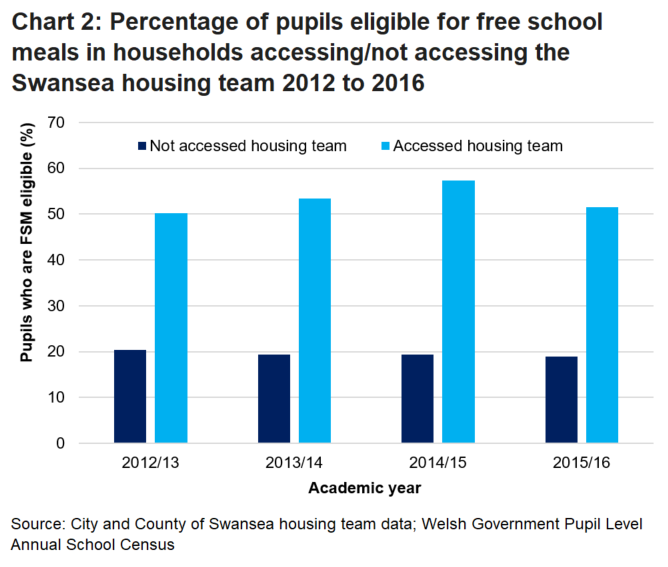
- The proportion of children who were eligible for free school meals was greater amongst households accessing the Swansea housing team.
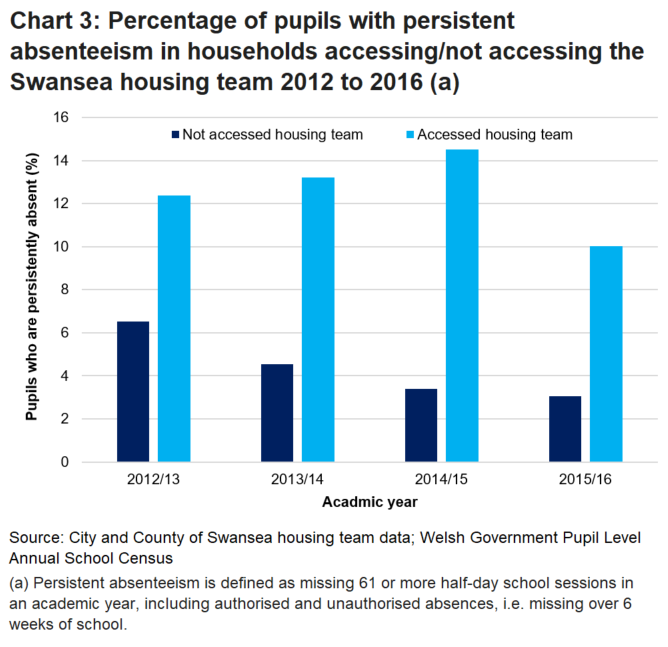
- Absenteeism varied with academic year, but levels were consistently higher amongst children living in households that were accessing the Swansea housing team.
- Becoming homeless or at risk of homelessness was associated with a 7% increase in total sessions absent from school.
Linked data
This analysis is based on the linkage of three administrative data sources: City and County of Swansea housing team data; schools data; and the Welsh Demographic Service (WDS).
The City and County of Swansea data relate to applications for assistance with housing related issues, made to the housing team based within the authority. Information needed to engage in data linkage is only collected from the main applicant for assistance. Furthermore, the data provided by the authority only relate to ‘adult’ homelessness i.e. people over the age of 16 years old, as younger applicants are assessed by the youth homelessness team within the authority. It was therefore necessary to use other administrative data sources, in this case the WDS, to identify children and young people living in households with a person who had applied for assistance from the housing team.
The WDS provides a history of residences at which people in Wales are registered as living. The WDS is created from address information when people register with their General Practitioner. Rather than being ‘households’, in the sense of a family unit, the WDS provides information about ‘residences’, which are usually postcode addresses. The WDS therefore enabled us to identify children and young people who were living in the same residence as someone who had made an application to the housing team for assistance. Additional methods were used in order to narrow down co-resident people to something approximating the ‘household’ (Exploratory analysis of education outcomes of children and young people living in homeless households).
The analysis contained in this output relates to children and young people in homeless households, rather than children and young people who have made a homeless application themselves. The impacts of homelessness on children and young people who directly apply to the housing team may be far more pronounced, given that they may entirely lack support networks outside of their families.
Once children and young people who were in households receiving support were identified, they were linked to their education data, specifically absence and exclusions data. Absenteeism data included the number of unauthorised, authorised, and total school sessions absent in an academic year. A session relates to a half day of school.
Data used in this analysis cover the academic years 2012/13 to 2015/16. The City and County of Swansea housing team data originally provided related to cases that had a closure date within the period of January 2011 to March 2017. A time period for observation was chosen that sat within the availale date range in order to minimise missing or ‘truncated’ periods of housing assistance. For example, children in households who applied for assistance in the 2016/17 accademic year may not have had a closure data, and would therefore be missing from the housing team data.
Data were limited to children attending schools within the Swansea Local Education Authority (LEA), which roughly conforms to the boundaries of the City and County of Swansea. Limiting the data to a specific geographical/reporting region meant that published education statistics could be used as a point of reference for data quality checks.
Children in households accessing housing support
The percentage of children living in households accessing the Swansea housing team is over 1% in all academic years from 2012 to 2016. Chart 1 shows the proportion of pupils aged between 5 and 16 years old (enrolled in schools in the Swansea local authority area) living in households accessing housing support from the Swansea housing team. There was a peak of over 1.4 % in the academic year 2013 to 2014, with the percentage dropping slightly to just over 1.2% in 2015 to 2016.
Free school meal eligibility can be used as a measure of socio-economic status. It helps us understand more about the population of children living in households with housing needs. During the academic years from 2012 to 2016, the number of children eligible for free school meals was higher in those living in households that accessed support from the Swansea housing team. See Chart 2.
Children living in households that required housing support also had higher levels of persistent absenteeism from school. During the academic years 2012 to 2016, between 12% and roughly 14% of pupils who were persistently absent from school were living in households that accessed the Swansea housing team. This dropped to 10% in 2015 to 2016. See Chart 3.
Housing need and school absenteeism
Levels of absenteeism varied by academic year in the study period with the average number of sessions absent for pupils in households accessing the housing team ranging from 29.7 to 35.3 and that for pupils in households not accessing the housing team ranging from 18.5 to 24.6. In order to gain a better understanding of the unique impacts of children living in households accessing the Swansea housing team, a series of ‘fixed’ and ‘random effect’ regression analyses were run on three outcomes of interest: unauthorised, authorised, and total session absent in an academic year. For further details of the analysis and methodology see Annex A.
The key findings from these analyses are as follows:
- pupils in households accessing the City and County of Swansea housing team had levels of total sessions absent 9% greater than those who were not accessing the housing team
- the difference in absence levels declined slightly when controlling for other demographic and socio-economic characteristics, to roughly 8%
- when a pupil entered a state of housing need, i.e. the household began accessing the housing team, this was associated with an 7% higher level of total sessions absent than before they accessed the housing team
- after controlling for a range of characteristics that change over time, such as free school meal eligibility, entering a state of housing need was associated with a 6% higher level of total sessions absent
Quality assurance
Checks were undertaken to ensure that once linked together, the education data were complete and in line with published figures. Student numbers for those enrolled in primary and secondary schools in the Swansea LEA, for each academic year, were generated and compared to published statistics from StatsWales. There were no major differences found between published and linked education data, being no more than 60 students either side of the published figures. Any differences could be accounted for by rounding in the published data and/or changes in the underlying education data since the figures were released on StatsWales.
As the analysis linked education records to other data sets, these further matches resulted in a reduction in student numbers, when compared to published figures The main area of difference relates to children in primary schools.
The increase in the difference between the derived/linked data and published figures were mainly due to the lack of a universal linking number (also known as an Anonymised Linkage Field, or ALF) for certain students. Without an ALF, data cannot be linked to other sources in the SAIL data bank, requiring their removal from further analysis. Additionally, a small number of students were removed when cleaning the data.
Annex A: detailed analysis and methodology
Attendance data are collected annually for each child enrolled in schools in Wales. In order to take advantage of the repeated observations of the same young people over time, panel regression methods were used. Both Random Effects (RE) and Fixed Effects (FE) models were used. FE regressions help explore within person variation in outcome variables associated with characteristics which change over time, in this case a household seeking assistance from the local authority housing team. RE regression models help to explore the characteristics that do not change over time, and therefore on between person variations in outcome variables, i.e. associations with gender. In FE models, such ‘time-invariant’ characteristics are included in the error for the model.
FE regression requires at least 2 observation points on the outcome of interest per person, in order to assess any change over time. Data used in FE regression analysis were therefore limited to those young people with at least 2-years of attendance data.
A benefit of FE regression models is that it leads to estimates of effects that are less biased by unobserved characteristics. Given the lack of detail within administrative data of important ‘subjective’ measures of a child’s engagement with school, there was a high risk that estimates based on other methods of panel regression would suffer such biases. The benefit of running RE regression models is that they enable analysis of the impacts of time invariant characteristics on outcomes, i.e. characteristics that do not change over time.
There were 3 main outcomes of interest in regression analysis: the number of authorised, unauthorised, and total sessions absent for each young person per academic year. The main predictive variable of interest was a yes/no indicator for whether the young person was living in a household that was accessing the City and County of Swansea housing team.
12 panel regressions were run in total: 6 regressions predicting the 3 main outcomes without any control variables using both FE and RE models; and 6 regressions including controls again adopting FE and RE models.
Characteristics that were controlled for were chosen based on their known association with absenteeism, including: age, school type (primary or secondary), free school meal eligibility, special education needs, being excluded within the year, and local area deprivation as measured by the Welsh Index of Multiple Deprivation.
All analysis was conducted in STATA v 16.1.
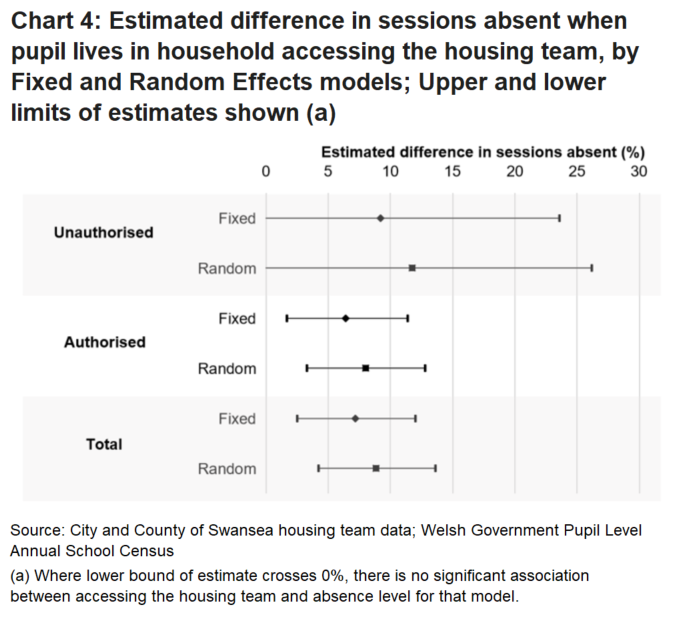
Chart 4 provides the estimated difference in the number of authorised, unauthorised, and total sessions absent for pupils in households accessing housing services, split by FE and RE. No additional pupil or area characteristics are controlled for in the regressions underpinning Chart 4.
As indicated by the RE model for total absences, being in a household accessing the Swansea housing team was associated with 9% greater number of total sessions absent than more stably housed counterparts.
In the FE model, when the household a child was living in began accessing the Swansea housing team, this was associated with a 7% increase in total sessions absent from school.
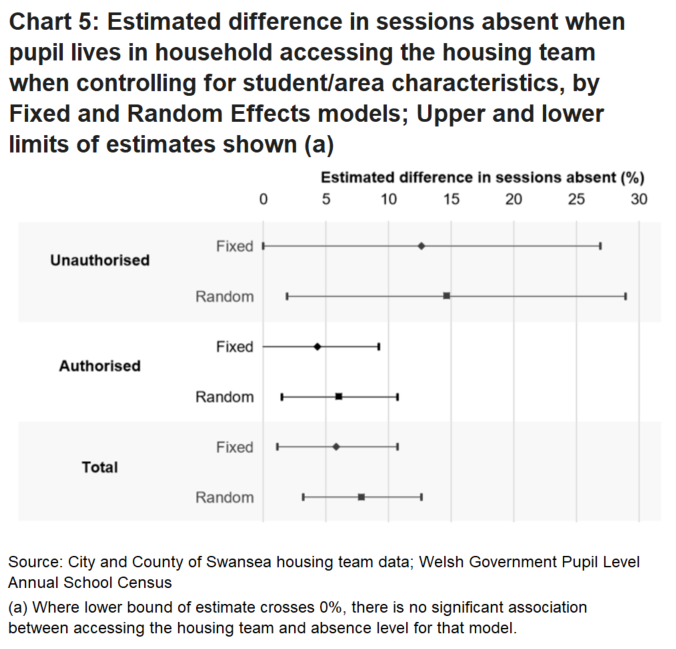
We ran the same FE and RE regressions predicting authorised, unauthorised, and total sessions absent, whilst controlling for several characteristics known to be associated with absenteeism. For clarity, Chart 5 focuses on the effects of living in a household that has accessed the Swansea housing team, full regression outputs can be found below (Table 1 and 2).
After controlling for pupil and area characteristics, the association between housing team support and numbers of sessions absent was reduced in magnitude. However, entering a state of housing need was still significantly associated with an increase in number of total sessions absent, by 6%.
As the outcomes of interest were count data (number of sessions absent in an academic year) a specific form of regression was used that is better suited to count data: Poisson regression. In the outputs from the Poisson regressions (Table 1 and 2) coefficients can be expressed as Incident Rate Ratios (IRRs) that are then interpreted as change in levels of absence associated with a 1 year increase in age, or having a specific characteristic, holding all other variables constant.
If a coefficient is equal to 1, then the characteristic has no effect on absence level. Where the coefficient is less than 1, this indicates that the characteristic is associated with a reduction in the level; the opposite being true when a coefficient is greater than 1. The extent of the change in level is a ‘multiplicative’ effect. For example if the regression coefficient when predicting total sessions absent was 1.5 for housing service use, this would mean that that the number of sessions absent for those receiving support from the housing team is 1.5 times, or 50% greater than for those children not needing support.
For ease of interpreting the Poisson regression outputs, Chart 4 and 5 are based on the IRR, and present the percentage difference in number of sessions absent when a child lives in a household that is accessing the City and County of Swansea housing team.
| Random effects | Fixed effects | |||
|---|---|---|---|---|
| Incidence rate ratio | Confidence intervals | Incidence rate ratio | Confidence intervals | |
| Total absent | 1.088 | (1.042-1.136) | 1.072 | (1.025-1.120) |
| Unauthorised | 1.117 | (0.989-1.262) | 1.092 | (0.964-1.236) |
| Authorised | 1.080 | (1.033-1.128) | 1.064 | (1.017-1.114) |
| Incidence rate Ratio | Confidence intervals | |
|---|---|---|
| Total absent: | ||
| Age | 0.942 | (0.937-0.946) |
| FSM eligible | 1.071 | (1.045-1.098) |
| Female | 1.065 | (1.042-1.088) |
| Non-white | 0.880 | (0.850-0.912) |
| SEN | 1.031 | (1.008-1.055) |
| Housing support | 1.078 | (1.032-1.126) |
| Secondary School | 0.872 | (0.852-0.892) |
| Excluded in year | 1.144 | (1.077-1.215) |
| 1st WIMD quartile (a) | 1.167 | (1.120-1.215) |
| 2nd WIMD quartile (a) | 1.132 | (1.085-1.180) |
| 3rd WIMD quartile (a) | 1.091 | (1.041-1.143) |
| Total unauthorised: | ||
| Age | 1.163 | (1.148-1.178) |
| FSM eligible | 1.084 | (1.015-1.158) |
| Female | 1.046 | (1.002-1.093) |
| Non-white | 1.174 | (1.101-1.252) |
| SEN | 1.048 | (0.981-1.120) |
| Housing support | 1.146 | (1.019-1.289) |
| Secondary School | 0.662 | (0.612-0.716) |
| Excluded in year | 1.170 | (1.034-1.323) |
| 1st WIMD quartile (a) | 1.276 | (1.132-1.438) |
| 2nd WIMD quartile (a) | 1.104 | (0.965-1.263) |
| 3rd WIMD quartile (a) | 1.109 | (0.971-1.267) |
| Total authorised: | ||
| Age | 0.898 | (0.894-0.903) |
| FSM eligible | 1.071 | (1.044-1.098) |
| Female | 1.070 | (1.046-1.096) |
| Non-white | 0.827 | (0.792-0.862) |
| SEN | 1.020 | (0.998-1.043) |
| Housing support | 1.060 | (1.015-1.107) |
| Secondary School | 0.933 | (0.912-0.955) |
| Excluded in year | 1.089 | (1.020-1.163) |
| 1st WIMD quartile (a) | 1.129 | (1.085-1.174) |
| 2nd WIMD quartile (a) | 1.131 | (1.087-1.177) |
| 3rd WIMD quartile (a) | 1.077 | (1.028-1.128) |
(a) Least deprived as reference.
| Incidence rate ratio | Confidence intervals | |
|---|---|---|
| Total absent: | ||
| Age | 0.920 | (0.915-0.925) |
| FSM eligible | 1.015 | (0.988-1.044) |
| Female | - | - |
| Non-white | - | - |
| SEN | 1.006 | (0.981-1.031) |
| Housing support | 1.058 | (1.011-1.107) |
| Secondary School | 0.859 | (0.839-0.880) |
| Excluded in year | 1.119 | (1.051-1.192) |
| 1st WIMD quartile (a) | 1.011 | (0.953-1.071) |
| 2nd WIMD quartile (a) | 1.013 | (0.956-1.074) |
| 3rd WIMD quartile (a) | 1.019 | (0.958-1.083) |
| Total unauthorised: | ||
| Age | 1.205 | (1.187-1.223) |
| FSM eligible | 1.021 | (0.949-1.098) |
| Female | - | - |
| Non-white | - | - |
| SEN | 1.001 | (0.933-1.075) |
| Housing support | 1.126 | (1.000-1.269) |
| Secondary School | 0.674 | (0.624-0.729) |
| Excluded in year | 1.120 | (0.986-1.271) |
| 1st WIMD quartile (a) | 1.027 | (0.865-1.219) |
| 2nd WIMD quartile (a) | 0.924 | (0.769-1.111) |
| 3rd WIMD quartile (a) | 0.983 | (0.827-1.168) |
| Total authorised: | ||
| Age | 0.865 | (0.860-0.870) |
| FSM eligible | 1.022 | (0.994-1.052) |
| Female | - | - |
| Non-white | - | - |
| SEN | 1.002 | (0.978-1.027) |
| Housing support | 1.043 | (0.997-1.092) |
| Secondary School | 0.915 | (0.894-0.937) |
| Excluded in year | 1.073 | (1.002-1.150) |
| 1st WIMD quartile (a) | 1.004 | (0.948-1.065) |
| 2nd WIMD quartile (a) | 1.032 | (0.975-1.093) |
| 3rd WIMD quartile (a) | 1.026 | (0.963-1.092) |
(a) Least deprived as reference.
Acknowledgements
This work has been carried out by Dr Ian Thomas and Dr Pete Mackie at WISERD, as part of Administrative Data Research (ADR) Wales housing and homelessness body of work.
ADR Wales is part of the Economic and Social Research Council (part of UK Research and Innovation) funded ADR UK.
Contact details
Statistician: Matthew Davies
Telephone: 03000255533
Email: adruwales@gov.wales
Media: 0300 025 8099
Social research number: 27/2021
Digital ISBN: 978-1-80195-057-2