Data showing the short term movements in the output of industries in the production, construction and market services sectors for July to September 2020.
This is not the latest release in the series: Short-term output indicators
Impact of coronavirus
The data for this period covers the coronavirus pandemic. Potential impacts as a result of this are discussed throughout the release.
Estimates for Wales are typically more volatile than the UK, and as a result comparison between the two should be made with caution, especially over the shorter term.
Main points
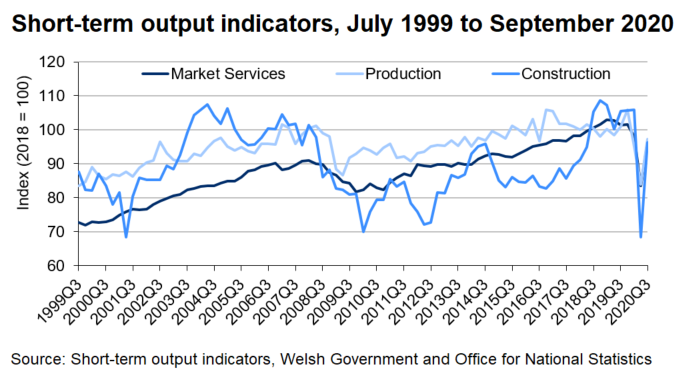
These estimates cover July to September 2020 which was during the coronavirus (COVID-19) pandemic. Annual estimates are also included which relate to six months prior to, and six months of the pandemic period. Care should be taken when interpreting these indices – estimates for individual quarters can fluctuate and it is recommended that emphasis is based on longer term trends.
Index of Market Services
- Compared to the previous quarter, the index of market services increased by 15.4% in Wales and by 15.1% in the UK.
- The increase in Wales was largely accounted for by increases in Accommodation and Food Service Activities and Distribution.
- The longer-term trends show a 7.2% decrease for both Wales and the UK in the year to September 2020, compared with the previous twelve months. These are the largest year-on-year decreases since the series began in 1998.
- In Wales, eight of the nine Market Service industry indices decreased on an annual basis.
Index of Production
- The Index of Production for Wales shows a 15.9% increase when compared to the previous quarter. UK output increased by 14.7% over the same period. The increase in Wales was largely accounted for by Transport Equipment and Electricity, Gas and Water Supply.
- The longer-term trend for Wales shows a 4.0% decrease in the year to September 2020 on an annual basis. UK output decreased by 7.8% over the same period.
Index of Construction
- The Index of Construction for Wales shows a 40.5% increase when comparing the latest quarter to the previous quarter. UK output increased by 41.2% over the same period.
- The longer-term trend for Wales shows a 10.7% decrease in the year to September 2020 on an annual basis. UK output decreased by 11.9% over the same period.
Note
The full series has also been reweighted based on 2018 GVA weights (previously 2016 weights). While this has resulted in a shift across most industries, there has been no large impact on growth rates.
Reports
Short-term output indicators: July to September 2020 , file type: PDF, file size: 1 MB
Datasets and interactive tools
Contact
Melanie Brown
Telephone: 0300 061 6029
Email: economic.stats@gov.wales
Rydym yn croesawu galwadau a gohebiaeth yn Gymraeg / We welcome calls and correspondence in Welsh.
Media
Telephone: 0300 025 8099
Rydym yn croesawu galwadau yn Gymraeg / We welcome calls in Welsh.