NHS activity and capacity during the coronavirus (COVID-19) pandemic: 3 September 2020
Data on coronavirus and NHS activity and capacity up to 3 September 2020.
This file may not be fully accessible.
In this page
1. Hospital activity and capacity
The data are taken from management information and are subject to change. They have not been subject to the same validation processes undertaken for official statistics. However, they are provided to support transparency and understanding of NHS activity at this time. Where available, the official statistics should continue to be considered the authoritative source of data. Please see the Chief Statistician’s blog for more information on reporting management information, data quality and transparency.
Following further validation, data prior to 1 April 2020 for admissions, hospitalisations and beds use were decided to not be suitable for publication. Therefore, the time series begins 1 April 2020.
Hospital activity and capacity figures include data for acute hospitals from 1 April 2020, field hospitals from 20 April 2020, community hospitals from 23 April 2020 and mental health units from 10 July 2020. Data from mental health units were included retroactively from 10 July for the first time in the release on 20 August 2020. Including mental health beds had a small impact on COVID-19 patients’ figures but a large impact on all hospitalisation figures, as the majority of mental health patients are not COVID-19 patients.
Please see the UK Government COVID-19 dashboard for information on healthcare at a UK level. Note: the healthcare data presented in the UK dashboard differ from this publication. The UK dashboard includes data for acute hospitals only, to enable better comparability with other countries, whereas this publication includes data from acute, community, field hospitals and mental health units.
Estimates of the number of people who’ve had coronavirus in England and Wales are also published by the ONS in their Coronavirus (COVID-19) Infection Survey.
Please note that health care surveillance data presented in the Public Health Wales dashboard differ from this publication. The PHW dashboard uses data systematically collected through ICNET, the hospital infection control data system used across Wales. It includes hospital in-patients with a laboratory confirmed result and does not count any patients who were admitted and discharged on the same day. The Welsh Government publication uses data sourced from daily management information provided by health boards. Guidance was issued to local health boards for completion and submission of the data return. However, data collection methods may vary from health board to health board. It includes COVID-19 related patients as suspected, confirmed and recovering, as well as non-COVID-19 patients. The narrower definition used by PHW will likely result in smaller numbers of reported COVID-related admissions compared to the Welsh Government publication, but provides a systematic way of carrying out surveillance of patients requiring hospital stays with confirmed COVID-19.
Accompanying tables for this release are available, including all the data shown below and also data concerning general and acute beds, 111 and NHS Direct calls, NHS staff absence, and emergency ambulance calls.
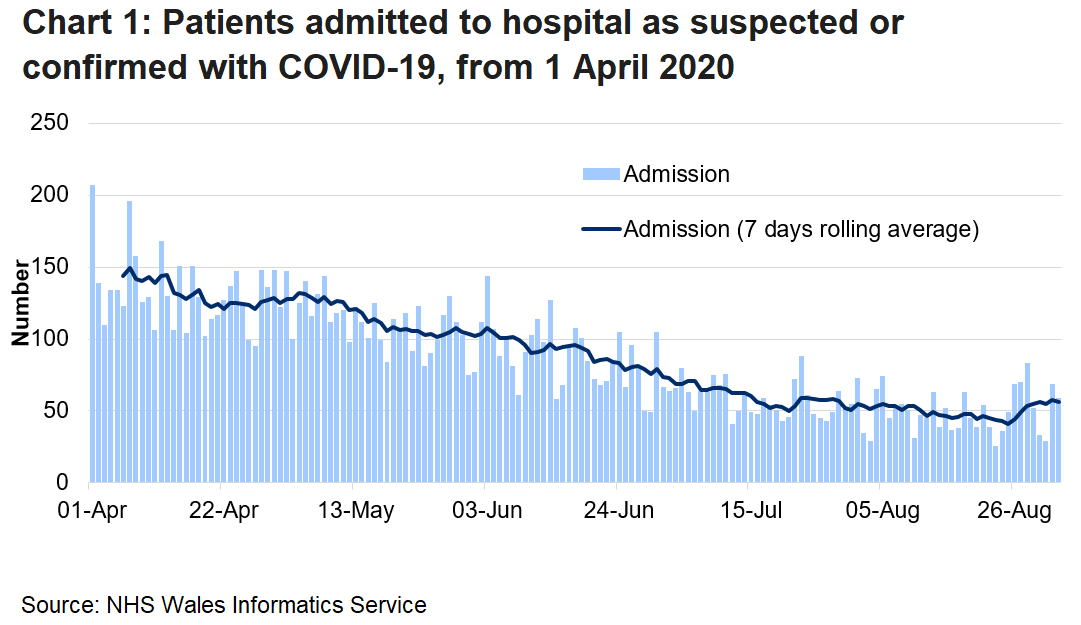
Patients admitted to hospital as suspected or confirmed with COVID-19, from 1 April 2020 (MS Excel)
Following the reintroduction of elective procedures from June, patients suspected with COVID-19 were included in the numbers of COVID-19 suspected at the census time, even if they later received a negative test whilst in hospital. From 29 June, patients admitted for elective procedures have been excluded from COVID-19 admissions because including these were inflating the number of suspected cases in hospital at the time of reporting. If patients then received a positive test result whilst in hospital, they would be included in the covid-19 patient related figures. The health boards have also been asked to not report transfers between hospitals as a separate admission and discharge.
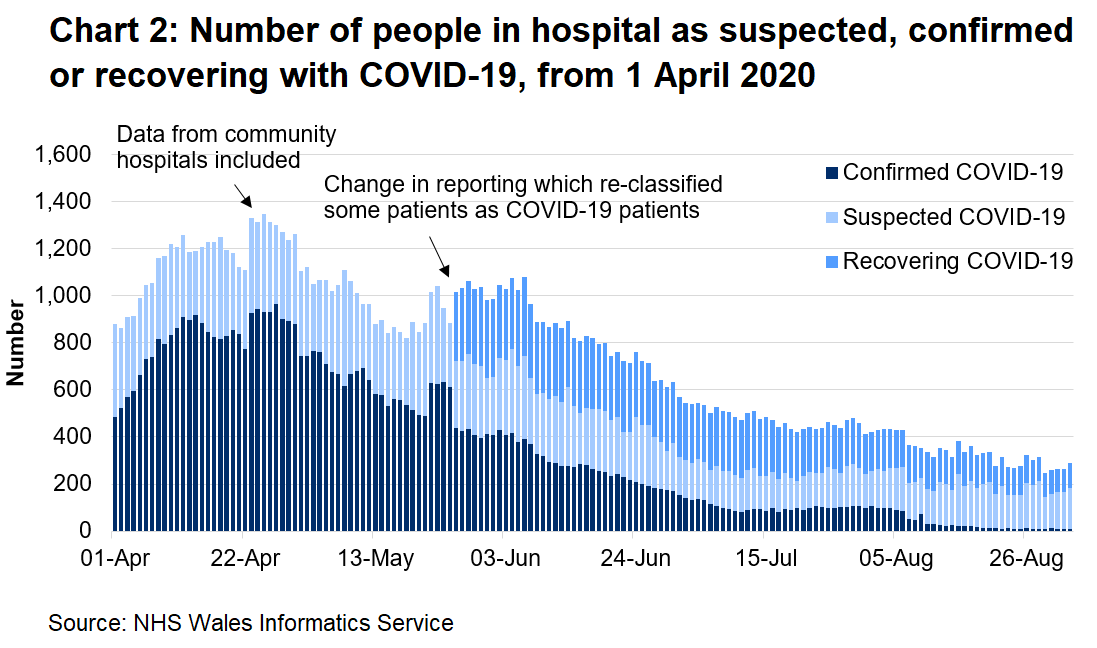
Recovering patients are COVID-19 positive patients who had been in hospital for 14+ days with no signs and symptoms, but remain in hospital on a COVID treatment pathway, often for rehabilitation. Health boards were asked to make the change to include these patients from the 26 May 2020. One health board made the change early on 22 May, including the recovering COVID-19 patients in the confirmed category until 25 May. One health board made the change on 8 June.
Please see the Chief Statistician’s blog for more information on reporting on recovering patients.
Between 1 May and 22 May, one health board classified post-14 days COVID-19 patients as non-COVID-19 patients. On 22 May, these patients were re-categorised as COVID-19 patients following the guidance around reporting recovering patients.
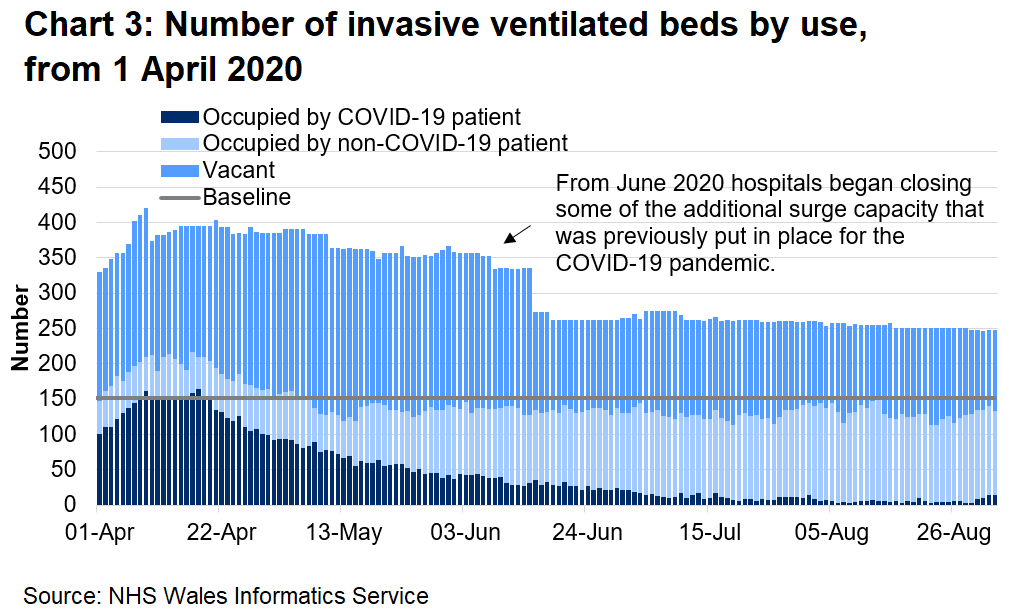
Number of invasive ventilated beds by use, from 1 April 2020 (MS Excel)
Baseline relates to the number of beds that were available prior to the COVID-19 pandemic. There are usually 152 critical care beds available. Invasive ventilated beds include beds in and outside a critical care setting, and include surge capacity. COVID-19 patients in this chart include suspected, confirmed, and recovering COVID-19 patients.
From June 2020 hospitals began closing some of the additional surge capacity that was previously put in place for the COVID-19 pandemic.
2. A&E attendances
The data are taken from management information and are subject to change. They have not been not been subject to the same validation processes undertaken for official statistics releases. Please see the Chief Statistician’s blog for more information on reporting management information, data quality and transparency.
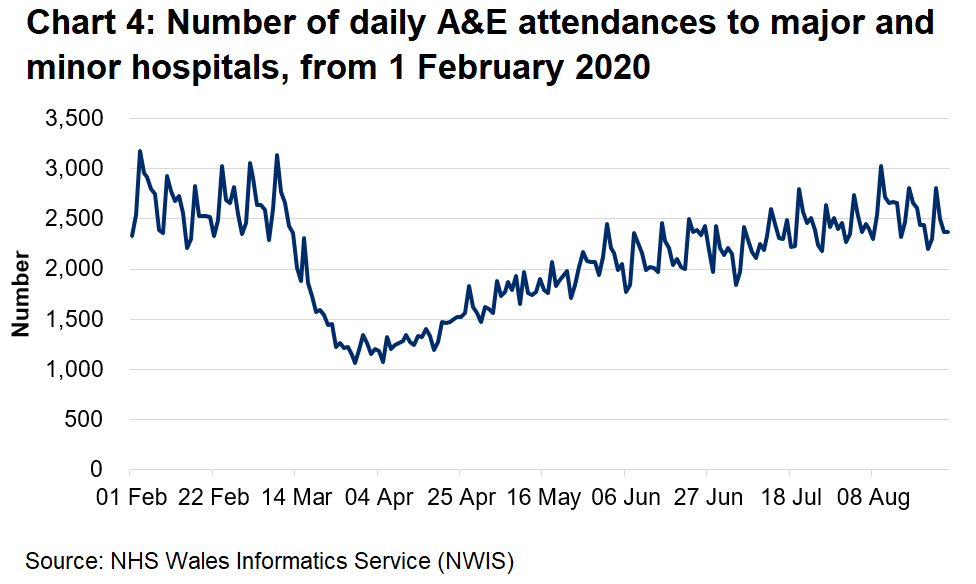
Number of daily A&E attendances to major and minor hospitals, from 1 February 2020 (MS Excel)
A&E attendances to major and minor hospitals, from all modes of transport across Wales. Some small minor A&E units are not able to submit daily data, therefore there is probably a small undercount in total attendance.
3. Quality and methodology information
The data are taken from management information and are subject to change. They have not been not been subject to the same validation processes undertaken for official statistics releases. However, they are provided to support transparency and understanding of NHS activity at this time. The official statistics should continue to be considered the authoritative source of data.
Historic data may have been revised and therefore may not be identical to that previously published.
Well-being of Future Generations Act (WFG)
The Well-being of Future Generations Act 2015 is about improving the social, economic, environmental and cultural wellbeing of Wales. The Act puts in place seven wellbeing goals for Wales. These are for a more equal, prosperous, resilient, healthier and globally responsible Wales, with cohesive communities and a vibrant culture and thriving Welsh language. Under section (10)(1) of the Act, the Welsh Ministers must (a) publish indicators (“national indicators”) that must be applied for the purpose of measuring progress towards the achievement of the wellbeing goals, and (b) lay a copy of the national indicators before the National Assembly. The 46 national indicators were laid in March 2016.
Information on the indicators, along with narratives for each of the wellbeing goals and associated technical information is available in the Well-being of Wales report.
Further information on the Well-being of Future Generations (Wales) Act 2015.
The statistics included in this release could also provide supporting narrative to the national indicators and be used by public services boards in relation to their local well-being assessments and local wellbeing plans.
4. Contact details
Statistician: Rachel Dolman
Telephone: 0300 025 1612
Email: stats.healthinfo@gov.wales
Media: 0300 025 8099
SFR 132/2020