Levels of highest qualification held by working age adults: 2021
Presents statistics on the highest qualification held by adults of working age in Wales for 2021.
In this page
Introduction
Data in this publication relate to the 2021 calendar year, during the coronavirus (COVID-19) pandemic. Examination and assessment arrangements, and therefore the awarding of some qualifications from Summer 2020 onwards, were affected by the pandemic. The statistics presented here cover working age adults aged 18 to 64, many of whom may not have been working towards achieving qualifications during the pandemic. Any impact is likely to be greater for younger age groups.
Main results
3 May 2022: This section previously incorrectly stated that the increase in the proportion of working age adults with no qualifications seen in 2021 was the first increase since 2008. The proportion in fact also increased in 2015. This also applies to the decrease in the proportion holding at least level 2 qualifications.
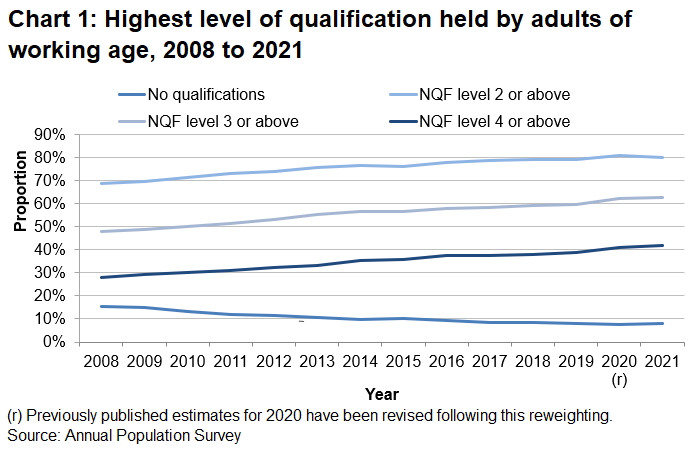
- An estimated 8.1% of working age adults in Wales reported having no qualifications compared with 7.4% (r) in 2020.
- 80.1% of working age adults in Wales held at least level 2 qualifications compared with 80.9% in 2020.
- 62.5% of working age adults in Wales held at least level 3 qualifications compared with 62.2% (r) in 2020.
- The proportion holding higher education or equivalent level qualifications (NQF level 4 or above) was 41.6% compared with 41.1% (r) in 2020.
(r) Previously published estimates for 2020 have been revised following this reweighting.
Highest qualification levels of working age adults by year and qualification (StatsWales)
This release contains data for one of the national wellbeing indicators (8: percentage of adults with qualifications at the different levels of the National Qualifications Framework).
There are two national milestones associated with this national indicator, one of which is ‘75% of working age adults in Wales will be qualified to level 3 or higher by 2050’. 62.5% of working age adults in Wales were qualified to level 3 or higher in 2021.
Further information on the national indicators, national milestones and the Well-being of Future Generations Act is provided towards the end of this release. Analysis related to the second national milestone (‘the percentage of working age adults with no qualifications will be 5% or below in every local authority in Wales by 2050’) is included in the section on geography.
Level of highest qualification held, by characteristic
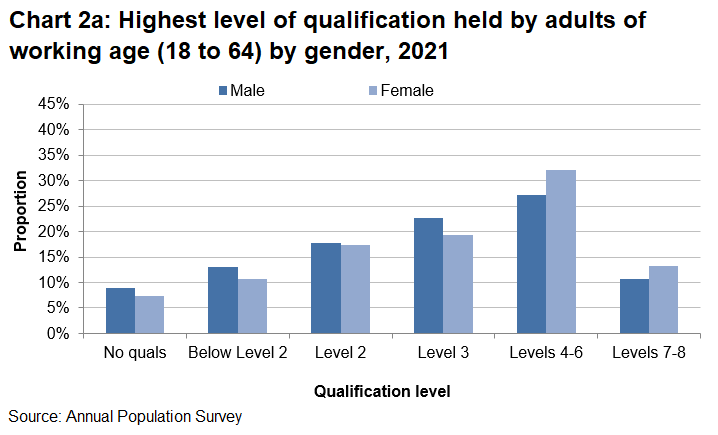
Sex and age
Overall, an estimated 8.9% of males held no qualifications in 2021 compared with 7.3% of females. There are higher proportions of males than females with no qualifications in all age groups, with the exception of 50 to 59 year olds. Females are more likely to hold qualifications at or above level 4.
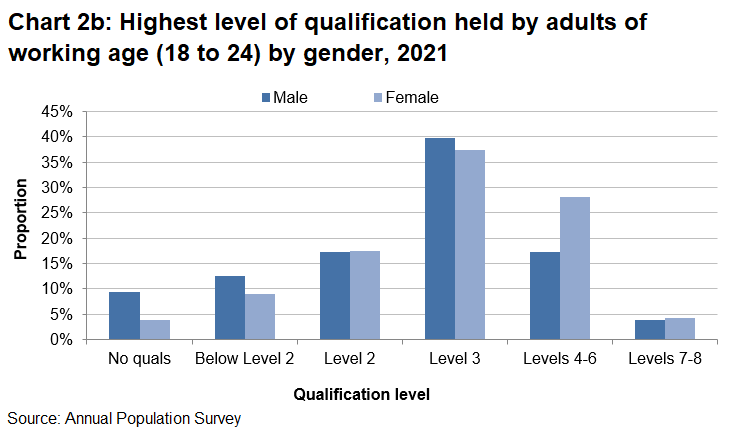
The increase in the proportion working age adults with no qualifications, and the corresponding decrease in the proportion holding at least level 2 qualifications, is largely driven by the 18 to 24 age group. This group saw a 4.9 percentage point decrease in the proportion holding at least level 2 qualifications compared with 2020.
The proportion of adults with qualifications broadly decreases as age increases, though a higher proportion of 25 to 34 year olds held at least level 2 qualifications (85.2%) compared with 18 to 24 year olds (82.4%) in 2021. 72.1% of 60 to 64 year olds held at least level 2 qualifications.
The qualification profile is shown for all ages alongside that for those aged 18 to 24 and 60 to 64.

Highest qualification levels of working age adults by gender, age and qualification (StatsWales)
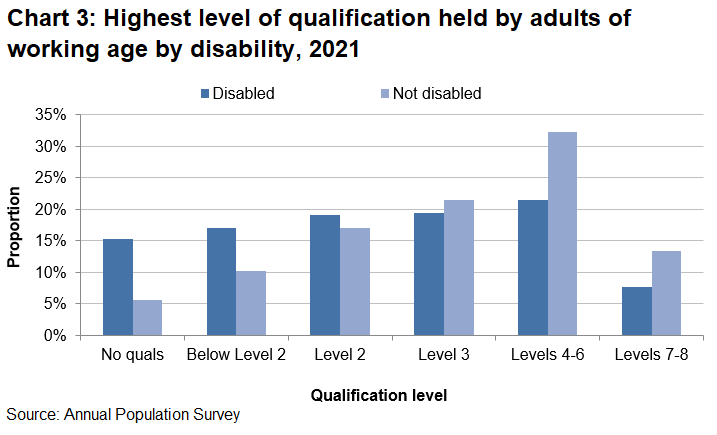
Disability
Disabled people (15.3%) are more likely to have no qualifications than non-disabled people (5.7%) and are less likely to hold qualifications above level 2.
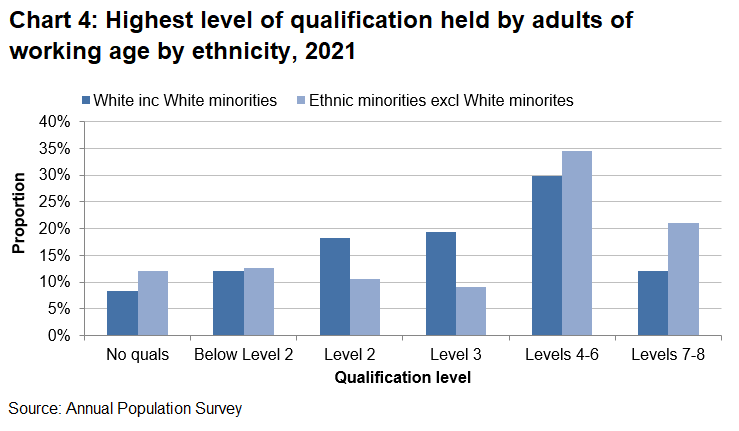
Ethnicity
Working age adults from ethnic minorities (excluding White minorities) are more likely to hold higher level qualifications than White (including White minorities) working age adults but are also more likely to have no qualifications.
Welsh language
Higher qualification levels are reported amongst Welsh speakers than their non-Welsh speaking counterparts. The proportion of non-Welsh speakers with no qualifications was 9.9% compared with 2.9% of Welsh speakers.
Geography
The proportion of working age adults with higher education level or equivalent qualifications (Level 4+) was highest in Monmouthshire (56.8%), Ceredigion (54.1%), and the Vale of Glamorgan (52.7%). This proportion was lowest in Blaenau Gwent (28.9%).
The proportion of working age adults with no qualifications was highest in Merthyr Tydfil (20.1%) and Blaenau Gwent (15.3%) and lowest in Ceredigion (2.8%) and Monmouthshire (3.0%).
The second national milestone associated with the national indicator included in this release is ‘the percentage of working age adults with no qualifications will be 5% or below in every local authority in Wales by 2050’. There are currently three local authorities where the percentage of working age adults with no qualifications is below 5%, Ceredigion, Monmouthshire and the Vale of Glamorgan.
Further information on the national indicators, national milestones and the Well-being of Future Generations Act is provided towards the end of this release.
Qualification levels in Wales were lower than in England, Scotland and the UK as a whole but were higher than some English regions. The proportion of working age adults qualified to level 2 and above and level 3 and above is similar to Northern Ireland. Wales has a lower proportion of working age adults with no qualifications, but also a lower proportion of working age adults qualified to level 4 and above, compared to Northern Ireland.
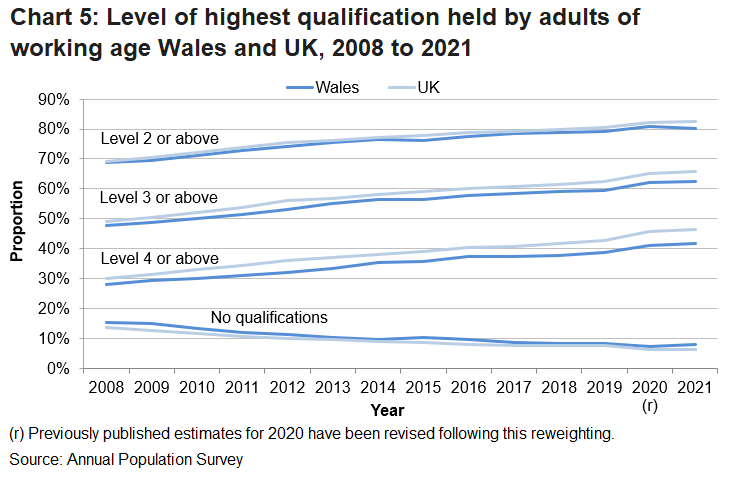
The proportion of working age adults with no qualifications in Wales was 1.8 percentage points higher than the UK in 2021. This gap increased from 1.3 (r) percentage points in 2020.
There were also changes in the gap between Wales and the UK at the different qualification levels between 2020 and 2021 (UK higher than Wales in each case). In 2021, the gap between Wales and the UK increased at level 2 or above by 1.1 percentage points (to stand at 2.6 percentage points), level 3 or above by 0.2 percentage points (to stand at 3.1 percentage points) and level 4 or above by 0.2 percentage points (to stand at 4.8 percentage points).
(r) Previously published estimates for 2020 have been revised following this reweighting.
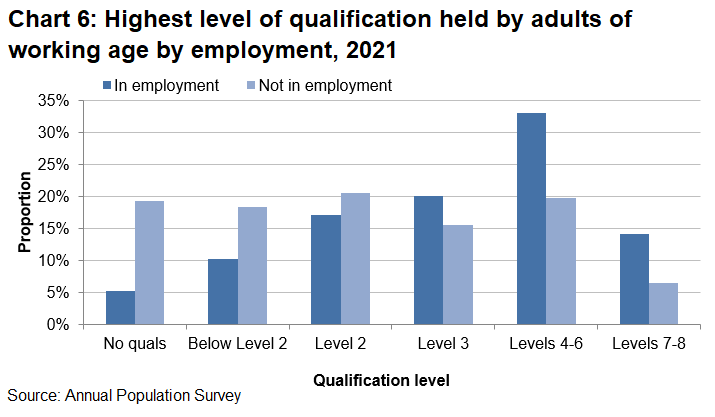
Employment status
In 2021, 19.3% of those who are either unemployed or economically inactive reported having no qualifications. This compares to 5.3% for those in employment (excluding those who are in full-time education).
Occupation
Persons employed in professional occupations are more likely to be qualified to at least level 2 than those in other jobs. In 2021, 97.3% of persons in professional occupations were qualified at this level.
Notes
Policy and operational context
This statistical release presents the annual snapshot of qualification levels of the working age population in Wales.
The statistics are used within the Welsh Government to monitor trends in qualification levels. This release contains data for one of the 46 national well-being indicators (8: percentage of adults with qualifications at the different levels of the National Qualifications Framework) and two related national milestones.
These statistics, along with the national indicator and national milestones are specifically included within Stronger, fairer, greener Wales: a plan for employability and skills.
Background to the Labour Force Survey and Annual Population Survey (APS)
The data presented in this release are based on the results of the Annual Population Survey (APS) for 2021. Data from the Annual Population Survey, a household survey carried out by the Office for National Statistics (ONS) is available from 2004, and prior to this comparable data are available from the annual Local Labour Force Survey for Wales for 2001 to 2003.
Data in this release are presented for working age adults aged 18 to 64 according to their age at the start of the academic year. Between April 2010 and November 2018, the state pension age for women gradually increased from 60 to 65. Accordingly, the series has been amended to a working age definition of 18 to 64 for both males and females, rather than its earlier definition of 18 to 64 for males and 18 to 59 for females.
Estimates on the new basis are only available from 2008 onwards and figures within this release are therefore not directly comparable with those based on the previously used definition.
Headline figures on the previous working age definition (18 to 59/64) are available on StatsWales.
In August 2021 the Office for National Statistics (ONS) recalibrated the weights of Annual Population Survey datasets from January 2020 onwards. The population data used to produce labour market estimates were updated to better reflect changes in international migration and other impacts as a result of the coronavirus (COVID-19) pandemic. The changes ONS have made to the weighting should reduce the bias of estimates at high levels of aggregation. Some smaller breakdowns may be impacted negatively and more extreme changes could be seen given the reduced size of the underlying sample since the start of the pandemic.
Previously published estimates for 2020 have been revised following this reweighting.
Definitions
Ethnicity
For the analysis of qualifications by ethnicity, people in full-time education have been excluded. This change has been made to remove the impact of international students who attend higher education in Wales and thus inflate the proportion with Level 3+ qualifications.
Disability
The Welsh Government accepts the social definition of disability, in which it is recognised that barriers in society act to disable people who have impairments or health conditions or who use British Sign Language.
The Annual Population Survey, which is the source of data for this release, captures data using the medical definition of disability used in the Equality Act 2010 (“a physical or mental impairment which has a substantial and long-term impact on a person’s ability to carry out normal day to day activities”). Figures within this release are not comparable to those within releases prior to 2015, which reported those reporting DDA current disability or work-limiting disability.
Qualifications used in the Labour Force Survey and their National Qualification Framework for England, Wales and Northern Ireland (NQF EWNI) levels
At Annex 1 is a list of the qualifications specifically included in the Labour Force Survey questionnaire and provides details of the NQF EWNI level to which they have been assigned for the purposes of statistical analysis.
Data have previously been presented as NVQ equivalencies. The NQF EWNI has nine levels; Entry Level followed by Level 1 to Level 8. In Wales the NQF EWNI forms part of the Credit and Qualifications Framework for Wales; a meta framework which also includes all Higher-Level learning within the University Sector and Quality Assured Lifelong Learning.
Further information about the Credit and Qualifications Framework for Wales.
Please note the Scottish Credit and Qualifications Framework has different levels.
Quality information
Relevance
Users of these statistics include:
- ministers and Welsh Government officials
- members of the Senedd and researchers in the Senedd
- other government departments
- students, academics and universities
Accuracy
As the data come from a survey, the results are sample-based estimates and are therefore subject to differing degrees of sampling variability, i.e. the true value for any measure lies in a differing range about the estimated value. This range or sampling variability increases as the detail in the data increases; for example local authority data are subject to higher variability than regional data.
Previously published estimates for 2020 have been revised following the reweighting of the Annual Population Survey.
Proxy response
If the respondent is not available at the time of interview, questions may be answered by proxy through another member of the household. For information on highest qualifications, around 62% of responses have been derived from a respondent's own answers. 26% were obtained from a spouse or partner whilst 12% were obtained from another proxy.
Section 11 of the Labour Force Survey: user guidance (Office for National Statistics) Volume 1, 2011 presents findings from a follow up study to test the accuracy of results from proxy respondents.
The results for highest type of qualification held show nearly two thirds matching with significant net error from proxies understating qualifications. However, there was wide variation in the standard of proxy response. This variation is both in terms of the relationship of the proxy to the subject (parents were much better than spouses or children) and by the level and type of qualifications held. Reporting was much better for those subjects holding degrees (80% matched) than for those holding lower or vocational qualifications (30% matched).
Non-response
Information on highest qualification is derived from several questions in the survey. Overall, the highest qualification was unknown or unable to be derived for 3% of respondents. These respondents have been excluded from the analysis in this release.
Allocation of qualifications with unknown levels
Whilst other questions in the survey are used to allocate qualifications to NQF levels as far as possible, for some categories the respondents are distributed into levels using proportions that have been fixed for many years. This is currently true for 'Other' qualifications, Trade Apprenticeships, Scottish CSYS qualifications and SCE Highers or equivalent. ‘Other’ qualifications are apportioned across NQF levels Below Level 2, Level 2 and Level 3 in the ratio 55:35:10; Trade apprenticeships are apportioned across Level 2 and Level 3 in the ratio 50:50 and Scottish CSYS qualifications are apportioned across Level 2 and Level 3 in the ratio 33:67. This is a long-standing calculation based on detailed analysis of qualifications from the General Household Survey. SCE Highers are apportioned across Level 2 and Level 3 in the ratio 37:63 based on data from previous years.
Timeliness and punctuality
This statistical release is published annually in April and covers the preceding year ending 31 December.
Accessibility and clarity
This statistical release is pre-announced and then published on the Statistics and Research website of the Welsh Government. All underlying data for this release as well as other years are available on StatsWales.
Comparability and coherence
The figures may differ to those published from statistical publications by other government departments due to a slight difference in source and/or methodologies for deriving levels of qualifications. Also, other tables may be based on all persons of working age (16 to 64) whilst this release is restricted to those aged 18 to 64 (adults of working age).
The UK Department for Education have developed an enhanced method of producing qualification estimates from the LFS, including the use of administrative records to improve the quality of the attainment data recorded on the LFS and imputation of qualification levels for those with unknown qualifications. Details can be found on the archive Data Service website.
Data is also available from the Census of Population on highest qualification levels. The 2011 census indicated that one in four of the population of Wales aged 16 and over (26%, 651,000) reported having no recognised qualifications and just under one in four of the population of Wales aged 16 and over (24%, 614,000) reported having a qualification at level 4 (degree level) or above. The difference between the level of qualifications reported through the Census and the APS data in this release is in part explained by the wider age range of the Census data. That is both including 16 and 17 year olds who may not yet have completed their education, and the older age groups. Additional factors to consider are the APS asks more detailed questions about qualifications than the Census. In addition the APS is an interviewer-administered survey whereas the Census is self-completed. Therefore the interviewer can probe the respondent with further questions to try to establish whether details have been recalled correctly. However, the APS is a sample survey whereas the Census is a more comprehensive count. Similar issues applied to the 2001 Census.
The biggest benefit of the Census data is to be able to analyse within local authority, down to community level, and in cross tabulations with small subgroups of the population not possible through the APS.
National Statistics status
The United Kingdom Statistics Authority has designated these statistics as National Statistics, in accordance with the Statistics and Registration Service Act 2007 and signifying compliance with the Code of Practice for Statistics.
National Statistics status means that our statistics meet the highest standards of trustworthiness, quality and public value, and it is our responsibility to maintain compliance with these standards.
All official statistics should comply with all aspects of the Code of Practice for Statistics. They are awarded National Statistics status following an assessment by the UK Statistics Authority’s regulatory arm. The Authority considers whether the statistics meet the highest standards of Code compliance, including the value they add to public decisions and debate.
If we become concerned about whether these statistics are still meeting the appropriate standards, we will discuss any concerns with the Authority promptly. National Statistics status can be removed at any point when the highest standards are not maintained and reinstated when standards are restored.
These statistics last underwent a full assessment against the Code of Practice in 2011. Since the latest review by the Office for Statistics Regulation, we have continued to comply with the Code of Practice for Statistics, and have made the following improvements:
- brought forward the annual publication timetable to a full release of data in April
- made more underlying data available through StatsWales
- publish to the new adults of working age population definition (18 to 64) but continue to make the longer time series of data available on the old definition (18 to 59/64) through StatsWales.
Well-being of Future Generations Act (WFG)
The Well-being of Future Generations Act 2015 is about improving the social, economic, environmental and cultural wellbeing of Wales. The Act puts in place seven wellbeing goals for Wales. These are for a more equal, prosperous, resilient, healthier and globally responsible Wales, with cohesive communities and a vibrant culture and thriving Welsh language. Under section (10)(1) of the Act, the Welsh Ministers must (a) publish indicators (“national indicators”) that must be applied for the purpose of measuring progress towards the achievement of the wellbeing goals, and (b) lay a copy of the national indicators before Senedd Cymru. Under section 10(8) of the Well-being of Future Generations Act, where the Welsh Ministers revise the national indicators, they must as soon as reasonably practicable (a) publish the indicators as revised and (b) lay a copy of them before the Senedd. These national indicators were laid before the Senedd in 2021. The indicators laid on 14 December 2021 replace the set laid on 16 March 2016 and this release includes one of the national indicators namely:
- (8) Percentage of adults with qualifications at the different levels of the National Qualifications Framework.
Information on the indicators, along with narratives for each of the well-being goals and associated technical information is available in the Wellbeing of Wales report.
As a national indicator under the Act they must be referred to in the analyses of local wellbeing produced by public services boards when they are analysing the state of economic, social, environmental and cultural wellbeing in their areas.
The Act states national milestones must be set that “…the Welsh Ministers consider would assist in measuring whether progress is being made towards the achievement of the wellbeing goals.” In doing so Welsh Ministers must specify how we know that a national milestone has been achieved and the time by which it is to be achieved.
National milestones are not performance targets for any individual organisation, but are collective measures of success for Wales.
In this release indicator 8: percentage of adults with qualifications at the different levels of the National Qualifications Framework corresponds to two milestones:
- 75% of working age adults in Wales will be qualified to level 3 or higher by 2050
- the percentage of working age adults with no qualifications will be 5% or below in every local authority in Wales by 2050
Further information on the Well-being of Future Generations (Wales) Act 2015.
The statistics included in this release could also provide supporting narrative to the national indicators and be used by public services boards in relation to their local well-being assessments and local well-being plans.
We want your feedback
We welcome any feedback on any aspect of these statistics which can be provided by email to post16ed.stats@gov.wales.
Annex 1
Qualifications used in the Labour Force Survey and their National Qualification Framework for England, Wales and Northern Ireland (NQF EWNI) levels
NQF Levels 7 to 8 (previously NVQ level 5 or equivalent)
Higher degree
NVQ level 5
Level 8 Diploma [footnote 3]
Level 8 Certificate [footnote 3]
Level 7 Diploma [footnote 3]
Level 7 Certificate [footnote 3]
Level 8 Award [footnote 3]
NQF Levels 4 to 6 (previously NVQ level 4 or equivalent)
First degree/Foundation degree
Other degree
NVQ level 4
Level 6 Diploma [footnote 3]
Level 6 Certificate [footnote 3]
Level 7 Award [footnote 3]
Diploma in higher education
Level 5 Diploma [footnote 3]
Level 5 Certificate [footnote 3]
Level 6 Award [footnote 3]
HNC, HND, BTEC higher etc.
Teaching (further, secondary and primary education, foundation stage¹ and level not stated)
Nursing etc.
RSA higher diploma
Other higher education qualification below degree level
Level 4 Diploma [footnote 3]
Level 4 Certificate [footnote 3]
NQF Level 3 (previously NVQ level 3 or equivalent)
Level 5 award [footnote 3]
NVQ level 3
Advanced/Progression (14 to 19) Diploma [footnote 3]
Level 3 Diploma [footnote 3]
Advanced Welsh Baccalaureate [footnote 1]
International Baccalaureate [footnote 1]
Scottish Baccalaureate [footnote 4]
GNVQ/GSVQ Advanced
2+ A levels, 4+ AS levels or equivalent
RSA advanced diploma
OND, ONC, BTEC, SCOTVEC national etc.
City and Guilds advanced craft/Part 1
Scottish 6 Year Certificate/CSYS (67%)
3 or more SCE higher or equivalent
Access to HE qualifications [footnote 1]
Trade apprenticeship (50%)
Other qualifications (10%)
Level 3 Certificate [footnote 3]
NQF Level 2 (previously NVQ level 2 or equivalent)
Level 4 Award [footnote 3]
NVQ level 2
Intermediate Welsh Baccalaureate [footnote 1]
1 A level, or 2/3 AS levels, or equivalent
Trade apprenticeship (50%)
GNVQ/GSVQ intermediate
RSA diploma
City and Guilds craft/Part 2
BTEC, SCOTVEC first or general diploma
Higher (14 to 19) Diploma [footnote 3]
Level 2 Diploma [footnote 3]
5+ O levels, GCSE grade A*-C, CSE grade 1 or equivalent
Scottish 6 Year Certificate CSYS (33%)
1 or 2 SCE higher or equivalent
Other qualifications (35%)
Level 2 Certificate [footnote 3]
Scottish National Level 5 [footnote 4]
Level 3 Award [footnote 3]
Below NQF Level 2 (previously NVQ level 1 or equivalent)
NVQ level 1
Foundation Welsh Baccalaureate [footnote 2]
GNVQ, GSVQ foundation level
Foundation (14 to 19) diploma [footnote 1]
Level 1 Diploma [footnote 3]
Scottish National Level 4 [footnote 4]
Up to 4 O levels, GCSE grade A*-C, CSE grade 1 or equivalent
GCSE below grade C, CSE below grade 1
BTEC, SCOTVEC first or general certificate
SCOTVEC modules
RSA other
Scottish Nationals Level 3 [footnote 4]
Scottish Nationals below Level 3 [footnote 4]
City and Guilds foundation/part 1
Level 1 Certificate
Level 2 Award
YT, YTP certificate
Key skills qualification [footnote 1]
Basic skills qualification [footnote 1]
Entry level qualification [footnote 1]
Entry level Diploma [footnote 3]
Entry level Certificate [footnote 3]
Level 1 Award [footnote 3]
Entry level award
Other qualifications (55%)
The percentages in brackets denote that a qualification is split across levels when calculating the number of persons with that qualification. This is done for those qualifications where the LFS does not collect sufficient information to allow a more accurate breakdown of the qualification.
Footnotes
[1] These qualifications were added to the list included on the LFS questionnaire in either 2004 or 2005. This slightly improved the estimates, as they may previously have been incorporated in “Other qualifications” or left out altogether by a respondent.
[2] This qualification was added to the list included on the LFS questionnaire in 2008.
[3] This qualification was added to the list included on the LFS questionnaire in 2011.
[4] This qualification was added to the list included on the LFS questionnaire in 2015
Contact details
Statistician: Jonathan Ackland
Telephone: 0300 025 8067
Email: post16ed.stats@gov.wales
Media: 0300 025 8099
![]()
SFR 124/2022