Hospital and GP services (National Survey for Wales): April 2021 to March 2022
This report looks at ease and difficulty making GP appointments and the satisfaction with care received at GP and hospital appointments for April 2021 to March 2022.
This file may not be fully accessible.
In this page
Introduction
In 2021-22, the National Survey included questions about people’s use of and satisfaction with GP surgeries and hospital services. People were asked about the ease of getting an appointment and the frequency of appointments; whether they saw a GP or another health professional; whether their hospital appointment was as an in-patient or out-patient; and how satisfied they were with the care received.
The NHS Wales Planning Framework 2022 to 2025 looks ahead to the next three years in accordance with the plan for A Healthier Wales. Two of the aims outlined in the plan are of relevance to this bulletin:
- Better quality and more accessible health care services
- Higher value health care
The impact of the COVID-19 (coronavirus) pandemic means that health services in Wales have had to adapt rapidly. Remote appointments (telephone or video calls) have become a more common method of consultation with a medical professional. Prior to the pandemic primary care had started to diversify and in addition to GP appointments it now provides services from other health care practitioners that previously may not have been available at a GP surgery.
Some results from earlier years are included to provide context. However, due to differences in mode and possible real change due to the pandemic, care should be taken when making direct comparisons.
As with all analysis of this kind, although we discuss associations between factors, we are unable to attribute cause and effect for these associations, or to take account of factors not measured in the survey. See quality information for more details on the analysis we have carried out.
Main points
- Fewer people had GP and hospital appointments than in 2019-20.
- 33% of people found it difficult to book a convenient doctor’s appointment.
- 50% of appointments with a GP were held remotely.
- 38% of people had appointments with medical professionals (other than a GP) at their GP surgery. 88% of these appointments were held with a nurse or nurse practitioner.
- 15% of people found it difficult to book a convenient appointment with non-GP medical professionals.
- 36% of people had an NHS hospital appointment.
- 10% of hospital outpatient appointments were held remotely.
- Patients at GP surgeries and at hospitals were less satisfied with their care if they had a remote appointment rather than one face-to-face.
GP appointments
of people had a GP appointment in the past 12 months.
This continues a trend of fewer GP appointments compared with pre-pandemic years. 76% of people saw a GP in 2019-20 and 64% in 2020-21.
In 2021-22, 63% of women saw their GP, compared with 53% of men. Those in poor health were more likely to have an appointment, with 76% of people with self-reported bad health seeing their GP compared with 52% who said they were in good health. Similarly, people with a limiting long-term illness were more likely to have had an appointment with their GP than those without; 73% of those with such a condition had an appointment compared with 50% of those without.
50% of appointments with a GP were held face-to-face, 49% were over the phone and 1% were by video call. This is an increase in telephone appointments compared with 2020-21, when 32% of appointments were held over the phone and 67% were held in person.
90% of people with a GP appointment made their own appointment. This varied by age group with 80% of 16 to 24 year-olds making their own appointment compared with 93% of 25 to 64 year-olds. 84% of people aged 75 and over made their own GP appointment.
Of those who made their own appointment, 67% found it easy to book an appointment time that was convenient for them. People found it easier to get a convenient face-to-face appointment than telephone appointment, with 71% of those booking the former finding it easy compared with 61% of those booking the latter. People living in rural areas also found it easier to book convenient appointments, with 73% finding it easy compared with 63% living in urban areas. Additionally, 71% of people in good health were able to easily book a convenient time whilst 51% of those in bad health found that booking a convenient time was easy.
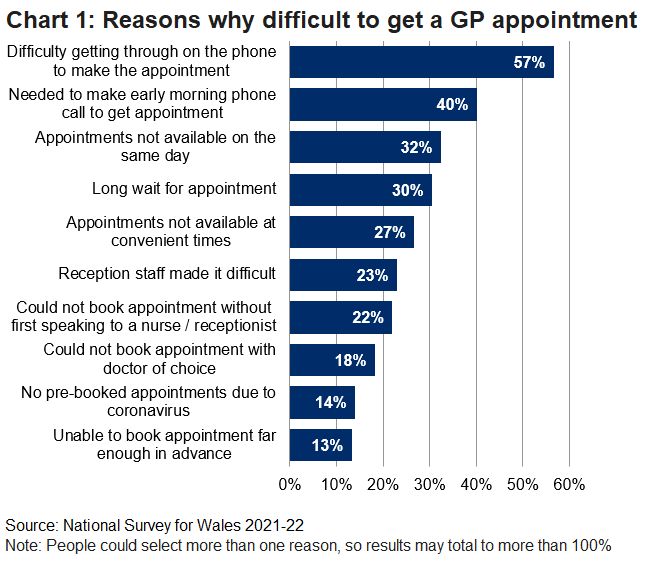
People who had difficulties booking their last GP appointment were asked why they had found it difficult. Difficulty getting through on the phone was the most frequently given reason. (Chart 1)
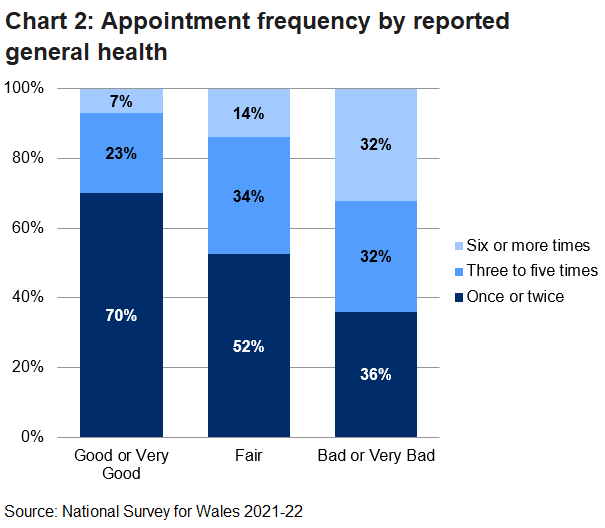
62% of people who had had a GP appointment in the last 12 months had had one or two appointments over this period, 27% had 3 to 5 appointments, and the remaining 11% had six or more. The frequency of appointments varied with a person’s general health (Chart 2).
Among people who had not had a GP appointment in the last 12 months, 11% said they had wanted an appointment but couldn’t get one. When asked why they couldn’t get an appointment, the most common response was that they couldn’t get one at a convenient time (36%).
Getting an appointment was more difficult for some groups: 22% of people living in material deprivation wanted an appointment but hadn’t got one, and 23% of those with a limiting long-term illness said they couldn’t get an appointment.
GP satisfaction
of people were satisfied with the care they received at their last GP appointment.
91% of people who had a face-to-face appointment were satisfied with the care received, compared with 80% of those who had a telephone appointment. People living in material deprivation were less likely to be satisfied (80%) than those who weren’t deprived (87%).
The level of satisfaction also varied with the person’s general health. 89% of those who described their health as good were satisfied with the care received, while 80% with bad health were satisfied.
Other appointments at surgery
of people had an appointment with another medical professional at their GP surgery.
Results varied by sex, with 44% of women having such an appointment compared with 32% of men. 39% of people who identified as white British had an appointment compared with 27% of those who identified as white but not British and 24% of people who were Black, Asian or from another ethnic minority group. This result would benefit from further research since the link with ethnicity disappeared for GP and hospital appointments after other factors were taken into account (see quality information).
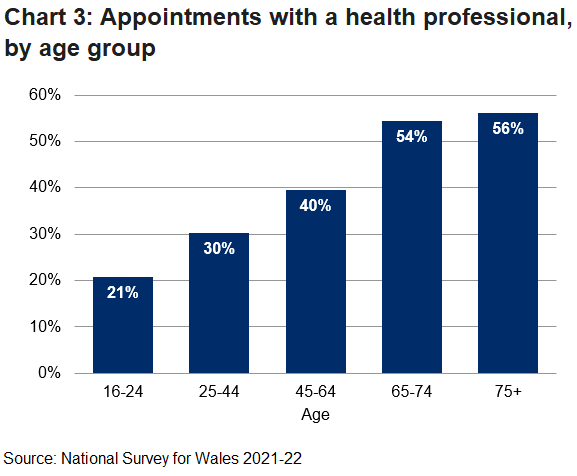
The likelihood of having an appointment also increased with a person’s age, as shown in Chart 3.
A person’s general health was also linked with the likelihood of having an appointment, with people in poorer health more likely to have appointments. 35% of those in good health had an appointment, while 49% in fair health and 54% in bad health had an appointment. Similarly, having a limiting long-term illness also increased the likelihood of having an appointment with a healthcare professional. 32% of people without such an illness had an appointment compared with 51% of those who did have a limiting long-term illness.
Most non-GP appointments were held face-to-face (92%), with 8% by telephone. 88% of all non-GP appointments were with a nurse. Other appointments were with practitioners such as midwives, physiotherapists, pharmacists, and healthcare assistants.
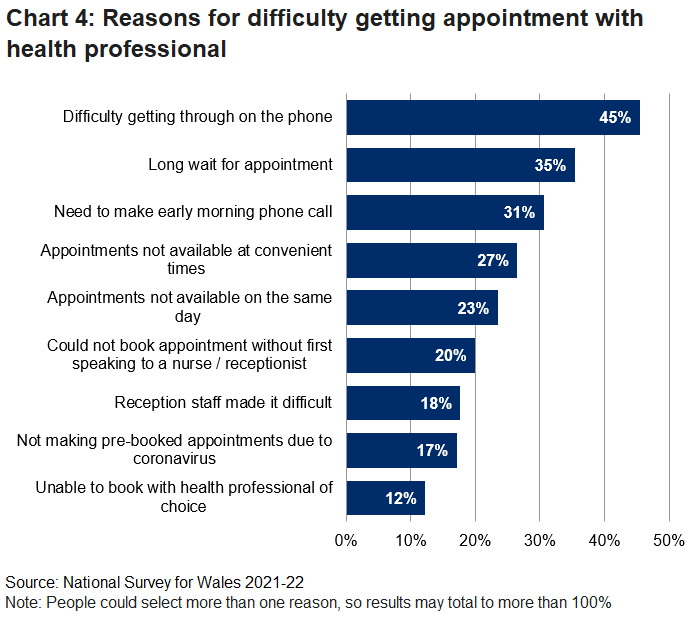
Overall, 85% of people found it easy to book an appointment at a convenient time. People living in rural areas found it easier than those living in urban areas: 90% compared with 83% respectively. People who had difficulties booking their last non-GP appointment were asked why they had found it difficult. Difficulty getting through on the phone was the most frequently given reason. (Chart 4)
Of the group who had an appointment with a health professional, 72% had either one or two appointments in the previous 12 months, 19% had between three and five appointments and 9% six or more. The number of appointments was highest for people who also said they had poor general health.
Overall, 3% of people said they had wanted an appointment with a health professional but didn’t have one. However, this rose to 8% of people living in material deprivation and 13% of people who were in bad health. 28% of people who didn’t have an appointment but wanted one said it was because they couldn’t get an appointment at a convenient time. For the remainder it was for other reasons related to difficulty getting to the surgery due to bad health or limiting illness, or with cost of travel.
Satisfaction with appointment
of people were satisfied with the care they received at their last non-GP appointment.
A lower rate of satisfaction was found if the appointment was held by telephone, with 86% of this group being satisfied compared with 97% of people who had face-to-face appointments.
Hospital appointments
of people had an NHS hospital appointment in the past 12 months.
This is consistent with results from 2020-21, but lower than in 2019-20, when 48% of people had an appointment in the previous 12 months.
39% of women had a hospital appointment, compared with 32% of men. The likelihood of having an appointment increased with age, especially for people aged 45 or older. (Chart 5)
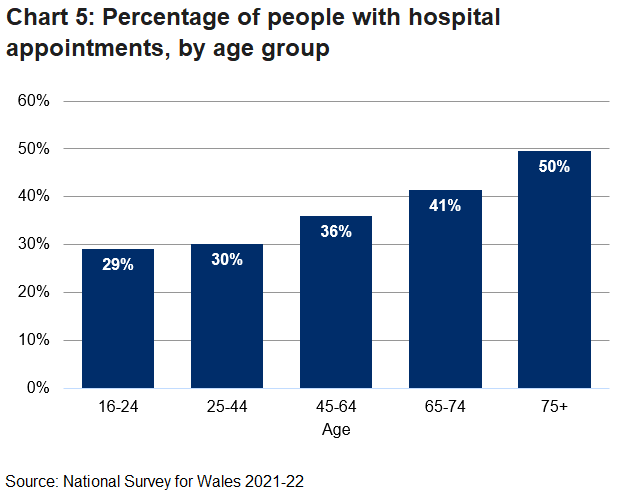
The likelihood of having an appointment increased for people who also said their health was bad. 29% of those with good health had an appointment compared with 49% of those with fair health and 66% of those with bad health. Similarly, 52% of people with a limiting long-term illness had a hospital appointment while 27% of those who didn’t have such a condition had an appointment.
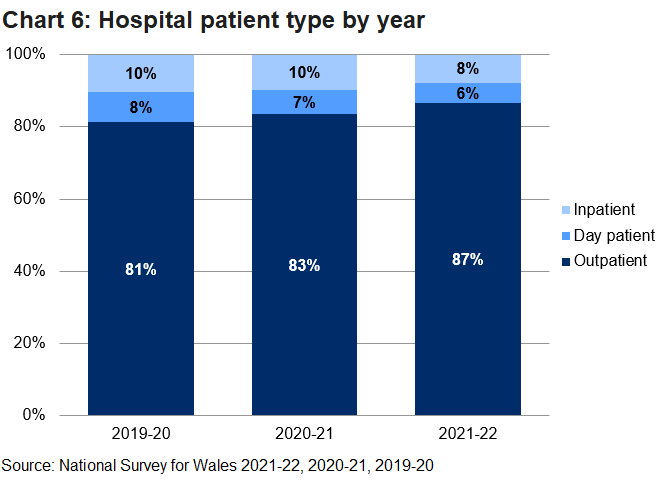
87% of people were seen as an outpatient (not assigned a hospital bed) for their most recent hospital appointment. 6% were classed as day patients (people assigned a hospital bed but do not stay overnight) and 8% as inpatients (people assigned a hospital bed and stay overnight). In addition to the general fall in the proportion of people having a hospital appointment, of those that did have one, there has been an increase in the proportion of outpatients, and reductions in the proportions of day patients and of inpatients, since the Covid-19 pandemic started (Chart 6).
In 2021-22, 10% of outpatients’ most recent appointments were held remotely (either by telephone or video call).
Of people with a hospital appointment, 68% had one or two appointments in the past 12 months, 21% had between three and five appointments, and 11% had six or more appointments. As with GP appointments the frequency of appointments was greater when patients’ health was bad. 40% of people with a limiting long-term illness had at least 3 appointments compared with 25% of those who didn’t have a such a condition.
Overall, 96% of patients agreed that they were treated with dignity and respect at their last hospital appointment, with 88% strongly agreeing. There was no difference in this between: men and women, different age groups, or different ethnicities.
Satisfaction with hospital appointment
of people were satisfied with the care they received at their last hospital appointment.
People in bad health were less likely to be satisfied, with 88% satisfied with their last appointment compared with 95% of those in good health. Inpatients were less likely to be satisfied with their care, with 85% satisfied, while 96% of day patients and 93% of outpatients were satisfied.
Additionally, and following the pattern seen with GP appointments, outpatients were less likely to be satisfied if their appointment was held via telephone, with 84% feeling satisfied compared with 95% of those who had face-to-face appointments.
The survey results included in this bulletin complement other Welsh Government statistical releases such as Hospital admissions 2020-21, General practice workforce: as at 30 June 2022, and GP Access in Wales, 2019.
Quality information
The National Survey for Wales is a continuous, large-scale, random sample survey covering people across Wales. Prior to March 2020, the survey was carried out face-to-face in people’s homes; since April 2020, it has been carried out by telephone instead (with an online section for some respondents).
Addresses are randomly selected, and invitations sent by post, requesting that a phone number be provided for the address. The phone number can be provided via an online portal, a telephone enquiry line, or direct to the mobile number of the interviewer for that case. If no phone number is provided, an interviewer may call at the address and ask for a phone number.
In 2021-22 a sub-sample of approximately 6,000 people were asked the GP questions and a larger sub-sample of around 10,000 people were asked the hospital questions. Both samples were split equally across the seven Welsh local health boards.
Detailed charts and tables of results are available in our interactive results viewer. For information on data collection and methodology please see our Quality report, Technical report and Regression report pages.
Cross-analysis suggests that various factors may be associated with the responses given to each question asked in the National Survey. However, these factors are often linked to each other (for example, people with a limiting long-term condition may also be older). To get a clearer understanding of the effect of each individual factor, we have used statistical methods to separate out the individual effect of each factor. These methods allow us to look at the effect of one factor while keeping other factors constant – sometimes called “controlling for other factors”. Each breakdown described in this report was identified as an individual factor.
National Statistics status
The United Kingdom Statistics Authority has designated these statistics as National Statistics, in accordance with the Statistics and Registration Service Act 2007 and signifying compliance with the Code of Practice for Statistics.
National Statistics status means that official statistics meet the highest standards of trustworthiness, quality, and public value.
All official statistics should comply with all aspects of the Code of Practice for Statistics. They are awarded National Statistics status following an assessment by the UK Statistics Authority’s regulatory arm. The Authority considers whether the statistics meet the highest standards of Code compliance, including the value they add to public decisions and debate.
It is Welsh Government’s responsibility to maintain compliance with the standards expected of National Statistics. If we become concerned about whether these statistics are still meeting the appropriate standards, we will discuss any concerns with the Authority promptly. National Statistics status can be removed at any point when the highest standards are not maintained and reinstated when standards are restored.
The continued designation of these statistics as National Statistics was confirmed in June 2020 following a compliance check by the Office for Statistics Regulation (letter of confirmation). These statistics last underwent a full assessment (full report) against the Code of Practice in 2013.
Since the latest review by the Office for Statistics Regulation, we have continued to comply with the Code of Practice for Statistics, by for example:
- providing more detailed breakdowns in the results viewer
- updated the survey topics regularly to ensure we continue to meet changing policy need
- continued to carry out regression analysis as a standard part of our outputs, to help users understand the contribution of particular factors to outcomes of interest
Well-being of Future Generations Act (WFG)
The Well-being of Future Generations Act 2015 is about improving the social, economic, environmental and cultural wellbeing of Wales. The Act puts in place seven wellbeing goals for Wales. These are for a more equal, prosperous, resilient, healthier and globally responsible Wales, with cohesive communities and a vibrant culture and thriving Welsh language. Under section (10)(1) of the Act, the Welsh Ministers must (a) publish indicators (“national indicators”) that must be applied for the purpose of measuring progress towards the achievement of the wellbeing goals, and (b) lay a copy of the national indicators before Senedd Cymru. Under section 10(8) of the Well-being of Future Generations Act, where the Welsh Ministers revise the national indicators, they must as soon as reasonably practicable (a) publish the indicators as revised and (b) lay a copy of them before the Senedd. These national indicators were laid before the Senedd in 2021. The indicators laid on 14 December 2021 replace the set laid on 16 March 2016.
Information on the indicators, together with a narrative for each of the wellbeing goals and associated technical information is available in the Wellbeing of Wales report.
Further information on the Well-being of Future Generations (Wales) Act 2015.
The statistics included in this release could also provide supporting narrative to the national indicators and be used by public services boards in relation to their local wellbeing assessments and local wellbeing plans.