|
The goal: A nation which maintains and enhances a bio-diverse natural environment with healthy functioning ecosystems that support social, economic and ecological resilience and the capacity to adapt to change (for example, climate change). Author: Sue Leake, Welsh Government What have we learnt from the data in the last year?The latest evidence on the Welsh environment confirms a number of positive trends that have been taking place over the last 20-30 years with the condition of Welsh peatlands improving significantly and woodland and habitat topsoil recovering, whilst populations of butterfly species are stabilising. However we know that at least a third of priority bird species still have declining populations and there are some recent indications of change in topsoil carbon and acidity of soil in some habitats which will need to continue to be monitored. A new methodology based on satellite imagery has been developed to provide a new baseline for our estimate of the extent of semi-natural habitat in Wales. This provides an estimate that semi-natural habitats cover 31 per cent of the Welsh land surface, varying from 74 per cent in the upland area to 19 per cent in the lowlands. Recycling rates continue to improve, with 64 per cent of local authority municipal waste now being recycled. The installation of renewable energy generation capacity has increased in pace in recent years with the capacity of technologies such as solar panels more than doubling in the two years up to 2016, and onshore wind capacity showing a 50 per cent increase; Capacity for renewable heat generation has also nearly doubled in this period. Whilst there is a long term trend of reductions in greenhouse gas emissions, the latest data shows an increase in emissions in 2016 compared with 2015, which is largely driven by a recovery in natural gas power generation following numerous outages to implement efficiency upgrades in 2015. Energy supply, business and industrial processes remain the key drivers of greenhouse gas emissions. New data on noise pollution indicate a quarter of households are bothered by unwanted noise (either inside or outside their homes) with 45 per cent of these households bothered by noise from traffic, businesses or factories in their area. Data on water quality and flood risk are only updated periodically and this report does not contain any new data compared the 2017 report. The natural resources of Wales - our air, land, water, wildlife, plants and soil - when cared for in the right way, can provide food and energy as well as helping us to reduce flooding, improve air quality, and provide materials for construction. They also provide a home for some rare and beautiful wildlife and iconic landscapes we can enjoy and which boost the economy. Ecosystems (the interaction of living things with their environment) can be complex and in order to understand what is happening it is important to look at a range of indicators such as those on air, water and soil quality as well as biodiversity and the extent and condition of our habitats. Wales’ natural landscape, coastlines and seas are important national assets supporting a bio-diverse environment, agriculture and fishing and the tourist industryThe land area of Wales covers just over 2 million hectares (ha), with the Welsh marine area extending out 12 nautical miles. The land cover of Wales can be divided broadly into
Land which has been modified will include the built environment and land which has been altered from its semi-natural state for productive use such as:
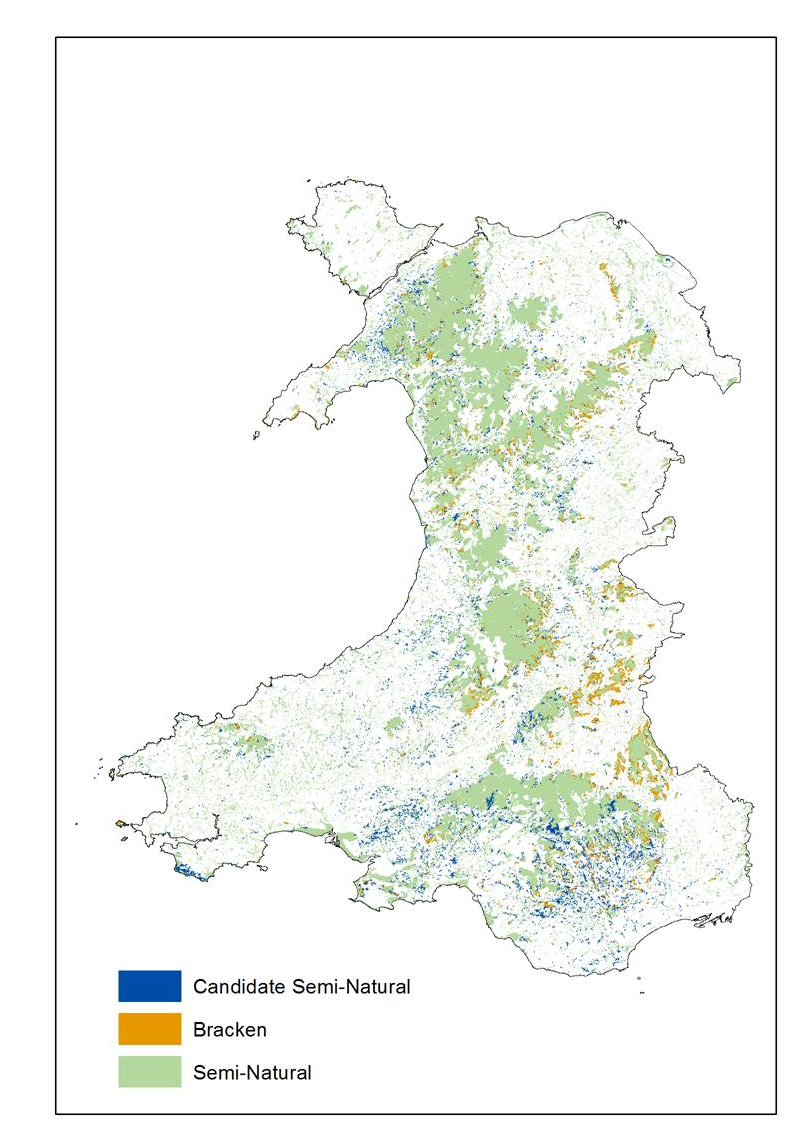
Wales has very few purely ‘natural’ habitats (that is, habitats which have not been affected in any way by human activity) therefore our national indicator is based on the extent of semi-natural habitats. Semi-natural habitats are key components of a biodiverse natural environment that delivers a wide range of ecosystem services. A previous estimate of the extent of semi-natural habitats in Wales was derived from a comprehensive field survey reported on in the Habitat Survey of Wales (2010). Updated information on habitats was available from more recent Glastir Monitoring Evaluation Programme (GMEP) results. Natural Resources Wales have developed a new approach using satellite imagery to update our existing understanding of the distribution and extent of habitats across Wales. This approach has been used to derive a new baseline estimate of the extent of semi-natural habitat which will be capable of being updated in the coming years using consistent data sources and methodology. The latest estimate using this new methodology should be considered as ‘experimental’ at this stage as further work is intended to refine the approach and allow more detailed presentation of the results in future. The estimate of semi-natural habitat presented here includes land areas which are clearly semi-natural habitats, those which are bracken and some areas of land, here called ‘candidate semi-natural’ habitats, which have the potential to function more like semi-natural habitats than habitats that have been subject to intensive agricultural improvement. Given their frequent proximity to established areas of semi-natural habitat, these candidate areas might be viewed as representing opportunities for enhancing the resilience of existing ecosystems. For details see “Natural Resources Wales Briefing Note: A new baseline of the area of semi-natural habitat in Wales for Indicator 43 “. Based on 2016-2017 satellite imagery this new method indicates that semi-natural habitats in Wales cover a total of 640,827 ha (31 per cent of the Welsh land surface). This varies across Wales; whilst 74 per cent of the upland area is semi-natural habitat only 19 per cent of the lowlands is semi-natural. Map of semi-natural habitat in Wales (including bracken and ‘candidate
semi-natural’ habitats) (a)
Map shows areas of habitat identified as semi-natural as well as areas
identified as bracken and areas of land, here called ‘candidate
semi-natural’ that have the potential to function more like
semi-natural habitat than habitats that have been subject to intensive
agricultural improvement. For details see Natural resources Wales Briefing
Note: A new baseline of the area of semi-natural habitat in Wales for
Indicator 43
Welsh waters host important habitats and populations of species including the most southerly examples of horse mussel beds, a resident community of bottlenose dolphins in Cardigan Bay and more than 60 per cent of the global breeding population of Manx shearwater. Wales is home to a broad range of animal and plant species and many special habitats. Whilst the latest evidence shows some positive trends in relation to Welsh peatlands and the recovery or stabilisation of some soils and species (e.g. butterflies) the latest comprehensive assessment of the Welsh natural resources (the State of Natural Resources Report) shows that overall, biological diversity is declining, and no ecosystems in Wales can be said to have all the features needed for resilience. The Glastir Monitoring and Evaluation Programme (GMEP) was established to provide a robust evidence base to inform the management of the Welsh environment. The latest report confirms a number of positive trends that have been taking place over the last 20 to 30 years but continues to highlight some areas where the trends are not so positive. On the positive side:
Less positively, results show:
Generally, trends of extent and population of terrestrial, freshwater and marine species vary enormously; with some species increasing and some decreasing. For instance, both increases and decreases can be seen in birds, bats and many pollinator species (e.g. bees and butterflies) though for many species we do not have sufficient data on which to base any conclusions. There is information on the latest population trends for breeding birds in Wales and for bats available from the 2017 Breeding Birds Survey (BBS) and from the 2017 National Bat Monitoring Programme (NBMP). These show that some of our woodland birds are doing better in Wales than in other parts of the UK as a whole, although, in line with trends across the UK, some other bird species are still declining. Of the eight species of bat that are monitored in the NBMP in Wales most are either increasing or remaining stable, showing similar trends to that across the UK, with lesser horseshoe bats in Wales showing a very substantial increase. Specially designated areas across Wales are important in protecting our ecosystems and helping maintain a bio-diverse natural environmentWales has 1,016 Sites of Special Scientific Interest, 21 Special Protection Areas for internationally important populations of birds and 95 Special Areas of Conservation for other threatened species and natural habitats. These special sites and areas are designated in order to protect by law their wildlife and geology by aiming to protect ecosystems and helping to maintain a bio-diverse natural environment. When taken together these special sites form a network which when designed and appropriately managed are intended to provide multiple benefits contributing towards ecosystem resilience. In particular, an assessment of the network of marine protected areas in Wales in 2016 concluded the marine network is well connected, represents the majority of habitats and species present in Welsh waters in two marine ecosystems (Irish Sea, and Western Channel and Celtic Sea) and is progressing towards being well managed.
As an overview, according to the most recent assessment of Special Areas of Conservation published by Natural Resources Wales (NRW) in 2016 roughly 25 per cent of these areas were in a favourable condition. In 2018 NRW produced indicative site level condition reports for all features in each marine SAC and SPA in Wales. Features include habitats (e.g. estuaries, caves, inlets) and species (e.g. grey seal, puffin, bottlenose dolphin). The indicative reports concluded that 46 per cent of all features in Wales – including all mammal features - were assessed as in favourable condition. The rivers of Wales are hosts to important fish species including sea trout, shad, lamprey and bullheads, as well as the iconic Atlantic Salmon. While all fish species are challenged, there is verifiable evidence that there has been a marked reduction in the abundance of salmon in recent years, particularly in the southern regions of the species’ range which is linked to increased mortality at sea. Although stocks in many of our industrial rivers have improved in the last 30 years, most stocks in Wales remain severely challenged. When asked in the National Survey for Wales about how concerned they were about past or future changes to the variety of species in Wales, 43 per cent of respondents indicated they were fairly or very concerned about this. Work has been commissioned through the Welsh Government ERAMMP (Environmental and Rural Affairs Monitoring and Modelling) Programme to explore the potential of the available (and primarily terrestrial) Welsh data on biodiversity in Wales to develop an appropriate Welsh biodiversity indicator for use in future monitoring. The quality of our soil is very importantSoils are crucial to terrestrial ecosystems and underpin vital ecosystem services. This is why good management of our soil is so important. Well managed soil will safeguard food production, support habitats, help to manage flood risk and reduce water treatment costs. Welsh soils are relatively unusual in a global context. There is a scarcity of high quality agricultural soil, with less than 7 per cent of the total land area in Wales made up of soils of best quality and most productive agricultural land. The picture for soil in Wales is mixed:
Finally, another increasingly important aspect of soil is the concentration of carbon. This is because soil can hold carbon for thousands of years and therefore help protect the earth against climate change. The soils in Wales store an estimated 410 million tonnes of carbon. The concentration of carbon in our soil is generally stable. According to the latest figures from 2013-16 the concentration of carbon and organic matter in topsoil was 107.6 grams of carbon per Kg (gC per Kg). As a whole, this is not significantly different to the concentrations found in 1998 and 2007: 109.1 and 109.4 grams of carbon per kg respectively. Soil carbon remains stable in most land types apart from habitat land where a loss of carbon has recently been observed. Water quality has been improvingWater is one of Wales’ natural resources which we rely on constantly. It provides us with 951 million tonnes of drinking water per day. Both water availability and water quality are important for a range of reasons, from availability of water for our homes and industries, to growing our food, providing recreational benefits and maintaining biodiversity. We therefore need to look after our water resources, whether that is surface water which includes streams, lakes, wetlands, bays, oceans, snow and ice, or groundwater which is the water stored in soil and rocks. Overall, according to Natural Resources Wales, the water quality in rivers has generally improved over the last 25 years, mainly as a result of improvements to sewage discharges. Furthermore, upland lakes and rivers show sustained recovery from the harmful effects of acid rain. But, even so, only 37 per cent of all freshwater water bodies (groundwater and surface water) defined by the Water Framework Directive were achieving good or better overall status in 2015. In terms of bathing waters, only one of the designated Welsh bathing waters did not meet the tougher standards set by the revised Bathing Water Directive in 2017. Of the 104 bathing waters assessed, 80 achieved the higher European Classification of an excellent standard, 18 bathing waters achieved a good standard whilst 5 achieved a sufficient standard. Air quality has greatly improved since the 1970s but some concerns remainPublic Health Wales estimates that the equivalent of around 1,600 deaths are attributed to PM2.5 exposure, and around 1,100 deaths to NO2 exposure, each year in Wales (as there are overlapping health impacts of individual pollutants, it is not possible to sum these). Air pollution plays a role in many of the major health challenges of our day, and has been linked to increased morbidity and mortality from respiratory diseases including asthma and chronic obstructive pulmonary disease (COPD), stroke and heart disease lung cancer and other effects. Both emissions of particular types of gas and particulate matter (particles suspended in the air) can be hazardous to health. It is therefore clear that clean air is vital to human health. In fact, poor air quality can affect the health of plants and animals as well as humans. Air quality in Wales has greatly improved since the 1970s due mainly to statutory emissions controls and a decline in heavy industry. However, pollution from other sources such as transport, agriculture and domestic heating has become more of a concern. Natural Resources Wales also report that:
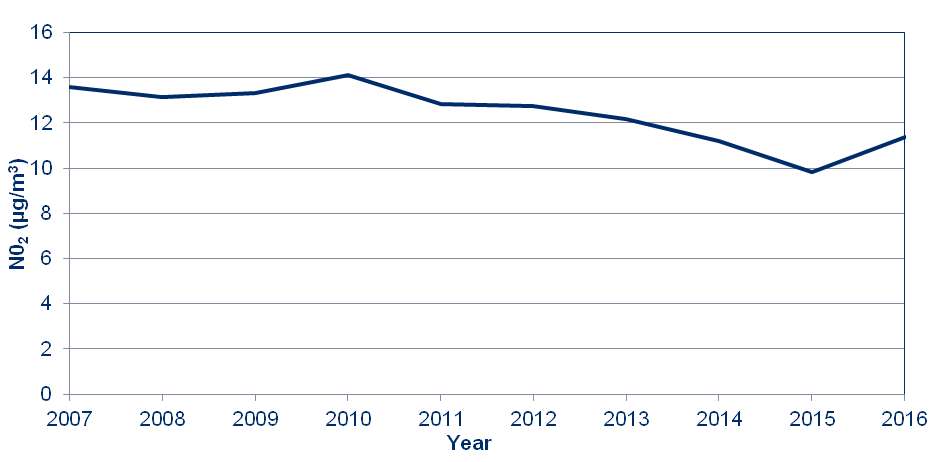
The highest concentrations of nitrogen dioxide emissions are found in large urban areas and adjacent to busy roads, reflecting the contribution traffic and urban activity make to poor air quality. Average nitrogen dioxide levels where people live across the whole of Wales (11 µg/m3 in 2016) are well below the annual mean limit to protect human health (40 µg/m3), however there are around 40 specific areas in Wales which local authorities have designated as Air Quality Management Areas as measurements in these areas have exceeded the 40 µg/m3 air quality objective. 2.01 Average nitrogen dioxide (NO2) concentrations in
µg/m3 Source: Air Concentration, Department for Environment, Food and Rural Affairs A quarter of households say they are regularly bothered by unwanted noiseNoise can be disruptive as part of the environment in which people live and spend their lives. Some sounds can be pleasant and enhance lives whilst others, those that could be considered unwanted or harmful, can, in the short term, disrupt sleep and increase levels of stress, irritation and fatigue, as well as interfering with important activities such as learning, working and relaxing. The 2017-18 National Survey for Wales asked respondents about their experience of being regularly bothered by noise inside or outside of their homes. Nearly a quarter of households (24 per cent) said they had. Of these:
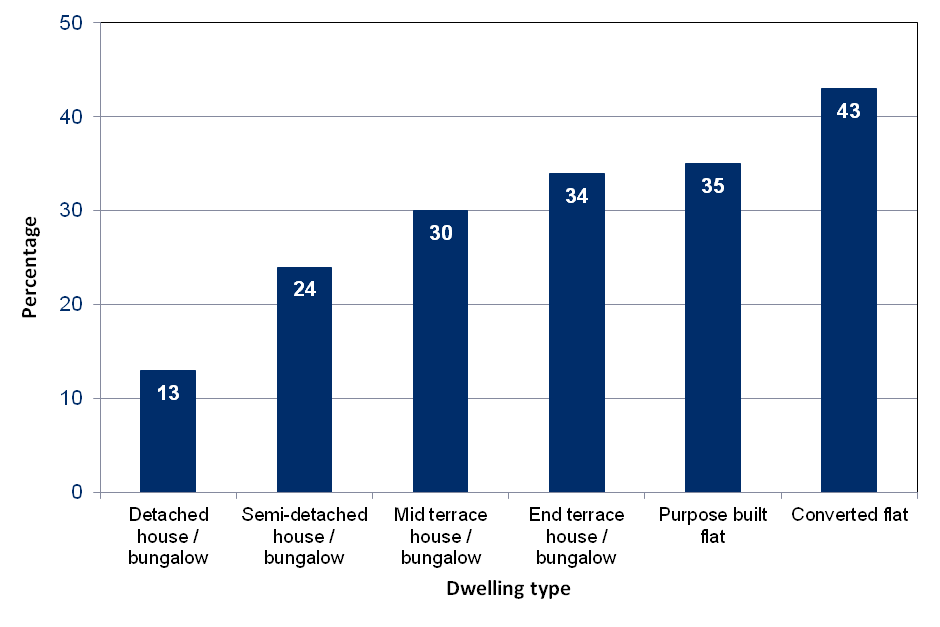
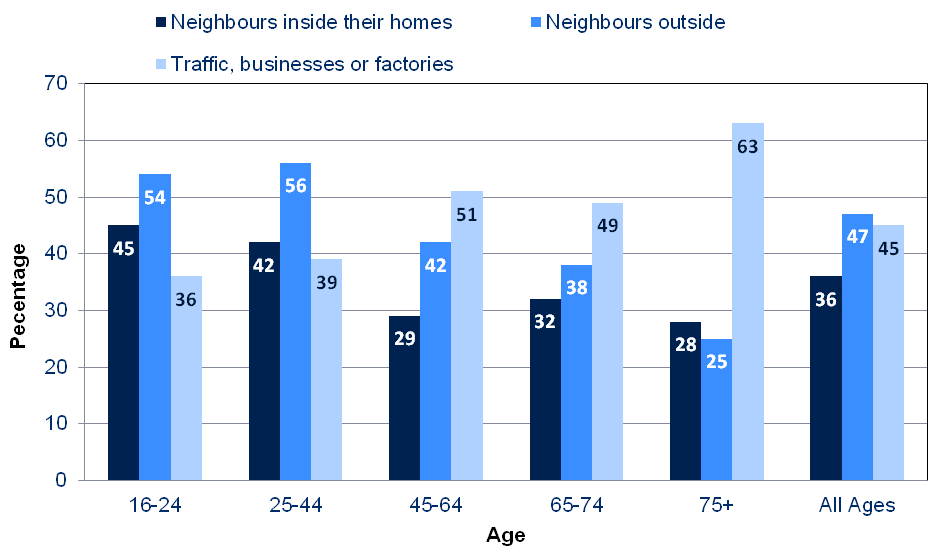
Those who lived in flats were more likely to be bothered by noise than those who lived in detached homes. People were more likely to be bothered by noise if they lived in materially deprived households or in deprived areas. 2.02 Bothered by noise, by type of dwelling, 2017-18 Source: National Survey for Wales Younger people were more likely to be regularly bothered by noise than older people but they are more likely to be bothered by noise from their neighbours, whereas for older people it is noise from traffic, businesses or factories that is more likely to bother them. 2.03 Type of noise, by age of respondent, 2017-18
Source: National Survey for Wales People who owned their own property were more likely to say they were regularly bothered by noise from traffic, businesses or factories than people living in social housing, but people living in social housing were more likely to be bothered by noise from their neighbours. Greenhouse gas emissions have reduced since the 1990s despite an increase in 2016Considering greenhouse gases, in 2016, it was estimated that emissions totalled 47.8 million tonnes of carbon dioxide (CO2) equivalent, a fall of 14 per cent compared to the 1990 base year emissions. The latest data shows an increase in greenhouse gas emissions in 2016 compared with 2015, which is largely driven by a recovery in natural gas power generation following numerous outages to implement efficiency upgrades in 2015. 2.04 Greenhouse Gas Emissions (Kilotonnes) Source: National Atmospheric Emissions Inventory, Department for Environment, Food and Rural Affairs The reduction of greenhouse gas emissions during this period is mainly due to:
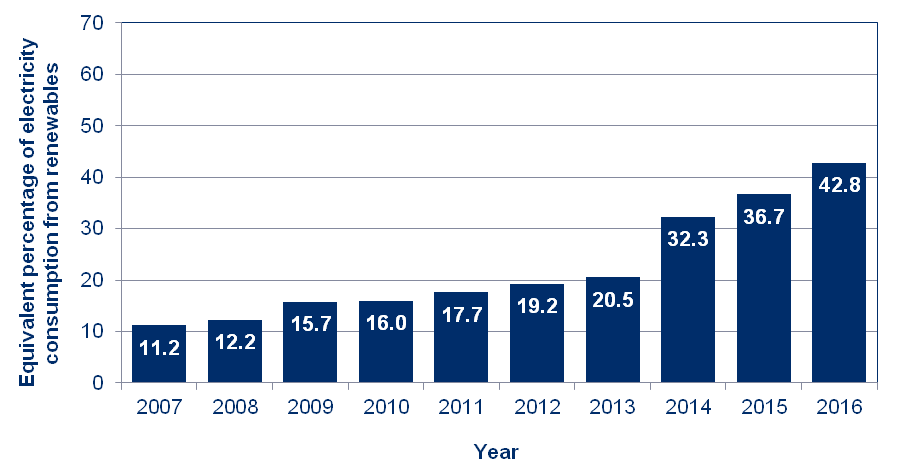
Around two thirds of greenhouse gas emissions continue to be as a result of energy supply, business and industry. Data relating to the greenhouse gas emissions attributed to the consumption of goods and services in Wales will be produced in future in line with the requirements of section 41 of the Environment (Wales) Act 2016 at the end of the first carbon budgeting period. Renewable energy generation has been on the rise and there’s some evidence that homes are becoming more energy efficient.The use of low carbon energy generation (of which renewable energy is one form) together with the more efficient use of energy helps to make us both ecologically and economically resilient to change. Reduction in demand for energy generation from fossil fuels helps limit greenhouse gas emissions which will have an impact on the environment and on future climate change. The capacity for renewable energy generation has risen in the last decade with an increased pace in recent years. A recent study of energy generation in Wales showed that in 2016 there was 3,357 megawatts (MW) of renewable energy generation capacity. The vast majority of this is renewable electricity (85 per cent or 2,854 MW) whilst the capacity of renewable heat installations has nearly doubled in the last two years to reach 504 megawatts (MW). In terms of the types of technologies for renewable energy being installed, capacity grew most between 2014 and 2016 in solar PV panels (more than doubled) and onshore wind (a 50 per cent increase). Whilst the capacity of renewable heat installations remain small compared to renewable electricity, this period saw a 65 per cent increase in the capacity of biomass installations and a 52 per cent increase in the capacity of heat pumps. 2.05 Growth in the percentage of electricity from renewable sources in
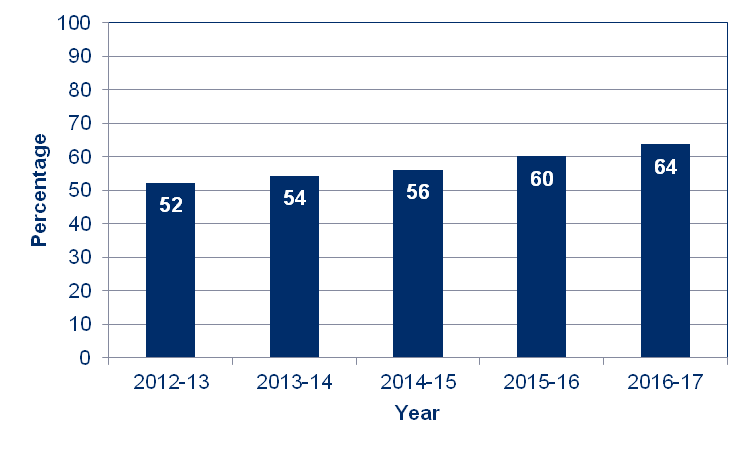
Wales, 2007 to 2016 Source: Energy Generation in Wales, 2016 Whilst approximately 17.7 per cent of total electricity generated in Wales in 2016 was from renewables, Wales is a net exporter of electricity and the electrical generation potential from renewable energy installations in Wales is estimated to be equivalent to 43 per cent of Wales’s national electricity consumption. Good energy performance in housing will not only reduce energy demand in the domestic sector but also help homeowners and tenants manage the costs of maintaining a warm home. When it comes to social housing, social landlords reported that nearly 96 per cent of their housing stock that have had their energy performance measured using the Standard Assessment Procedure (SAP) were achieving an adequate energy performance (SAP of 65 or above) in 2017. But social housing only represents 16 per cent of the total housing stock in Wales and we have gaps in our understanding of the private housing sector because we do not yet have figures for houses that have not lodged an Energy Performance Certificate (you usually only lodge one of these when building, selling or letting a property). Further information on the energy efficiency of the Welsh housing stock will be available once the results of the 2017-18 Welsh Housing Conditions Survey are published. Our ecological footprint shows that our key natural resources are being depleted faster than they can be replenishedThe ecological footprint of a country represents the area of land needed to provide raw materials, energy and food to supply that country as well as absorb the pollution and waste created. It is measured in global hectares. It serves as an indicator of the total environmental burden that a society places on the planet. A global hectare is a biologically productive hectare with world average biological productivity for a given year. In 2013 there were estimated to be around 12 billion hectares of biologically productive land and water on Earth. The last ecological footprint for Wales was calculated in 2011 and it was 10.05 million global hectares. This is roughly 5 times the size of Wales and equivalent to 3.28 global hectares per person in Wales. If everyone in the world were to consume the same as the average Welsh resident, it is estimated that just over 2.5 earths would be required to provide the resources and absorb the wastes. This is slightly lower than the figure for the UK, which is 2.7 earths. Recycling rates have been on the riseOne way to decrease our ecological footprint is to reduce our use of materials. We can do this by adopting more sustainable ways of consuming and producing goods, by reducing packaging and by making better use of our waste. Reducing and re-using waste has been a focus in Wales in recent years and there have been improvements - local authority recycling rates have risen from 52 per cent in 2012-13 to 64 per cent in 2016-17. 2.06 Percentage of local authority municipal (household and non-household) waste prepared for reuse, recycled or composted, 2012-13 to 2016-17
Source: WasteDataFlow, Natural Resources Wales Furthermore, residual household waste per person (i.e. the amount of that waste that is not collected for recycling, re-use or composting) has fallen by around 11 per cent between 2012-13 and 2016-17. Waste from industrial and commercial enterprises and the construction and demolition industry often need to be managed differently from household waste. Residual waste from all sectors (households, construction and demolition, industrial and commercial) is not published regularly but in 2012 the total amount of residual waste generated by all sectors stood at 2.4 million tonnes. Of this, 1.5 million tonnes (63 per cent) was industrial and commercial waste, 667,000 tonnes (27 per cent) was household waste and 240,000 tonnes (10 per cent) was construction and demolition waste. Whilst cars remain the dominant mode of transport for commuting, there has been an increase in registration of low-carbon vehicles such as plug-ins.Over time, reduced car use, stable commuting times and increased use of low carbon vehicles will collectively contribute to a reduction in emissions. Since the recession, the long-run trend to increased transport use in Wales has resumed, affecting all modes except buses (where use has decreased). As in most other parts of the UK outside London, private road transport remains very much the dominant mode and accounts for the overwhelming majority of commuting journeys in Wales. In 2016, 80 per cent of commuters in Wales used a car as their usual method of commuting, a small decrease since a peak of 84 per cent in 2013. The proportions of people walking or cycling (10-12 per cent), traveling by rail (2 per cent) and using buses (4 per cent) have remained stable over the past 15 years. Similarly, there is no discernable trend in average commuting times in Wales. The average commuting time has been steady at around 21-23 minutes since 2005, with little change for the various modes of travel. The most popular mode for children to travel to school is bus or train (38 per cent), followed by walking (32 per cent) and car/motorbike (27 per cent) UK data indicates that low-carbon vehicle use is growing strongly, albeit from a low base. In 2017-18 over 10,000 plug-in vehicles were licensed in Wales, compared to fewer than 700 in 2012-13. Nearly 22,000 properties in Wales are at high risk of floodingBeing aware of the potential risks to our properties means we can try to put measures in place to mitigate the impact of any such risks and thus be more resilient to adverse events. The latest Flood Risk Assessment (2014) identified 21,600 properties in Wales at high risk of flooding from rivers and the sea. A further 39,500 properties were identified as at medium risk of such flooding. Note, however, that there are other risks to properties of flooding – from surface water and heavy rain – which are not included in the figures above and are less easy to predict. National Survey for Wales 2016-17 results show that whilst 1 in 4 people in Wales are concerned about the risk of flooding in their local area, only 1 in 11 people (9 per cent) are concerned about flooding of their own property. Those in rural areas are more concerned about flooding in their area than those in urban areas (34 per cent concerned compared with 21 per cent respectively). A far more detailed review of environment data was published by the Natural Resources Wales in their 2016 State of Natural Resources Report (SoNaRR) report. |

