COVID-19 Wales situational report: 12 August 2021
Update from the COVID-19 Intelligence Cell and Health Protection Advisory Group.
This file may not be fully accessible.
In this page
COVID-19 situation report summary
Key points to note
Wales is at Alert Level 0 as of 7 August.
Overall transmission of COVID-19 and test positivity has increased slightly across Wales, following a small decrease last week. The JBC consensus estimate of the reproduction number for Wales is between 0.8 and 1.0, while PHW's estimate is between 1.0 and 1.1. Source: JBC/ PHW (12/8/21). Note that JBC's estimate is typically lagged by 2-3 weeks while PHW, which uses a different methodology, is lagged by around 1 week. Slide 3, Source: PHW.
COVID-19 hospital bed has been slowly increasing and ICU occupancy recently saw a marked decrease, although current trends are uncertain with levels relatively stable. As at 11 August 2021, there were 202 COVID-19 related patients (Suspected, Confirmed and Recovering) occupying a hospital bed. This compares to 180 (22 more occupied beds) on 4 August 2021.
As at 3 August 2021, Wales has 13,360 confirmed cases of the dominant Delta variant (an increase of 1,889 from the previous week). No other variants of concern were detected in Wales. Data regarding vaccine status of cases and hospitalisations is currently being amended by Public Health Wales and so is not available. Source: PHW.
As at the week ending 8 August 2021, a total of 4,421,170 doses of COVID-19 vaccine were given in Wales and recorded in the COVID-19 Welsh Immunisation System. Of the 4,421,170 doses given nationally, 2,301,598 were first doses and 2,119,572 were second doses. Based on SAGE's estimate of an immunity coverage requirement of at least 80% for the delta variant (including under 18s), current coverage will not offer population level protection in the absence of other protective behaviours. The JCVI recently approved first dose vaccination of 16 and 17 year olds in the UK and this has just begun in Wales. Source: PHW, SPI-M-O.
Key indicators
Several key indicators are starting to show an increase, following decreases in recent weeks.
Please note that the arrows represent a change in comparison for the last week.
| Current value (07/08/21) | Change since previous week (31/07/21 – 07/08/21 unless stated otherwise) | ||||
|---|---|---|---|---|---|
| Percentage change | Value change | ||||
| Confirmed case rate (rolling 7 day sum per 100k) | 142 | +7% | ↑ | (+9) | |
| Confirmed case rate for over 60s (rolling 7 day sum per 100k) | 57 | +7% | ↑ | (+4) | |
| Test positivity (7 day RA) | 10.3% | +7% | ↑ | (+0.7 percentage points) | |
| Population estimated to have COVID-19 (prevalence)1 | 0.46% | +7% | - | (+0.03 percentage points) | |
| NHS COVID-19 Admissions2 | 13 | -28% | ↓ | (-5) | |
| ONS deaths (7 day sum)3 | 17 | +6% | ↑ | (+1) | |
| PHW deaths (7 day sum) | 13 | -7% | ↓ | (-1) | |
- Latest COVID Infection Survey data is taken from 1 August 2021 to 7 August 2021.
- Seven day rolling average to the current date of confirmed COVID-19 patients, does not include COVID-19 suspected or recovering.
- Latest ONS deaths data is to 30 July 2021 (rather than 7 August 2021) for the current value. Data to 23 July 2021 is used for the change since previous week.
What is the current status of the epidemic?
| Local Authority | Number | % of All Wales Total | Case Incidence per 100,000 | Change from previous week |
|---|---|---|---|---|
| Denbighshire | 268 | 6.00% | 280.1 | -21% ↓ |
| Conwy | 279 | 6.20% | 238 | -1% ↓ |
| Wrexham | 275 | 6.10% | 202.3 | 2% ↑ |
| Newport | 287 | 6.40% | 185.5 | 29% ↑ |
| Flintshire | 280 | 6.20% | 179.4 | 7% ↑ |
| Bridgend | 243 | 5.40% | 165.3 | 3% ↑ |
| Monmouthshire | 136 | 3.00% | 143.8 | 28% ↑ |
| Vale of Glamorgan | 190 | 4.20% | 142.2 | 76% ↑ |
| Powys | 182 | 4.10% | 137.4 | -9% ↓ |
| Swansea | 319 | 7.10% | 129.2 | 14% ↑ |
| Neath Port Talbot | 182 | 4.10% | 127 | 7% ↑ |
| Cardiff | 458 | 10.20% | 124.8 | 5% ↑ |
| Gwynedd | 154 | 3.40% | 123.6 | 6% ↑ |
| Torfaen | 116 | 2.60% | 123.5 | -2% ↓ |
| Merthyr Tydfil | 74 | 1.60% | 122.7 | -3% ↓ |
| Blaenau Gwent | 83 | 1.80% | 118.8 | 20% ↑ |
| Caerphilly | 211 | 4.70% | 116.5 | 9% ↑ |
| Rhondda Cynon Taf | 251 | 5.60% | 104 | -1% ↓ |
| Isle of Anglesey | 72 | 1.60% | 102.8 | 1% ↑ |
| Carmarthenshire | 189 | 4.20% | 100.1 | 22% ↑ |
| Pembrokeshire | 124 | 2.80% | 98.6 | 24% ↑ |
| Ceredigion | 47 | 1.00% | 64.7 | -22% ↓ |
| Unknown | 69 | 1.50% | - | 17% ↑ |
| Total | 4489 | 100.00% | 142.4 | 7% ↑ |
At a Wales level, on 7 August 2021, the 7-day rolling incidence of COVID-19 cases has slightly increased since last week. The percentage of people testing positive for COVID-19 has increased since last week (slide 2).
The JBC consensus estimate of Reproduction number (Rt) for Wales is between 0.8 and 1.0 (as at 12 August 2021), with daily growth rate of between -4% and 0% and a halving time of flat to -22 days. Using PHW positive test data only (more timely data but limited by variation in testing), Rt is estimated to be between 1.0 and 1.1 for Wales. Central Rt estimates are 1.0 or 1.1 for all health boards. Source: JBC/ PHW.
7-day cumulative case incidence in Wales has increased by 7% to 142.4 per 100,000 population in the last week.
Case incidence is increasing in 16 of the 22 local authorities. Case incidence is above 100 per 100,000 population for 20 of the 22 local authorities. Local authorities with the highest case incidences are Denbighshire and Conwy at 280.1 and 238.0 per 100,000 population, respectively, although case incidence is decreasing in these areas.
Case incidence is highest in those aged 10-19 and 20-29. Case incidence has decreased throughout the last few weeks in these age groups, but has stabilised in the latest week. Case incidence is highest for the Betsi Cadwaladr health board and stable for all health boards.
The second table below provides estimates of doubling and halving times based on PHW COVID-19 positive test data. In this table, doubling times are positive, whilst halving times are negative. The 95% confidence intervals are showing in brackets after the central estimate. An asterisk (*) means that there are small numbers and estimates should be treated with caution. Local health board level estimates of Rt and halving times will be unstable when incidence is low.
| Area | Rt (95% CI) | Halving time (95% CI) |
|---|---|---|
| All Wales | 1.0 (1.0 to 1.1) | 48 (18 to -72) DOUBLING |
| Swansea Bay UHB | 1.1 (1.0 to 1.1) | 33 (16 to -271) DOUBLING |
| CTM UHB | 1.0 (0.9 to 1.0) | 191 (18 to -22) DOUBLING |
| Aneurin Bevan UHB | 1.1 (1.1 to 1.2) | 25 (11 to -137) DOUBLING |
| Cardiff & Vale UHB | 1.1 (1.0 to 1.1) | 30 (12 to -69) DOUBLING |
| Hywel Dda UHB | 1.0 (0.9 to 1.1)* | 44 (13 to -30)* DOUBLING |
| Powys THB | 1.0 (0.9 to 1.1)* | 200 (13 to -14)* |
| Betsi Cadwaladr UHB | 1.0 (0.9 to 1.0) | 985 (30 to -32) DOUBLING |
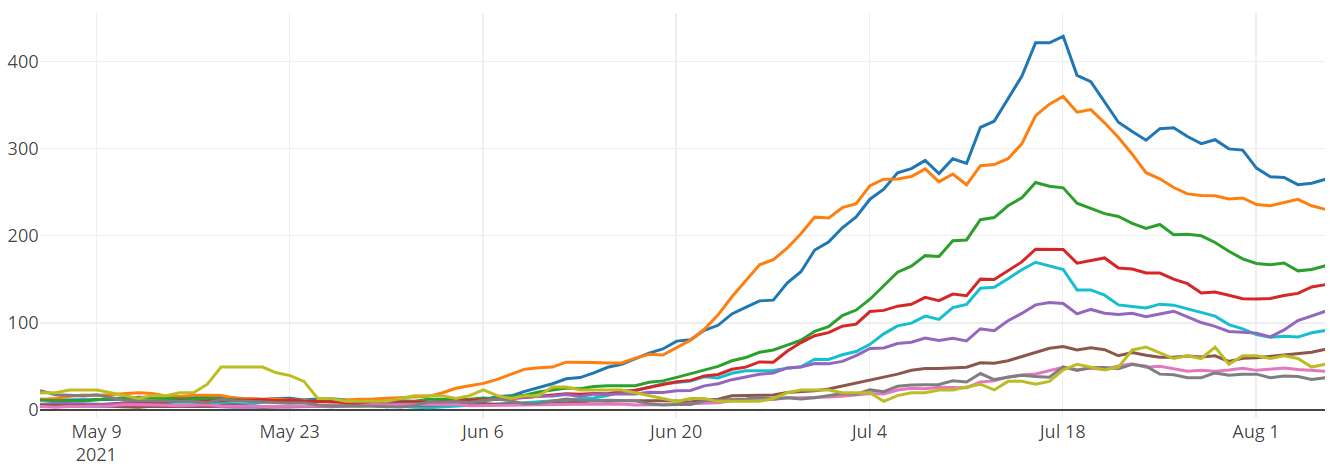
Cases per 100k (PHW Data) (7 day rolling sum)

Cases per 100k by age (PHW Data) (7 day rolling sum)
Data as at 12:00PM 11 August 2021 unless otherwise specified.
What is the situation with the NHS and social care?
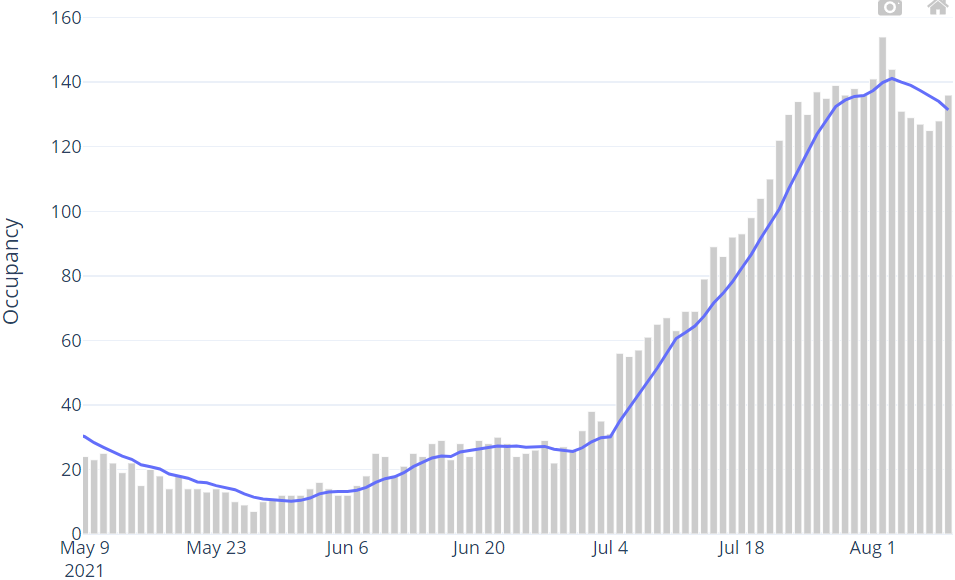
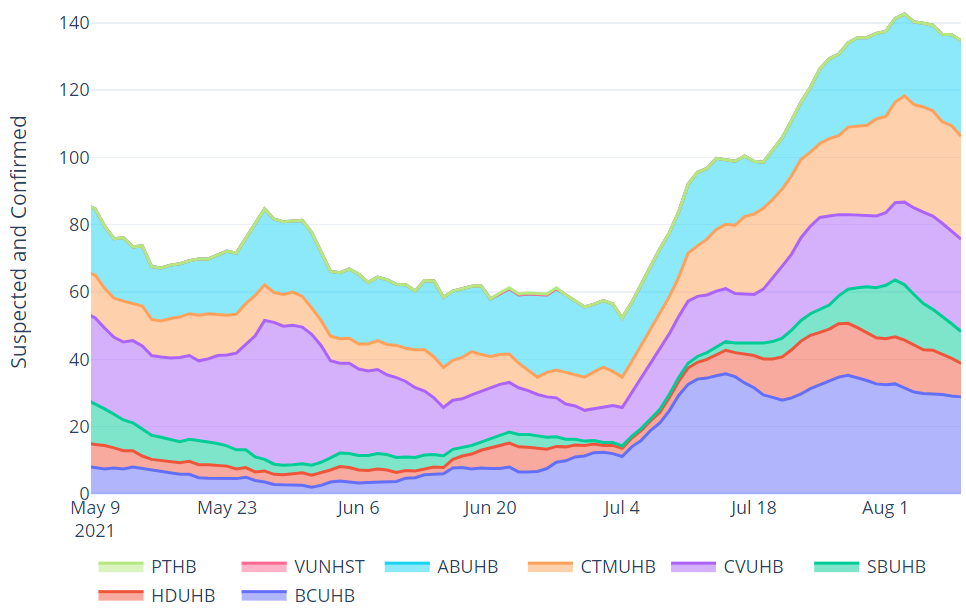
COVID-19 hospital bed and invasive ventilated bed occupancy on the NHS has been generally increasing over recent weeks. As at 11 August 2021, there were 202 COVID-19 related patients (Suspected, Confirmed and Recovering) occupying a hospital bed. This compares to 180 (22 more occupied beds) on 4 August 2021. Confirmed patients accounted for 137 of the total occupied beds, and are at similar levels to late July 2021.
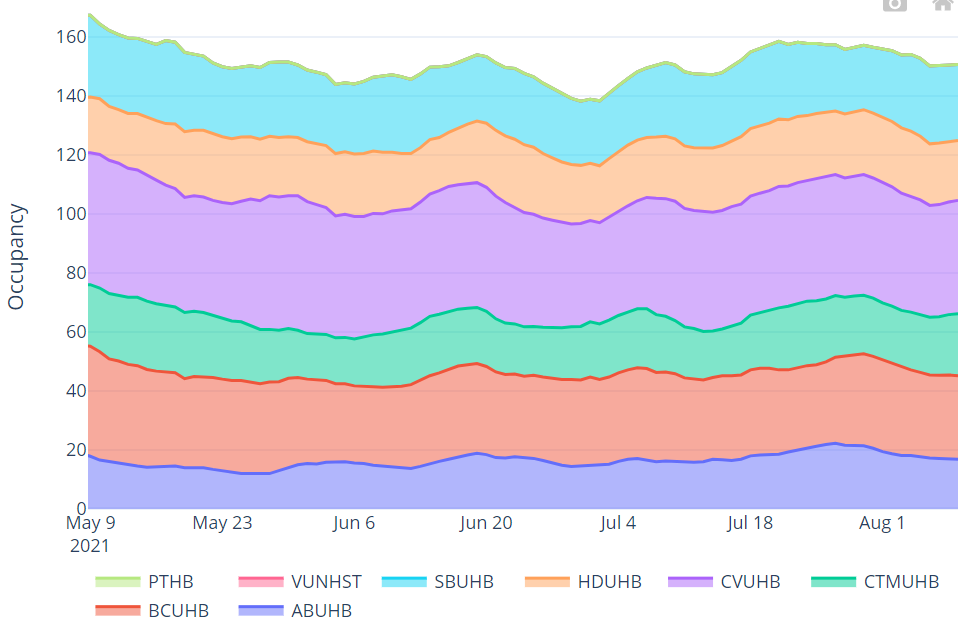
There are 21 patients with Suspected or Confirmed COVID-19 in critical care beds in Wales. This is 143 lower than the maximum COVID-19 position of approximately 164. The total number of patients in critical care for both COVID-19 and non-COVID-19 stands at 157, 5 more than the historic maximum critical care capacity of approximately 152.
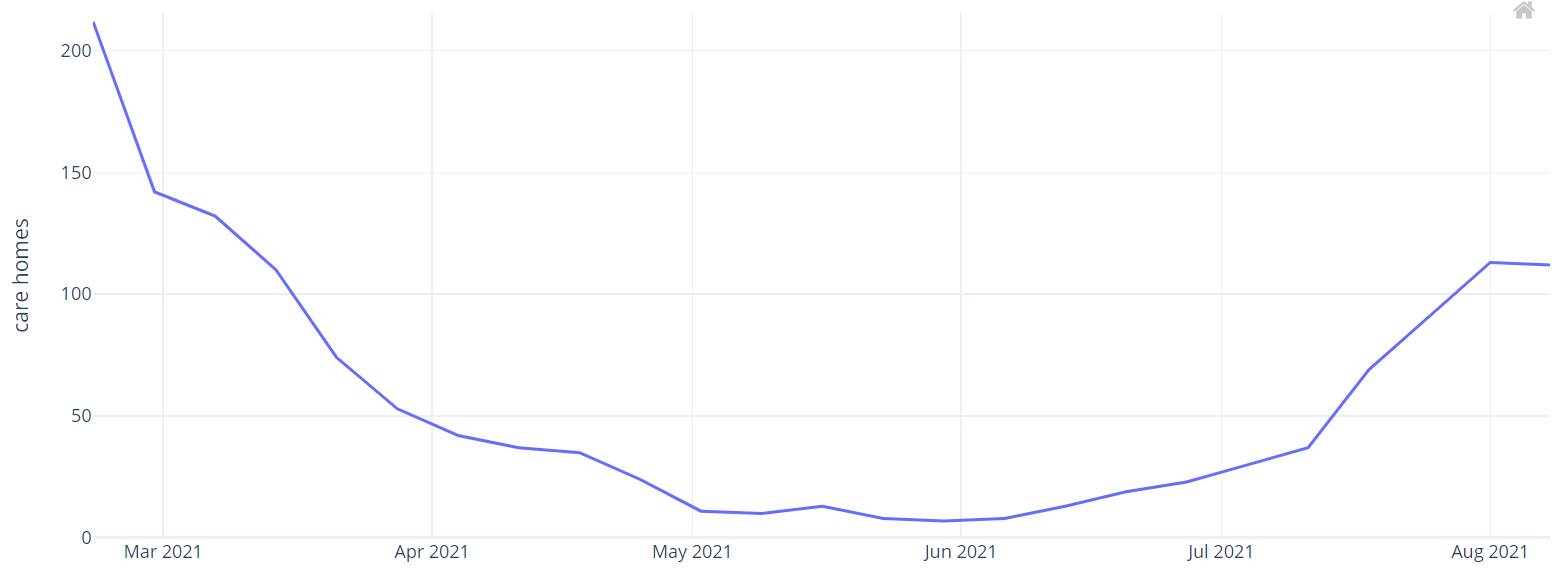
In the latest National Situation Background Assessment Recommendation (SBAR) report covering the week of 2 August 2021 to 8 August 2021, IMTs reported 112 care homes were in 'red' status (an ongoing outbreak/incident reported within the last 7 days), with 1 health board reporting having no care homes in 'red' status. This is compared with 113 care homes in 'red' status in the 7 days up to 1 August 2021. Source: National SBAR.
Confirmed hospital occupancy (7 day rolling average)
Overall invasive ventilated bed occupancy (7 day rolling average)
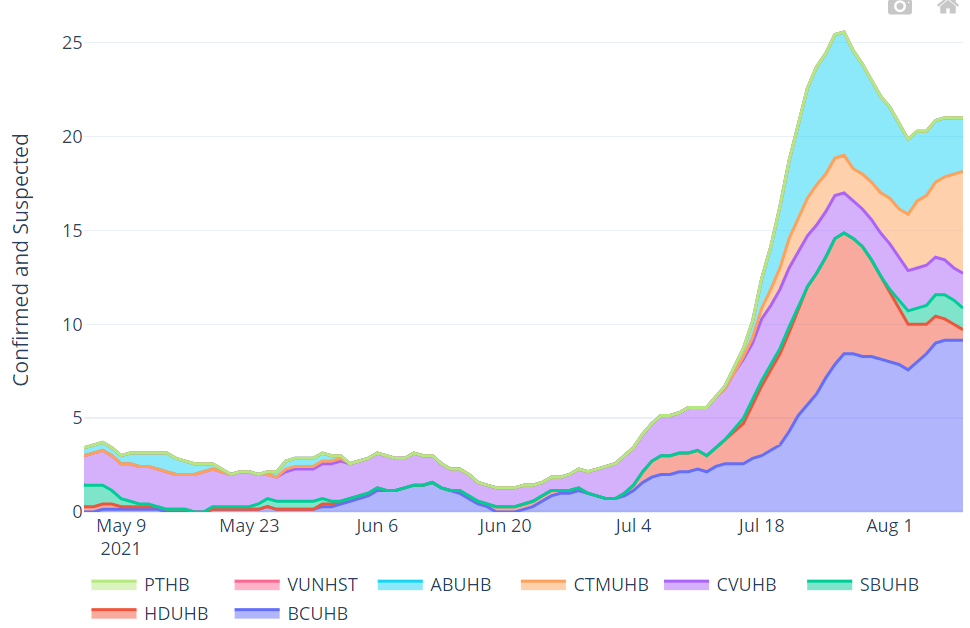
Hospital bed occupancy for suspected and confirmed COVID-19 positive patients (7 day rolling average)
Invasive ventilated bed occupancy for suspected and confirmed COVID-19 positive patients (7 day rolling average)
Number of adult care homes reported an ongoing outbreak/incident (last 7 days)
What is the situation with education, children and young adults?
Childcare settings
The latest National Situation Background Assessment Recommendation (SBAR) report covering 2 August 2021 to 8 August 2021 reported 6* new clusters in childcare settings last week, compared to no new clusters reported the previous week.
Schools
No new school clusters have been reported as schools are currently closed for summer holidays. However IMTs continue to monitor ongoing clusters. There were 0* new and 9* ongoing clusters associated with schools reported by IMTs last week.
19* incidents are attributed to school settings and 14* to household, social or extra-curricular activities. Source: National SBAR.
*Figures do not include data from Cardiff & Vale
There will be no PHW schools reporting over the summer.
School reporting on hold
School reporting is on hold due to summer holidays. The available data is challenging to interpret, because a large proportion of staff and pupils are not in school.
Further Education (FE)
There were no new* clusters reported relating to FE settings last week, compared with 1 reported the week previously, though it is acknowledged that this is the Summer holiday period for FE settings.
*This figure does not include data for Cardiff & Vale.
Higher Education Institutions (HEIs)
The incidence of new clusters associated with HE settings remains low, with no IMTs reporting new clusters this week for the fourth week running, though it is acknowledged that this is the Summer holiday period for HE settings. Source: National SBAR
Whilst schools, FE and HE settings are closed for summer, due to the data lag, IMTs are still able to report new clusters in these settings. They will also continue to monitor these, therefore we could have ongoing clusters that developed in the last week of the school term being reported for a number of weeks.
Wastewater Monitoring for Covid-19
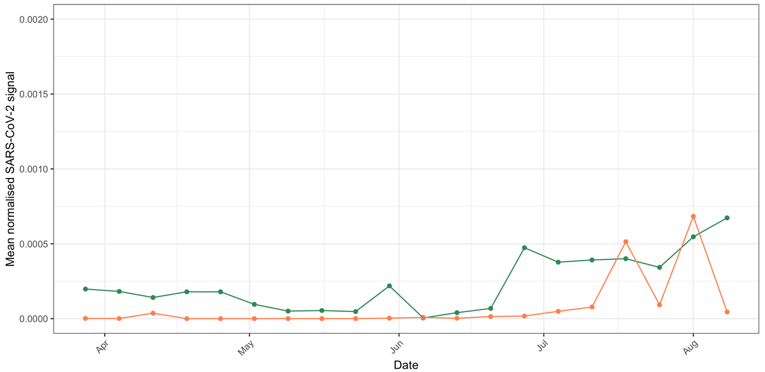
The All-Wales normalised weekly average concentration of SARS-CoV-2 continues to increase for the second week running, suggesting that the level of virus in the community is increasing.
The normalised wastewater SARS-CoV-2 signal across North Wales sites is relatively stable except for Flint and Bangor Treborth wastewater treatment works which show an increasing signal over the last three weeks.
Across South Wales there has been a slight rise (following a relatively stable period 13 March – 1 July 2021) with particular increases seen in Cardiff, Gowerton, Llanelli Coastal and Llanfoist wastewater treatment works.
Some regions in both North and South Wales still have substantial differences in the wastewater SARS-CoV-2 signal compared with PHW COVID-19 case data for the corresponding wastewater catchment areas over the past 6-week period (3-week period to 8 August 2021 compared with the previous 3-week period
The wastewater data for individual WwTW sites, normalised and unnormalised are inherently noisy. Sampling from Treborth** has not been consistent due to construction work at the site, and this is impacting on the North Wales average figures.
|
Region |
Site |
1 August 2021 Mean |
8 August 2021 Mean |
Mean wastewater signal (% change) |
|---|---|---|---|---|
|
North Wales |
Chester * |
60.9 |
0 |
-100% |
|
North Wales |
Flint |
17.3 |
0 |
-100% |
|
North Wales |
Ganol |
387.6 |
9.7 |
-97% |
|
North Wales |
Holyhead |
0 |
0.1 |
|
|
North Wales |
Kinmel Bay |
3.3 |
15.5 |
370% |
|
North Wales |
Llangefni |
2.1 |
0.3 |
-86% |
|
North Wales |
Treborth ** |
N/A |
7.1 |
|
|
North Wales |
Wrexham |
7.3 |
3.1 |
-58% |
|
South Wales |
Cardiff Bay |
62.9 |
193.6 |
208% |
|
South Wales |
Cog Moors |
46.8 |
13.4 |
-71% |
|
South Wales |
Gowerton |
100.6 |
173.8 |
73% |
|
South Wales |
Llanelli Coastal |
15.5 |
112.2 |
624% |
|
South Wales |
Llanfoist (Abergavenny) |
53.7 |
140.7 |
162% |
|
South Wales |
Merlin's Bridge |
0 |
0.7 |
|
|
South Wales |
Merthyr Mawr |
31.5 |
27.5 |
-13% |
|
South Wales |
Newport Nash |
69.8 |
92.1 |
32% |
|
South Wales |
Parc Y Splotts |
13.9 |
123.2 |
786% |
|
South Wales |
Ponthir |
43.7 |
352.9 |
708% |
|
South Wales |
Swansea Bay |
12.4 |
12.9 |
4% |

All-Wales (green line) and North Wales (orange line) normalised weekly average concentration of SARS-CoV-2 (gc/L)
All-Wales (green line) and South Wales (orange line) normalised weekly average concentration of SARS-CoV-2 (gc/L)
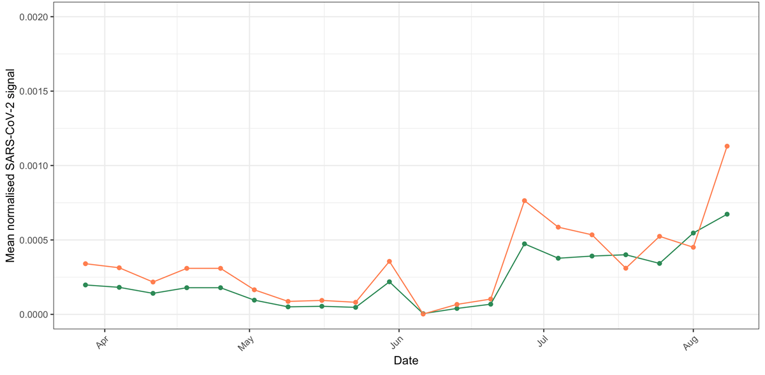
Data between 28/03/21 and 08/08/21
What is the situation with arriving travellers
There are increases in arrivals from Spain, Greece and Poland. The situation in France has improved therefore the restrictions are reduced. Requirements are now dependent on vaccination status as per Amber regulations. Fully vaccinated travellers will no longer need to self-isolate or test after arrival.
11,504 total travellers this week (9,157 last week):
- Red: 141 (164 last week)
- Amber: 10,224 (8,011 last week)
- Green: 1,139 (982 last week)
61 total positive travellers (59 total last week)
- Red: 3 positive travellers (8 last week)
- Amber: 47 positive travellers (39 last week)
- Green: 4 positive travellers (12 last week)
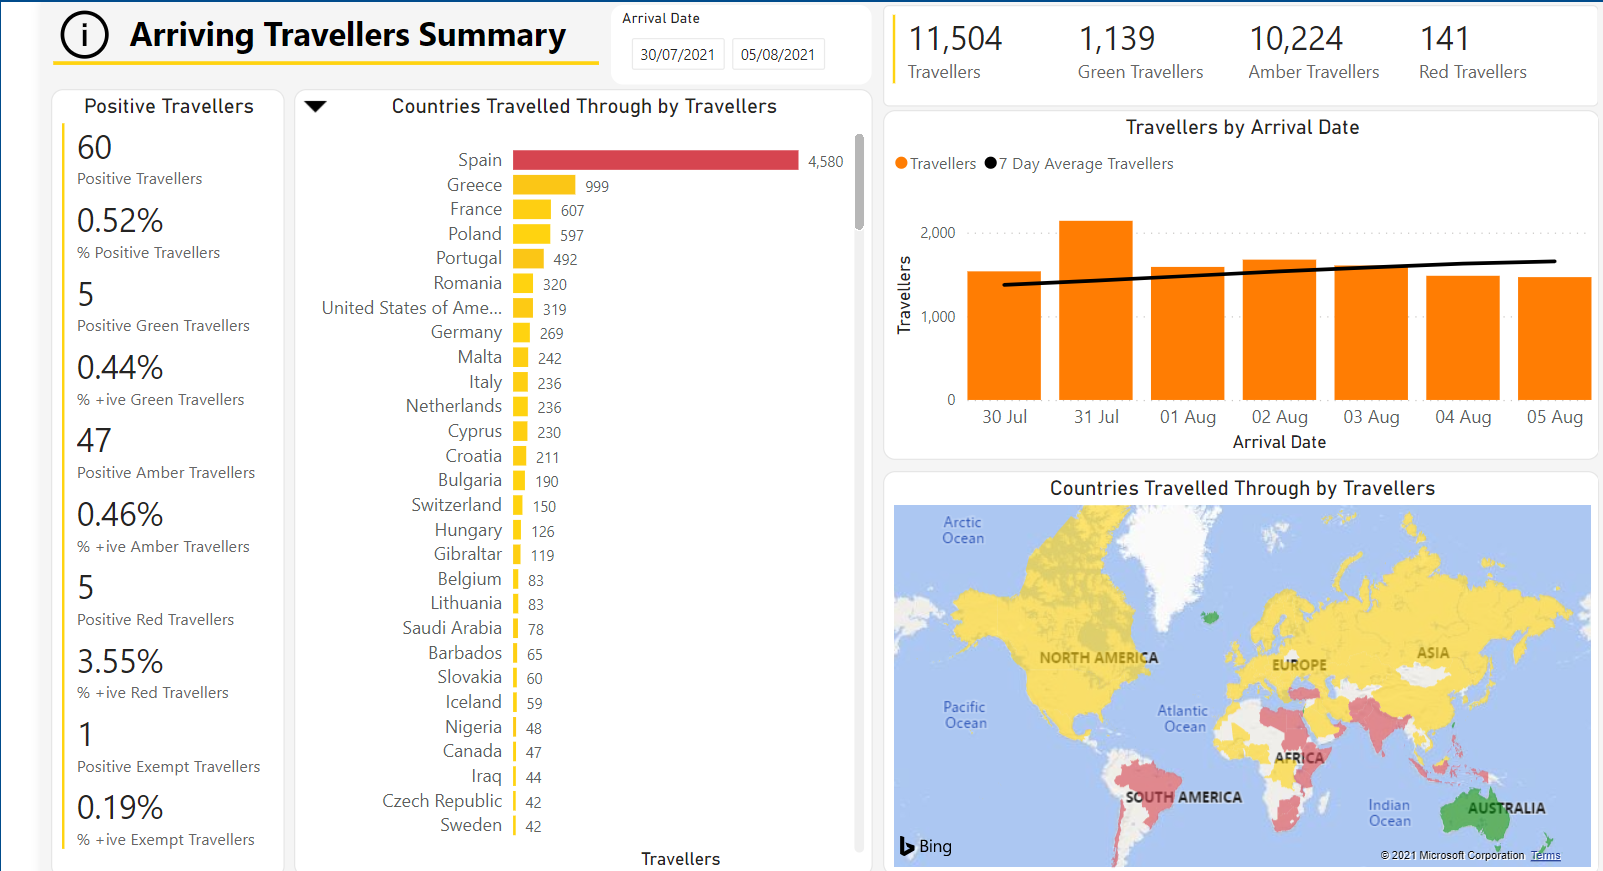


Source: Home Office
Please note that the data provided by the Home Office is derived from Passenger Locator Forms (PLF) which are self-completed by travellers. As such, data may contain inaccuracies. Due to the limitations associated with data capture and legislation, some minor discrepancies may be present in the data.
Mobility data, adherence and UK comparison
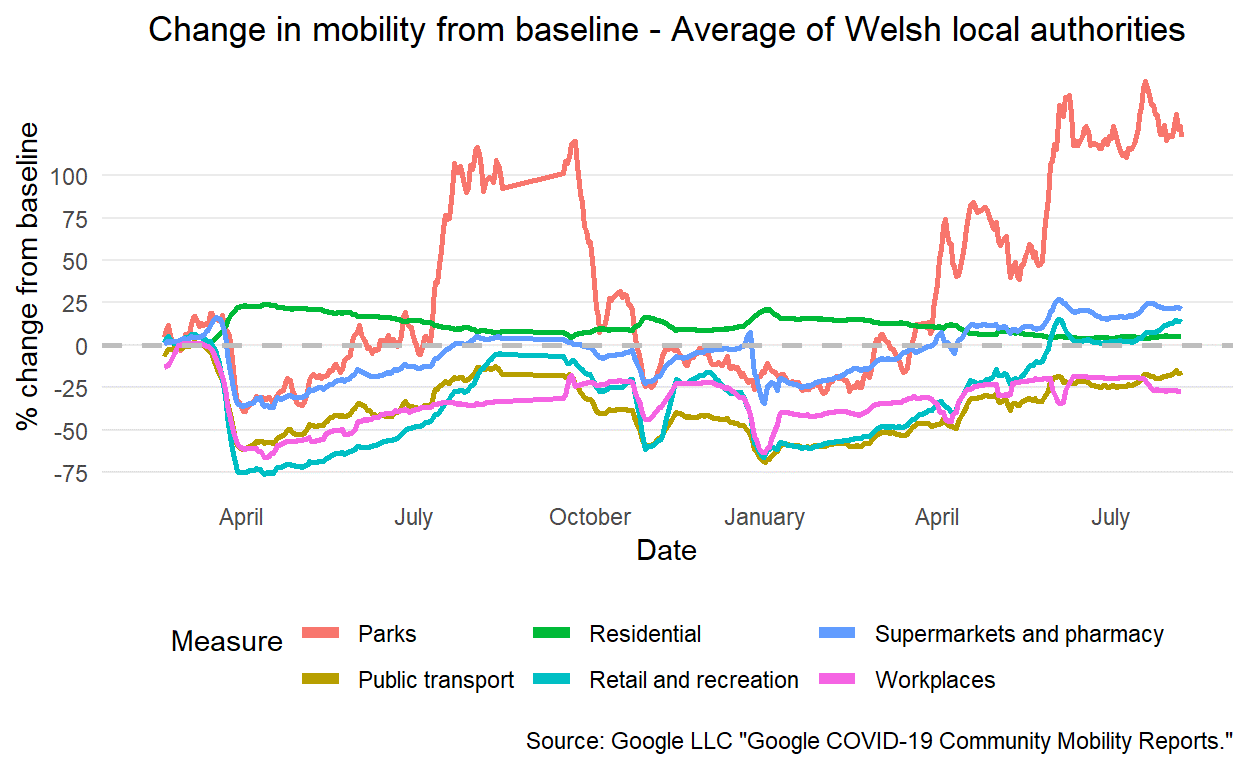
Mobility data by location of trip, Welsh local authorities
Mobility increased in the latest week across several categories, with some remaining the same. The baseline for much of the data is during January to February 2020 and changes are relative to that period. It is not possible to determine if mobility is higher/lower than would have been expected prior to the pandemic as data for 2019 or earlier years is not published.
Adherence
The most recent IPSOS MORI data for the period 30 July – 2 August for Wales shows a reduction compared with the last survey wave in those trying to maintain 2m from people when out, while those only leaving home for essential trips remained steady. It should be noted that this is self-reported adherence and will be affected by individuals’ understanding of the rules and circumstances that apply to them.
The latest results from the Public Engagement Survey on Health and Wellbeing during Coronavirus Measures (2 – 8 August) shows that 81% of people said they understand current restrictions in Wales ‘very well’ or ‘quite well’. When asked ‘how much would you say you are following the restrictions?’ on a scale of 1 to 10, where 10 is ‘completely’, 80% of people ranked themselves at 8 or higher.
Results from the Coronavirus (COVID-19) Infection Survey, 18 July to 24 July
The percentage of people testing positive has decreased in England and Scotland in the most recent week. Positivity has increased in Northern Ireland in the most recent two weeks, whilst the trend is uncertain for Wales.
It is estimated that an average of 14,100 people in Wales had COVID-19 (95% credible interval: 8,900 to 20,500), equating to around 1 in 220 people or 0.46% of the community population (up from 0.43% last week). This compares to around 1 in 75 people in England, around 1 in 190 people in Scotland, and around 1 in 55 people in Northern Ireland.
Source: Office for National Statistics COVID-19 Infection Survey.
Positivity rates (%) across UK countries up to 7 August 2021

Vaccine and immunity status
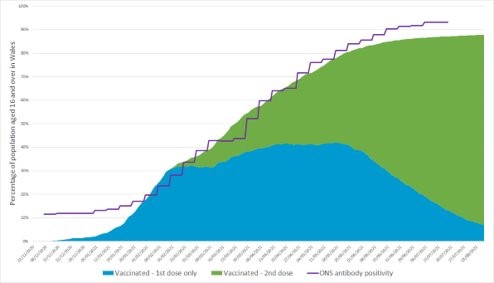
Vaccination and antibody status of individuals aged 16 and over in Wales
Immunity estimates and antibody status of individuals aged 16 and over in Wales
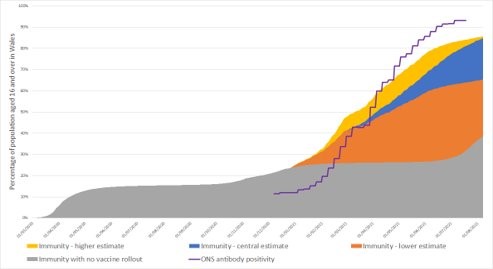
The COVID-19 vaccination rollout of first doses has slowed in Wales, but rollout of second doses continues to progress well. As at 7 August 2021, 88% of people aged 16 and over had received at least one COVID-19 vaccine dose in Wales. 7% of people aged 16 and over had exactly one vaccine dose and 81% were fully vaccinated.
Between 12 and 18 July 2021, the ONS COVID-19 Infection Survey estimated that 93.2% of the community population aged 16 and over in Wales tested positive for COVID-19 antibodies.
As at 7 August 2021, it is estimated that 85% of people aged 16 and over in Wales had some immunity against COVID-19 infection. The lower and higher estimates of immunity are 65% and 86% of people aged 16 and over in Wales. If no vaccines had been administered, it is estimated that 39% of people aged 16 and over would be immune. These estimates assume 84% of natural infections lead to immunity, but do not account for waning immunity (SIREN study paper, The Lancet, published 9 April 2021).
It is currently estimated that over 80% (may be closer to 90%) of the population, spread evenly across Wales, must be immune to COVID-19 before population immunity effects would be observed (TAG advice on the Delta variant, published 18 June 2021). Note that the immunity estimate of 85% is for individuals aged 16 and over, not the total Wales population, and varies across age groups.
Differences between antibody presence and immunity estimates include:
- ONS antibody estimates are based on study participants who have volunteered for the study and estimates are extrapolated
- ONS estimates are based on the 16+ community population, which excludes people in care homes or hospitals. Immunity estimates are based on the whole 16+ Wales population
- While antibody protection doesn’t equal immunity from infection, it does give a useful indication of the level of protection from infection in the Welsh population.
- Antibody estimates use 2019 mid-year population estimates while we use 2020 estimates
Source: ONS COVID-19 Infection Survey, PHW, SPI-M, Swansea University modelling.
What does the situation look like going forward?
Based on the current rates observed with current restrictions:
Cases
The probability of incidence reaching greater than 200 per 100,000 between 22 August and 28 August is below 80% for all local authorities. The figure illustrates the probability (between 0 – 100%) of incidence being greater than 200 per 100,000. Source: Imperial College London.
Probability of greater than 100 per 100,000 cases by local authority

15 to 21 August 2021 and 22 to 28 August 2021
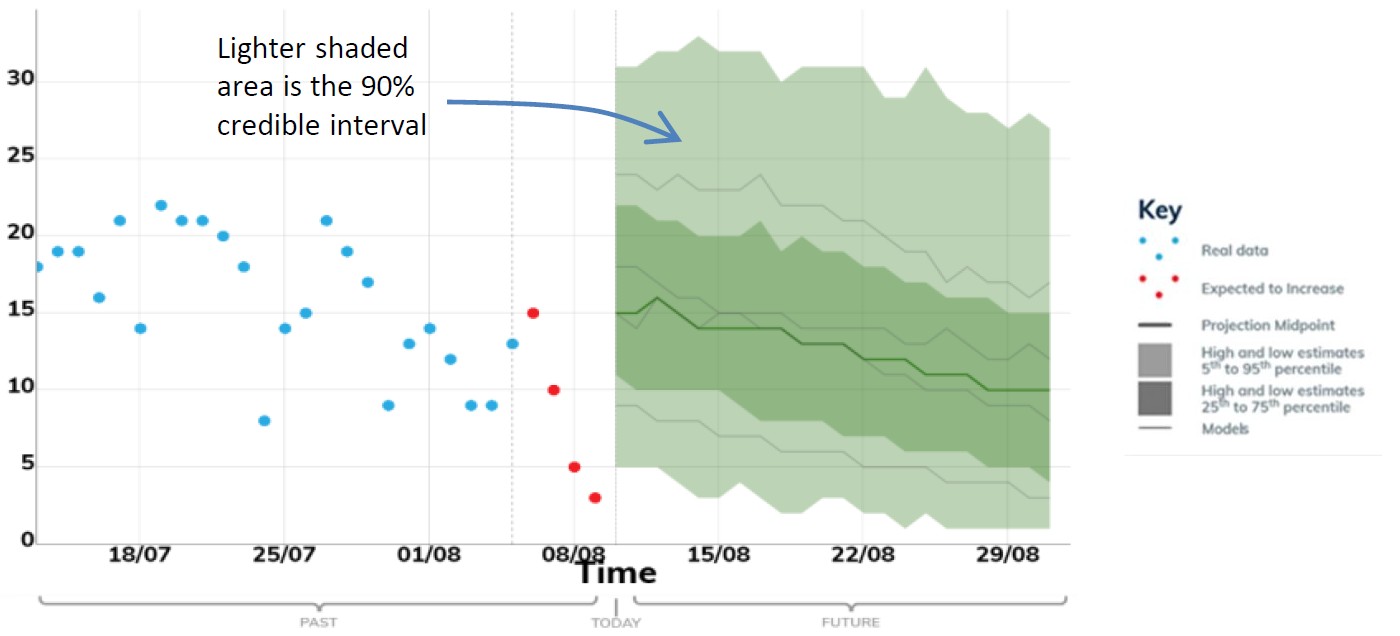
Deaths per day
SPI-M's consensus view is that the number of deaths in Wales will remain low compared with previous waves over the next three weeks. Source: Modelled medium term projections, SAGE/SPI-M, 11 August.
Number of deaths per day, Wales
Projecting forwards is difficult when numbers fall to very low levels, therefore SPI-M-O have decided to pause producing medium term projections where this is the case. SPI-M's consensus view is that the number of deaths in Wales will remain low over the next three weeks.
Hospitalisations per day
Projected to decrease slightly to around 10 per day over the next three weeks. Source: Modelled medium term projections, SAGE/SPI-M, 11 August.
These projections are based on current trends and will not fully reflect the impact of policy or behavioural changes over the past two to three weeks. The projections include the impact of vaccines, but cannot capture any future increases in transmission resulting from new variants. They are not forecasts or predictions.
Key risks and sources
Key risks
Transmissions, incidence and prevalence
Overall transmission, percentage of people testing positive is slightly decreasing since last week.
Trends vary across health boards and local authorities.
NHS Capacity
COVID-19 pressure on the NHS has been generally increasing over recent weeks.
Mortality
Low numbers of deaths in the most recent week.
Variants
Wales has 13,360 confirmed cases of the dominant Delta variant (an increase of 1,889 from the previous week) Delta remains the dominant variant of COVID-19 in Wales.
Immunity and vaccines
4.42 (+0.03) million doses of COVID-19 vaccine have been given in Wales, of which 2.3 (+0.00) million were first doses and 2.12 million (+0.03) were second doses. 85% of those aged 16 and over in Wales were estimated to have some immunity against COVID-19 infection at 7 August.
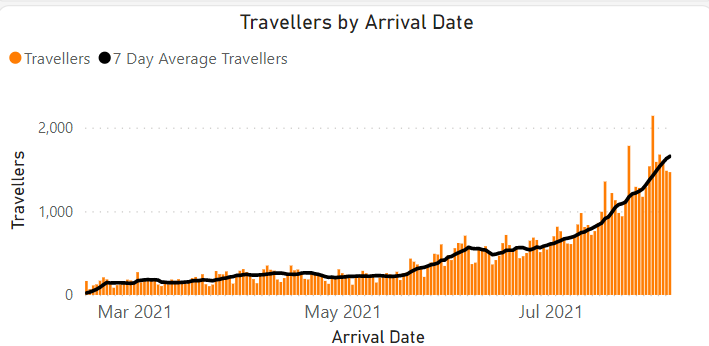
International
There is an increase in travellers numbers this week, however positive rates are relatively low.