Coronavirus (COVID-19) infection survey (positivity estimates): 13 to 19 February 2021
Analysis of the proportion of people testing positive for COVID-19 for 13 to 19 February 2021.
This file may not be fully accessible.
In this page
The Coronavirus (COVID-19) Infection Survey (CIS) is run across the whole of the UK and aims to estimate:
- how many people have the infection over a given time (positivity);
- how many new cases occur over a given period (incidence); and
- how many people have antibodies to COVID-19.
The survey helps track the extent of infection and transmission of COVID-19 among people in private residences, referred to as the community population.
Proportion of people in Wales who had COVID-19
For the week of 13 to 19 February 2021 it is estimated that an average of 0.48% of the community population had COVID-19 (95% credible interval: 0.36% to 0.62%).
This equates to around 1 in 205 individuals (95% credible interval: 1 in 275 to 1 in 160), or an estimated 14,700 people in total (credible interval: 11,100 to 18,800.
The positivity rate has continued to decrease in the most recent week.
Since the estimates are based on a relatively low number of positive tests, there is some uncertainty and the results should be interpreted with caution.
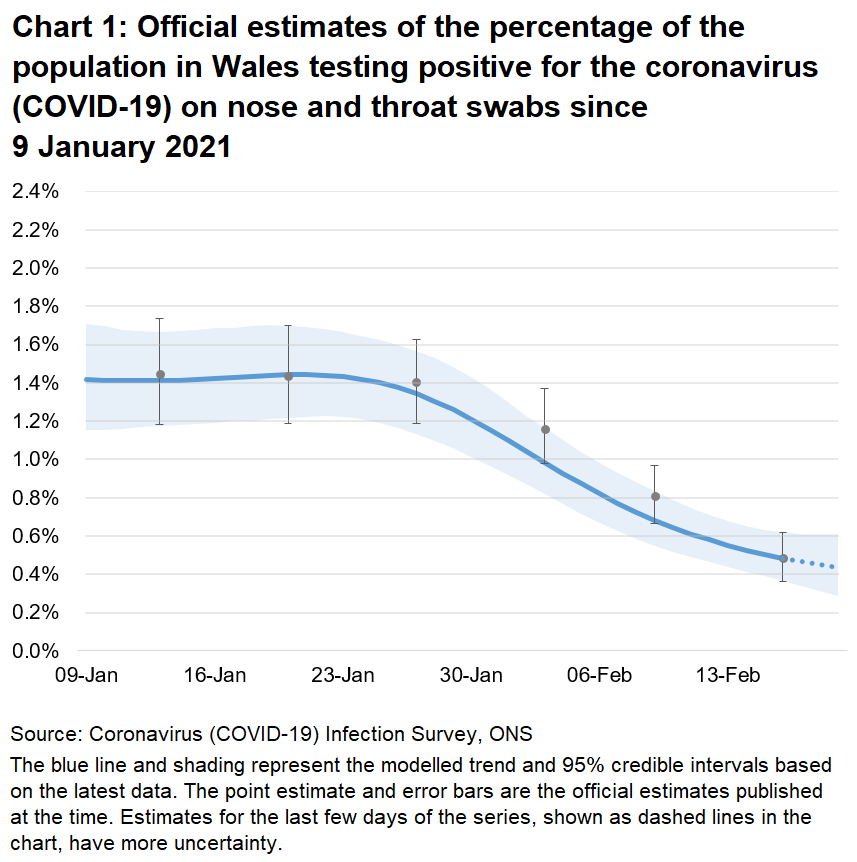
The time span for modelling positivity has been reduced by a day to accommodate a bank holiday. This does not change the overall message for the modelled estimates.
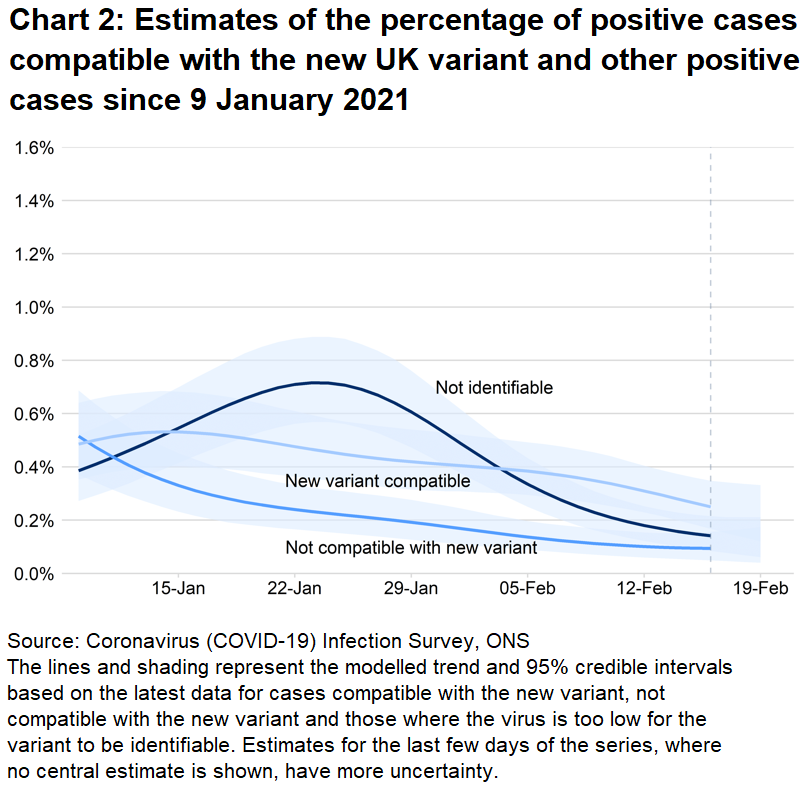
Cases compatible with the new UK variant, cases not compatible with the new UK variant and cases where the virus is too low for the variant to be identifiable have all decreased in Wales in the most recent week.
Cases where the virus is too low for the variant to be identifiable are often due to individuals having had the virus for a longer period of time.
Further information on the classification of positive cases can be found on the ONS website.
Please note that there is a greater lag in data from the infection survey than from other sources such as Public Health Wales.
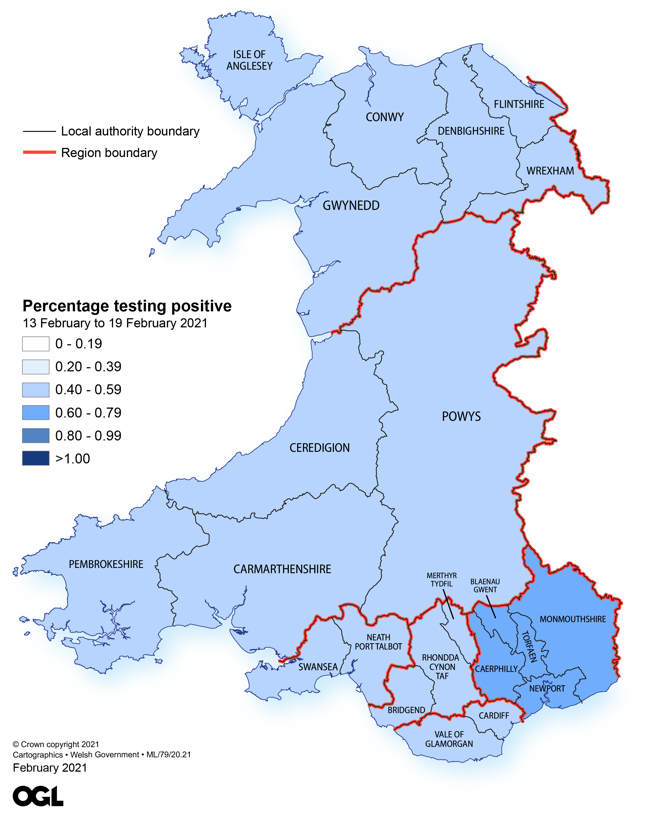
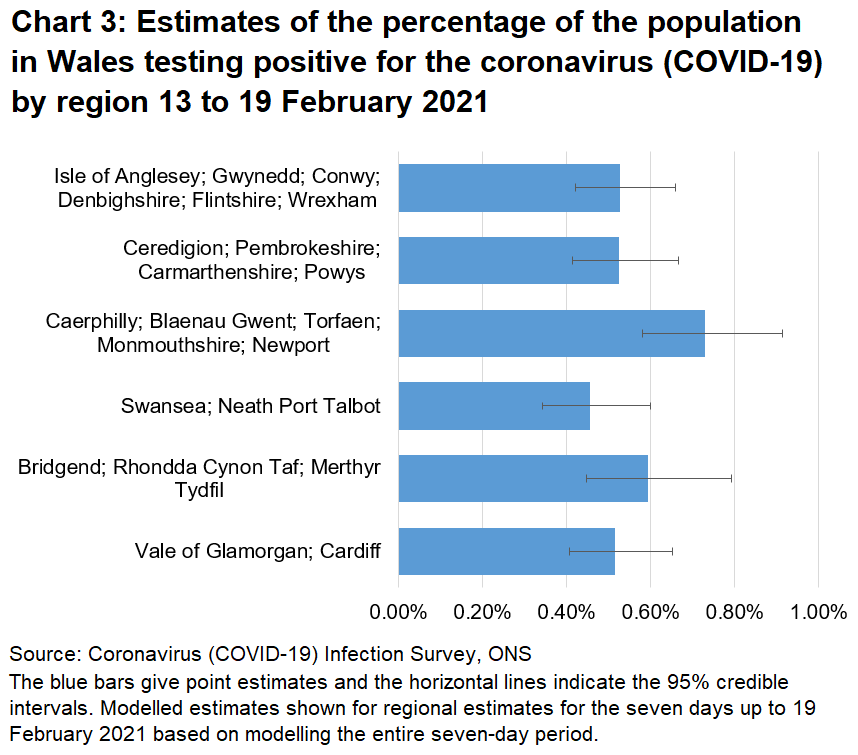
Modelled estimates are provided for regions in Wales. Estimates are provided for the seven days up to 19 February 2021 based on modelling the entire seven-day period.
Rates of positive cases are highest in the region covering Caerphilly, Blaenau Gwent, Torfaen, Monmouthshire and Newport.
Due to smaller sample sizes, there is a higher degree of uncertainty in estimates for individual regions, as indicated by larger credible intervals.
The categories used in the map below have been updated since the previous release and therefore are not comparable.
Figure 1: Estimates of the percentage of the population in Wales testing positive for the coronavirus (COVID-19) by region between 13 and 19 February 2021
Source: Coronavirus (COVID-19) Infection Survey, ONS
Rates of positive cases vary by age, and appear to have decreased in all age groups in recent weeks.
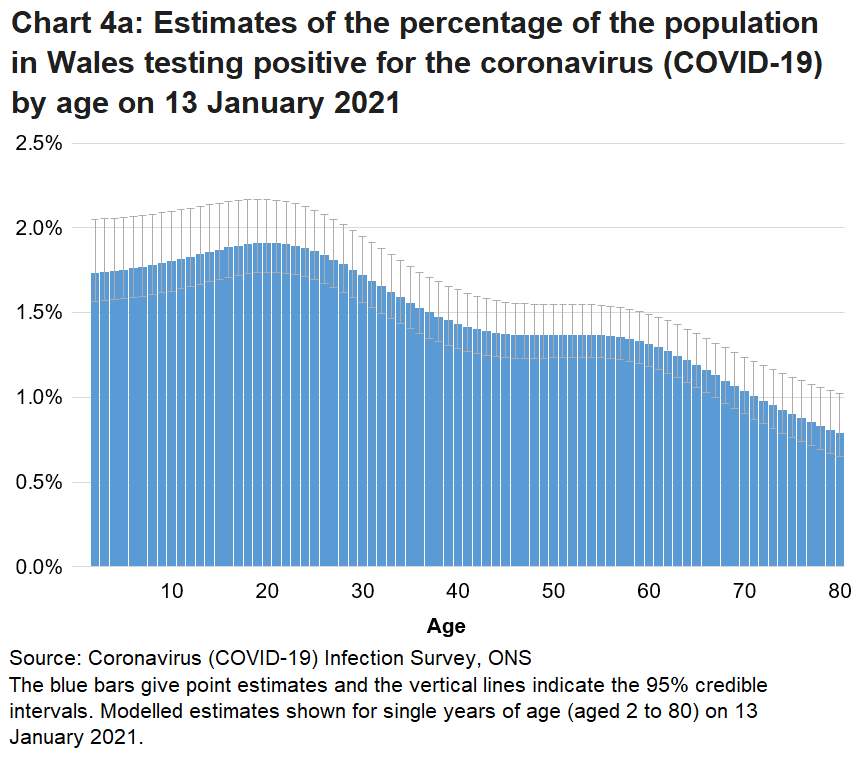
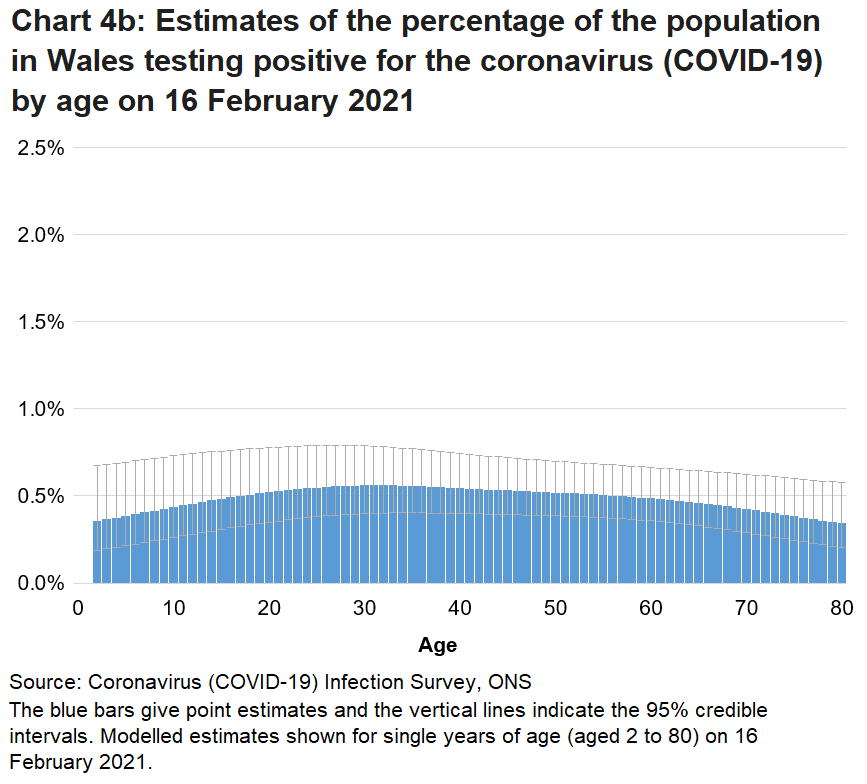
In the data used to produce these estimates, the number of people sampled in the different ages who tested positive for COVID-19 was lower relative to Wales overall. This means there is a higher degree of uncertainty in estimates for individual age groups over this period, as indicated by larger credible intervals.
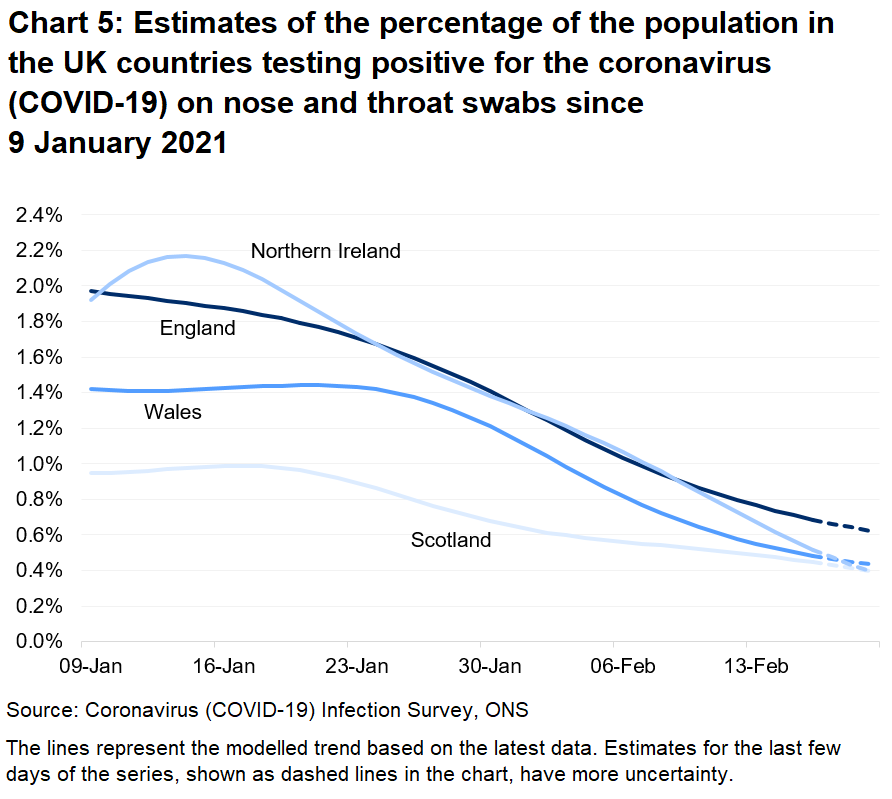
The percentage of people testing positive for COVID-19 by single year of age since 9 January 2021 for Wales, Northern Ireland and Scotland is provided in the ONS dataset.
Estimates for the countries of the UK
At the midpoint of the most recent week (13 to 19 February 2021) the highest estimated percentage of the community population with COVID-19 among the nations of the UK was in England (0.69%).
There is some uncertainty around the individual point estimates for the nations. Estimates for the last few days of the series, shown as dashed lines in the chart below, have more uncertainty.
| Positivity rates (95% Confidence Interval) |
|||
|---|---|---|---|
| Wales | 0.48% (0.36 to 0.62) |
1 in 205 people (1 in 275 to 1 in 160) |
14,700 people (11,100 to 18,800) |
| England | 0.69% (0.64 to 0.74) |
1 in 145 people (1 in 155 to 1 in 135) |
373,700 people (346,400 to 401,300) |
| Scotland | 0.45% (0.35 to 0.55) |
1 in 225 people (1 in 285 to 1 in 180) |
23,400 people (18,600 to 29,000) |
| Northern Ireland | 0.52% (0.36 to 0.71) |
1 in 195 people (1 in 280 to 1 in 140) |
9,500 people (6,600 to 13,100) |
Source: Coronavirus (COVID-19) Infection Survey, ONS
Definitions
Community population
This survey covers people living in private households only and this is referred to as the community population. Residents in hospitals, care homes and/or other institutional settings are excluded.
Confidence intervals
A confidence interval gives an indication of the degree of uncertainty of an estimate, showing the precision of a sample estimate. The 95% confidence intervals are calculated so that if we repeated the study many times, 95% of the time the true unknown value would lie between the lower and upper confidence limits. A wider interval indicates more uncertainty in the estimate. Overlapping confidence intervals indicate that there may not be a true difference between two estimates.
Credible intervals
A credible interval gives an indication of the uncertainty of an estimate from data analysis. 95% credible intervals are calculated so that there is a 95% probability of the true value lying in the interval.
Incidence
The number of new infections over a period of time.
Modelled estimates
Estimates of positivity from this survey are based on statistical modelling of the underlying data. The model smooths the series to understand the trend and is revised each week to incorporate new test results.
Point estimates
The headline point estimates are based on the modelled trend and are reflect the most representative reference point for the given week.
Positivity rate
The estimated proportion of people who test positive for coronavirus (COVID-19) at a point in time, with or without symptoms, based on nose and throat swabs.
Quality and methodology information
The results of the survey are based on self-administered nose and throat swabs provided by participants to the study. A subgroup of participants also provide blood test, taken by trained field staff.
As well as looking at overall incidence, positivity and antibody level, the survey will be used to examine the characteristics of those testing positive for COVID-19 and the extent to which those infected experience symptoms. The results are for private households only and do not apply to those in hospitals, care homes or other institutional settings. This is referred to as the community population.
The survey covers all the countries of the UK, enabling estimates to be calculated for each country individually, and in time the UK as a whole. Fieldwork started first in England on 26 April meaning there is more cumulative data available for England enabling more detailed analysis at present. Fieldwork began in Wales on 29 June 2020 followed by Northern Ireland on 26 July and Scotland on 21 September.
It is important to note that there is a significant degree of uncertainty with the estimates. This is because, despite a large sample of participants, the number of positive cases identified is small. Estimates are provided with 95% credible or confidence intervals to indicate the range within which we may be confident the true figure lies.
The modelled estimates are carried out afresh each week using the previous 6 weeks’ data. The model works by smoothing the series to understand the trend and is revised each week to incorporate new test results. This means that the latest estimate for an earlier period may be different to the official estimate that was produced at the time. Chart 1 shows the latest modelled trend and the official (point) estimates that were published at the time.
The Office for National Statistics (ONS) publishes weekly statistical bulletins and references tables and periodic statistical articles which include results for England, Wales, Northern Ireland and Scotland as they become available. The estimates for Northern Ireland and Scotland are published by the respective administrations, as we do here for Wales.
Further information about quality and methodology can be found on the ONS website and the survey pages on the Oxford University site.
Well-being of Future Generations Act (WFG)
The Well-being of Future Generations Act 2015 is about improving the social, economic, environmental and cultural well-being of Wales. The Act puts in place seven well-being goals for Wales. These are for a more equal, prosperous, resilient, healthier and globally responsible Wales, with cohesive communities and a vibrant culture and thriving Welsh language. Under section (10)(1) of the Act, the Welsh Ministers must (a) publish indicators (“national indicators”) that must be applied for the purpose of measuring progress towards the achievement of the Well-being goals, and (b) lay a copy of the national indicators before Senedd Cymru. The 46 national indicators were laid in March 2016.
Information on the indicators, along with narratives for each of the well-being goals and associated technical information is available in the Well-being of Wales report.
Further information on the Well-being of Future Generations (Wales) Act 2015.
The statistics included in this release could also provide supporting narrative to the national indicators and be used by public services boards in relation to their local well-being assessments and local well-being plans.
Next update
5 March 2021
Contact details
Statistician: Lisa Bloemberg
Telephone: 0300 025 0166
Email: kas.covid19@gov.wales
Media: 0300 025 8099
SFR 54/2021