Analysis of Flying Start outcomes using linked data: childcare and Foundation Phase baseline assessments
This evidence brief presents initial research findings produced by analysing data from Flying Start childcare linked with data on the outcomes of Foundation Phase Baseline Assessments.
In this page
The project linked Flying Start programme childcare data for Swansea with routine education records.
Key findings and context
In this analysis we linked information from 1,081 children who received Flying Start childcare services in Swansea prior to their Foundation Phase on-entry assessment outcomes. This allows us to see the number of Flying Start childcare sessions agreed for each child (their ‘take-up’), and how many they attended (their ‘attendance’). We can then compare this to their Foundation Phase baseline assessments on entry to primary school, which is usually within the first six weeks of Reception Year[1]. At this stage the majority of typically developing children are expected to be assessed at the developmental outcome level two. For this reason, this analysis describes children achieving outcomes at level two or above as ‘achieving expected outcomes’, and children achieving outcome level one or below as ‘below expected outcomes’.
This analysis specifically looks at how outcomes achieved at Foundation Phase on-entry assessment differ between children with different levels of take-up and attendance of Flying Start childcare. The aim is to build on the linking of childcare data to educational outcomes and consider the potential relationships between these outcomes and the take-up of and attendance of Flying Start childcare. In this analysis the developmental outcome considered is measured by on-entry assessment. On entry assessment results for children across Wales are published each year in the statistical release ‘Academic achievement of pupils aged 4 to 14 in core subjects’.
Our analyses suggest:
- comparing on-entry assessment results for all children in Swansea shows that generally children receiving Flying Start childcare tend to meet their expected outcomes less often than the average for Swansea. This is expected, as Flying Start is targeted at children from income deprived households, who, evidence suggests, tend to perform less well on average.
- when comparing on-entry assessment results for children who received Flying Start childcare, those with higher Flying Start attendance tended to meet their expected outcomes in all areas of learning more often than those with lower Flying Start attendance. This difference in outcomes between those with high and low attendance was even greater for children with higher take-up
The developmental differences between children from deprived and non-deprived areas on starting school is highlighted in this analysis by the difference in on-entry assessment results between children in Flying Start and the average for all children in Swansea. Whilst it is recognised a wide range of approaches is needed to tackle the issues contributing to these gaps, this analysis suggests that Flying Start may be a contributor. Though evidence suggests that it is difficult to close the gap completely, this analysis suggests that Flying Start may have helped children from deprived areas begin their school journey at a development stage closer to those of their less deprived counterparts than they may have done otherwise.
[1] Most assessments are undertaken when the child enters reception class at age 4 to 5, although schools are encouraged to assess the child on entry to the Foundation Phase, at whatever earlier age that may be.
Outcomes in Swansea local authority and Flying Start
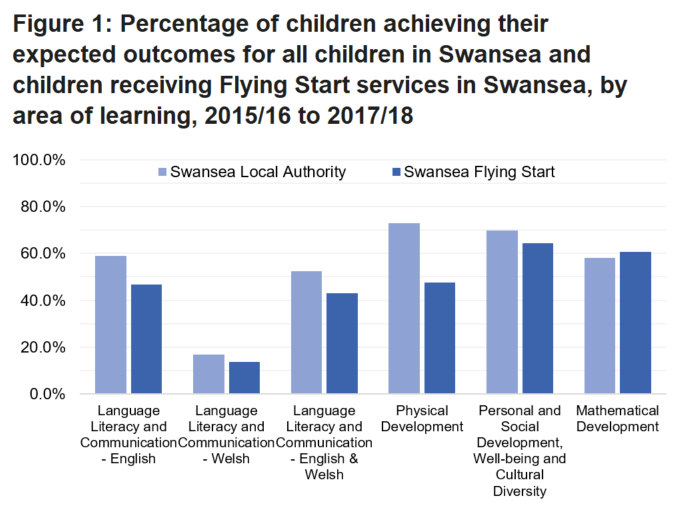
We compared the on-entry baseline assessment outcomes for all children in Swansea to children receiving Flying Start services in Swansea. In the majority of areas of learning children receiving Flying Start services were less likely to achieve their expected outcomes than children in Swansea as a whole. In one area of learning (mathematical development) a slightly higher percentage of children receiving Flying Start services were assessed at outcomes at or above their expected outcome level. These can be seen in figure 1 where for:
- Language, Literacy and Communication skills (English) 46.7% of children receiving Flying Start services were assessed at or above their expected outcome level, compared to 59.0% of all children in Swansea. This is 12.4 percentage points lower
- Language, Literacy and Communication skills (Welsh) 13.6% of children receiving Flying Start services were assessed at or above their expected outcome level, compared to 16.8% of all children in Swansea. This is 3.3 percentage points lower
- Mathematical Development 60.6% of children receiving Flying Start services were assessed at or above their expected outcome level, compared to 58.1% of all children in Swansea. This is 2.5 percentage points higher
- Physical Development 47.5% of children receiving Flying Start services were assessed at or above their expected outcome level, compared to 73.0% of all children in Swansea. This is 25.5 percentage points lower
- Personal and Social Development, Well-being and Cultural Diversity, 64.2% of children receiving Flying Start services were assessed at outcome at or above their expected outcome level, compared to 69.7% of all children in Swansea. This is 5.5 percentage points lower.
Outcomes by uptake and attendance
To assess whether the extent of engagement with Flying Start childcare may impact Foundation Phase on-entry assessment results, children were split according to their levels of take-up and attendance. Two categories for take-up were created, based on the number of sessions a parent signed their child up for[2]. Flying Start children aged two may take up to as many as five 2.5 hour sessions a week, every week for three terms over the year, however some may take up fewer sessions per week, or fewer than three terms. For the purposes of this analysis we have identified children who took up 156+ sessions (which equates to an average of four or more sessions per week over three terms, or five sessions per week for two terms) as ‘high take-up’ of childcare. Children who took up less than 156 sessions are identified as ‘low take-up’ of childcare. Attendance was split into high and low attendance, with attendance of at least 80% of sessions attended categorised as ‘high attendance’, and less than 80% attendance as ‘low attendance’.
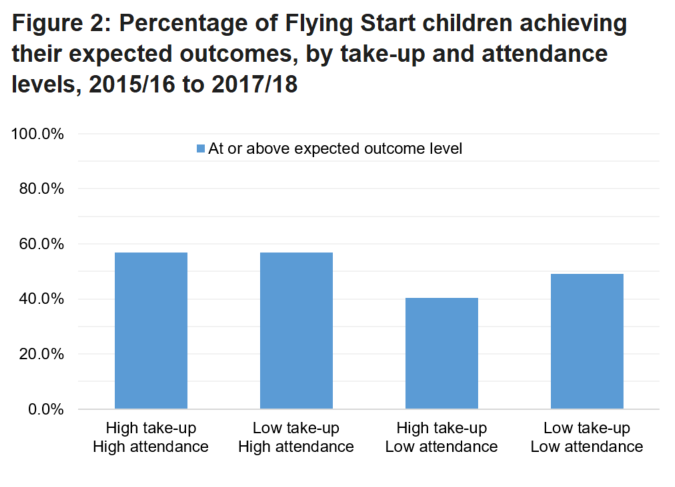
This made 4 categories called:
- High take-up, high attendance (156+ sessions signed up for, 80%+ attendance)
- High take-up, low attendance (156+ sessions signed up for, <80% attendance)
- Low take-up, high attendance (<156 sessions signed up for, 80%+ attendance)
- Low take-up, low attendance (<156 sessions signed up for, <80% attendance)
Children with higher attendance were most likely to achieve their expected outcomes than those with low attendance, regardless of their take-up. Children with high take-up but lower attendance were least likely to achieve their expected outcomes.
For children with high attendance 57% were at or above their expected outcome level compared to 46% of those with low attendance, a gap of 10.9 percentage points. This may indicate that high attendance of Flying Start childcare sessions contributes towards children being more likely to achieve their expected outcomes. Alternatively it may indicate that other factors associated with high attendance are also associated with a greater likelihood of children achieving their expected outcomes.
When splitting attendance by levels of take-up, the difference in the percentage of children achieving their expected outcome is greater for children in the high take-up categories compared to children in the low take-up categories. For children with high take-up, there was a 16.5 percentage point gap in children achieving their expected outcomes between children classed as having high attendance and those children classed as having low attendance. For low take-up children this gap was only 7.7 percentage points. For those with high take-up the larger gap between high and low attendance children is due to fewer children in the low attendance category being at or above the expected outcome level for their age. This pattern may be caused by a number of external factors affecting individual circumstances, the reasons for this would require further consideration.
[2] Take up may be based on a number of factors including parents’ choice or limited eligibility due to transferring into or out of a Flying Start area
Outcomes by area of learning
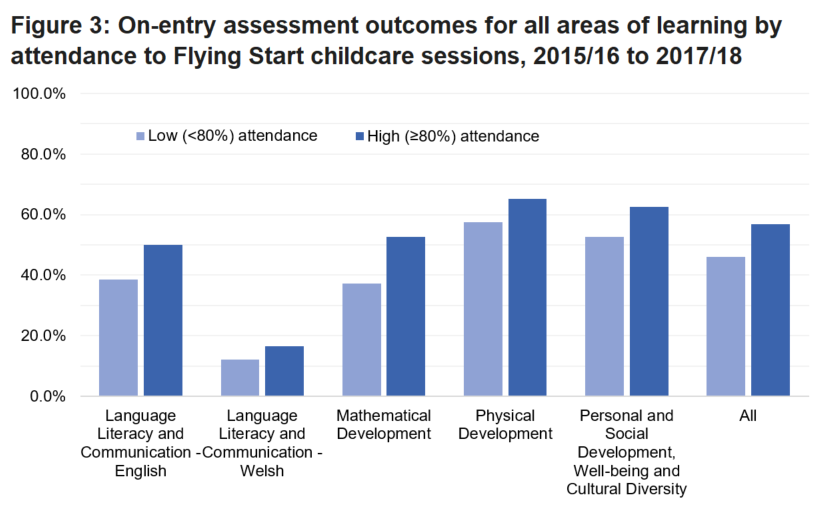
To assess whether attendance at Flying Start childcare has different impacts for different areas of learning, on-entry assessments were grouped according to the child’s attendance category. Children with high attendance had attended 80% or more of the sessions they were signed up for, whilst children with low attendance had attended fewer than 80% of the sessions they were signed up for.
In every area of learning children with high attendance had a higher percentage of on-entry assessments at or above the expected outcome for their age than children with low attendance. Over all areas of learning, there was a 10.9 percentage point increase in assessments at or above the expected outcome level for children in the high attendance category.
The largest difference between outcomes was in mathematical development, where there was a 15.2 percentage point increase in assessments at or above the expected outcome level for children with high attendance compared to children with low attendance. The smallest differences between outcomes were for language, literacy and communication skills in Welsh, and in Physical Development, where there were 4.5 and 7.8 percentage point increases respectively in assessments at or above the expected outcome level for children with high attendance compared to children with low attendance. It is worth noting however, that children completing Foundation Phase on-entry assessments through the medium of Welsh are known to achieve outcome level two at this stage less frequently than children being assessed in English. This can be explained by the number of pupils from non-Welsh speaking households whose parents choose to enrol them at a Welsh medium school. Across Swansea, only 3.5 percent of primary school children are known to speak Welsh at home. Previous analysis has shown that by the end of the Foundation Phase the vast majority of children go on to achieve their expected outcome in this area of learning. The number of children attending Flying Start in Swansea and then being assessed for language, literacy and communication skills in Welsh is also very small, being fewer than 100 children.
Quality and methodology
Methodology
Data on Flying Start childcare and Foundation Phase on-entry assessments were linked and analysed in SAIL. On-entry assessment outcomes data is from 2015/16 to 2017/18, aligned with the available data on Flying Start childcare at the time of analysis. Findings relate only to the pilot area of Swansea Council, and no statistical testing has been carried out to confirm significance of relationships implied.
Take-up levels were aggregated into the categories at least 156 sessions taken up, and less than 156 sessions take up. This recognises children that may have agreed to attend 5 sessions a week over 2 terms or children that have agreed to attend more than 3 sessions a week over 3 terms. This would be considered high take-up across the programme.
Attendance was aggregated into categories of at least 80% of sessions taken up attended, or less than 80% of sessions taken up attended. This recognises Swansea Flying Start’s aim for parents to attend at least 80% of Flying Start sessions. This is a local target for Flying Start attendance, and varies with local authorities across the Flying Start programme.
Children are expected to show a wide range of developmental maturity at the point when Foundation Phase on-entry assessments are carried out. The general expectation is that the majority of children undertaking Foundation Phase on-entry assessments are four years old, and so will be assessed at outcome level two, though a percentage are also expected at outcome levels one and three in each area of learning. For the purposes of analysis, outcome levels were aggregated into the categories of ‘at or above expected outcome level’ and ‘below expected outcome level’. ‘At or above expected outcome level’ includes assessment results at or above outcome level two, whilst ‘below expected outcome level’ includes outcomes at level one or below.
Timeliness and punctuality
The aim of this evidence brief is to publish analysis as soon as possible using the available data. This data includes childcare data which is now contained in the SAIL databank. As the data in SAIL is regularly updated, it would be possible to repeat the analysis in future years. This analysis uses the data available as at October 2020.
Comparability and coherence
No individual level data were available at the time of this analysis for the remaining Parenting Support and Speech and Language and Communication (SLC) Support of the Flying Start Programme. Some individual level Flying Start health data was used in the Emerging Findings report but it was not used for this analysis. It should be noted that children in the Flying Start Childcare sub-groups may differ across a range of characteristics (e.g. socio-economic status, age of parent, home learning environment) and differences in education and health outcomes may be associated with these characteristics rather than amount of Flying Start Childcare or Flying Start Childcare attendance.
Limitations
This analysis has not taken into account other factors that may affect education outcomes (for example, age or socio-economic status of parents or the home learning environment). These may be considered in future analysis of Flying Start using a data linking approach.
The data used for this analysis does not cover all children in Flying Start settings in Swansea since the start of the programme, but only those for which data are available. Neither does the data include children’s attendance at other, non-Flying Start childcare settings. Any conclusions drawn relate only to Flying Start childcare settings in Swansea and do not relate to non-Flying Start childcare settings or childcare settings in general.
Future Releases
Future releases may:
- consider levels of engagement with the health visiting element of the programme
- examine the extent to which Flying Start has achieved the outcomes as envisaged in the Flying Start programme logic model
- analyse data from further local authorities
Acknowledgements
ADR Wales is part of the Economic and Social Research Council (part of UK Research and Innovation) funded ADR UK.
Rachel Shepherd and Ryan Nicholls, along with other members of the ADR Wales team have worked collaboratively to produce this article.
Swansea Council has produced data on childcare and health interventions of Flying Start children and uploaded this data to the SAIL Databank. They have also collaborated with ADR Wales analysts when writing the report to provide an insight into how the Flying Start programme is delivered in Swansea. Their input is gratefully received.
Contact details
Kathryn Helliwell
Telephone: 0300 062 8349
Email: adruwales@gov.wales
Media: 0300 025 8099
We welcome any feedback on any aspect of this report. Please send your feedback by email to adruwales@gov.wales.
Research report number 14/2021
Digital ISBN: 978-1-80082-918-3